APPLYING SWAT AND GIS TO PREDICT IMPACT OF
LANDUSE CHANGE ON WATER YIELD AND LANDUSE
OPTIMAZING IN UPPER CIMANUK CATCHMENT AREA
IWAN RIDWANSYAH
GRADUATE SCHOOL
BOGOR AGRICULTURAL UNIVERSITY
BOGOR
STATEMENT
I am Iwan Ridwansyah states that thesis entitled:
APPLYING SWAT AND GIS TO PREDICT IMPACT OF LANDUSE CHANGE ON WATER YIELD AND LANDUSE OPTIMAZING IN UPPER
CIMANUK CATCHMENT AREA
is s result of my own work under supervision of supervisory committee during the period July 2009 – May 2010 and it has not been published. The content of this thesis has been examined by the advising committee and an external examiner.
Bogor, June 2010
ABSTRACT
IWAN RIDWANSYAH. Applying SWAT and GIS to Predict Impact of Landuse Change on Water Yield and Optimizing Landuse in Upper Cimanuk Catchment Area. Under the Supervision of ASEP SAPEI and MACHMUD A. RAIMADOYA.
Cimanuk River which catchment area of 3,752 km2 is the longest river in West, the river flows from Garut district through Cimanuk delta of Indramayu and Cirebon district. Increasing population growth with rapid changes of social and economy aspects, lead to increasing demand for settlement or agriculture area. Based on Watershed Management (BPDAS) for Cimanuk-Citanduy data, during 1995-2003 about 400,000 trees in forest of Cimanuk catchment area were loss. Increased impervious surfaces are a common cause of increased peak-runoff volumes. Landuse in upper cimanuk catchment area has changed, the mostly into settlement areas. During 1991-2002, conversion of plantation to settlement area was about 131.2 Ha, that of paddy field to settlement was 323.9 Ha, while that of un-irrigated agriculture to settlement was 91.9 Ha. The general objective of the research was to develop SWAT and GIS model to investigate impact of landuse change on water yield and landuse optimization in Upper Cimanuk Catchment Area. The SWAT model simulation was done for the period of 2004 – 2005 while the validation used landuse 2005. The R2 and Nash Sutchliffe Efficiency (NSE) of the calibration were 0.636 and 0.49 respectively. The total surface runoff and total water yield from the simulation were 15.32 mm and 711.2 mm respectively. Those numbers can infer that catchment condition was much better than the simulated landuse of 2002 condition. Optimum landuse scenario was reforestation done on area higher than 1500 m asl.
ABSTRAK
IWAN RIDWANSYAH. Penerapan SWAT dan GIS untuk memprediksi dampak dari perubahan lahan terhadap hasil air dan Optimasi Landuse. Dibimbing oleh ASEP SAPEI dan MACHMUD A. RAIMADOYA.
Sungai Cimanuk dengan luas daerah aliran sungai (DAS) 3.752 Km2 merupakan sungai terpanjang di Jawa Barat. Sungai ini mengalir dari Kabupaten Garut sampai delta Cimanuk di Kabupaten Indramayu dan Cirebon. Penambahan populasi penduduk disertai perubahan yang cepat pada aspek lain seperti sosial dan ekonomi, mengakibatkan penambahan kebutuhan akan lahan pemukiman dan pertanian. Berdasarkan Badan Pengelola DAS (BPDAS) Cimanuk-Citanduy selama 1995 – 2003 sebanyak 400.000 pohon hilang. Penggunaan lahan di DAS Cimanuk Hulu telah berubah, perubahan terbanyak yaitu konversi ke lahan pemukiman, selama 1991 – 2002 konversi perkebunan menjadi pemukiman sekitar 131,2 Ha, sawah menjadi pemukiman adalah 323,9 Ha, sedangkan sawah tadah hujan menjadi pemukiman adalah 91,9 Ha. Konversi lahan bertambah besar pada tahun 2005, dari perkebunan sebanyak 169 Ha, sawah 258,9 Ha dan pertanian 274,4 Ha. Namun, perubahan penggunaan lahan tersebut berdampak besar pada limpasan permukaan. Tujuan umum penelitian ini adalah untuk mengembangkan model SWAT dan SIG untuk memprediksi dampak perubahan tutupan lahan terhadap water yield dan optimasi penggunaan lahan di DAS Cimanuk Hulu. Simulasi model SWAT dilakukan selama 2004 - 2005 dan validasi dilakukan untuk lahan 2005. Kalibrasi model SWAT menghasilkan nilai R2 sebesar 0,636 dan Nash Sutchliffe Efficiency (NSE) sebesar 0,49. Simulasi ini menghasilkan total run-off 15,32 mm dan total water yield 711,2 mm. Hasil simulasi menunjukan bahwa kondisi penggunaan lahan 2005 lebih baik daripada kondisi penggunaan lahan 2002, dimana nilai limpasan permukaan adalah 20,75 mm dan hasil air total 718,8 mm. Hasil optimasi penggunaan lahan adalah pada skenario dimana reboisasi dilakukan pada daerah yang lebih tinggi dari 1500 m dpl.
SUMARRY
IWAN RIDWANSYAH. Applying SWAT and GIS to Predict Impact of Landuse Change on Water Yield and Optimizing Landuse in Upper Cimanuk Catchment Area. Under the Supervision of ASEP SAPEI and MACHMUD A. RAIMADOYA.
Many studies on landuse impacts have been done using land-use scenarios, aimed to forecast the changes in hydrological processes, based on some assumptions on future states of land use. Empirical flood formulas are useful for making quick estimates of peak flow in case of very little data available. Generally these equations are restricted by the size of the basin and the climatic/hydrologic region of the world in which they were developed. Most of the empirical flood formulas describe the relation between peak discharge and drainage area of the basin.
The study on impact of landuse change on hydrological system can be done in three steps; Development of landuse change scenario, Simulation of Hydrology region, and Evaluation on variable hydrologic response of water resources. Landuse change pattern will decrease the region of water availability which can lead to extreme discharge fluctuation, i.e. extreme drought and extreme flood (Pawitan, 1999). The principle of soil conservation must be taken into account in landuse change; otherwise land degradation will likely happen rapidly. Land degradation can be identified by high erosion rate, runoff peak discharge fluctuation, and sedimentation.
The availability of GIS (Geographic Information System) tools and more powerful computing facilities make it possible to handle difficult and limitation of model simulation. The Tools can develop distributed continuous time basin-scale models, based on availability of regional information. Recently several developed models are provided for erosion simulation on basin scale, such as: SWRRB (Simulator for Water Resources in Rural Basins), SWAT (Soil and Water Assessment Tools) and SWIM (Soil Water Models). SWAT is a physically based continuous event hydrology model developed to predict the impact of land management practice on water, sediment, and agricultural chemical yield in large, complex watershed with varying soils, landuse, and management condition over long period of time.
The major objective of the research is to develop SWAT and GIS model to investigate impact of landcover change to water discharge in Upper Cimanuk Catchment Area. The specific objectives are: To create hydrological respond unit (HRU) and water availability, to use SWAT and GIS for determining the impact of landuse change to water yield and to use model simulation to find optimum landuse that ensures the availability of water.
The study covers the period of March to July 2009, but collection of data has been done since 2006. The study area is located in Upper Cimanuk Catchment Area. Located at 107o 42’ 21” E – 107o 58’ 32” E and 7o 7’ 4” S – 7o 24’ 45” S, it has on area about 448.6 km2. Administratively the study area belongs to Garut Regency and approximately 6 hours away from Jakarta. Based on Statistical Bureau data the population of Garut regency consists of 2.196 million people in 2005.
‐ SWAT model, Calibration and Validation ‐ Landuse Change analysis
‐ Impact of Landuse change to water yield and Landuse Optimizing.
Final step of study is optimizing landuse; the process is started by developing the same scenario based on landuse that used for calibration and validation. Optimizing landuse is a selection process to determine the best landuse composition in upper Cimanuk Catchment Area that has good water availability.
Within the process of setting up the model run/input files with MWSWAT a series of operations are required. The first step is generating the catchment and sub-basin boundaries using the DEM. After that we define HRU’s and locate the weather files. MWSWAT operates by taking a Digital Elevation Model (DEM) as an input and delineating the catchment boundary and stream networks based on a threshold number of cells draining to a particular point. Sub-basins are derived automatically based on the stream networks. The user can remove or include additional sub-basins by adding outlets at appropriate locations or junctions of the stream, depending on requirements.
The SWAT model is simulated based on land use of 2005. The simulation also used rainfall and temperature of the same year. The selection of landuse time considers the availability of complete discharge data used for calibration. After the model already calibrated and the value of validation is good enough then the model simulated for 1991, 2007 and several scenarios. The Simulation in different landuse time series is objected to determine the impact of landuse change to water yield.
Optimum Landuse is one of the outputs in this research. The optimization is an effort to use land resources in sustainable based on hydrological system. There are two hydrology criteria, they are; discharge and base flow and to find optimum landuse seven landuse are compared. The landuse condition consists of three landuse series data, three scenarios and one Landuse Planning.
During 1991 to 2005, the largest landuse change is deforestation into plantation (955.6 ha) located in the western part around Mt Papandayan and Mt Kareta. Aside from that, reforestation occurred in about 161.9 ha located around Darajat Electric Power. In the east area most changes was conversion to agriculture area; about 772 ha forest area converted to agriculture which was mainly in mountain area. The table also shows that about 1225 ha is converted to settlement area; these numbers was resulted from plantation, Agriculture, Paddy, and brush. The increasing of settlement area or urbanization drives the change of landuse pattern, which may also have adverse impact on ecological of area, especially hydro-geomorphology and vegetation (Long et al, 2008).
The result of daily simulation showed that simulation has lower base flow and higher peak flow in early year mainly on January 14th 2005. Statistic comparison between observed data and un-calibrated simulation is R2 0.5351; QSimulation = 0.9948
x QObs -9.2574. The Nash Sutchliffe efficiency (NSE) value is 0.411, which is far
from the expected value.
Manual calibration of several parameters resulted in correlation error (R2) of 0.64 where QObs = 0.9655.QSim – 7.6956, and NSE is 0.495,the value of R2 and NSE
value is not good enough and the error is caused by un-detailed soil parameter, where in this model soil map used recognized map with scale 1 : 250,000.
slope and shallow soil depth, caused decrease of water percolation. In the second period (2002-2005) the condition of catchment was better as an impact of reforestation although urban growth still happened.
There were three scenarios developed by spatial query which was aimed to fix catchment condition by reforestation and done in steep slope. The query did not change settlement area, paddy field and other class in low land area of the study area. In scenario1 the area of forest was larger than its real area in 2005. While in scenario 3 the total forest area only changed to 18.61% or increase 51.41 ha. The larger reforestation was assumed in scenario 2, making the total area of forest into 31.05%.
Based on all parameters used for optimization, scenario 2 is much better than the others, where average and total of base flow is higher than other and coefficient of river regime has lower value than other landuse condition
Based on the result of study about SWAT and GIS application to address impact of landuse change on water availability and optimizing landuse in Upper Cimanuk Catchment Area, the general conclusions has been formulated. The population growth and economic development in Upper Cimanuk Catchment Area had an impact on landuse change and also on water availability. Optimizing landuse is aimed to find the best landuse composition that has minimal impact to hydrology condition.
Modeling study depends on input data, some improvements of input and process need to be accomplished in order to achieve better result, especially by using finer resolution of data (spatial and temporal). Besides that, the landuse database used crop and urban of sub-tropical region, so that, the development of tropical crops and urban database is needed for Indonesian condition.
Copyright © 2010, Bogor Agriculture University Copyright are protected by law,
1. It is prohibited to cite all of part of this thesis without referring to and mentioning the sources;
a. Citation only permitted for the sake of education, research, scientific, writing, report writing, critical writing or reviewing scientific problem. b. Citation does not inflict the name and honor of Bogor Agricultural
University.
APPLYING SWAT AND GIS TO PREDICT IMPACT OF
LANDUSE CHANGE ON WATER YIELD AND LANDUSE
OPTIMAZING IN UPPER CIMANUK CATCHMENT AREA
IWAN RIDWANSYAH
A thesis submitted for the degree of Master of Science In Master of Science in Information Technology for
Natural Resources Management
GRADUATE SCHOOL
BOGOR AGRICULTURAL UNIVERSITY BOGOR
External Examiner: Prof. Dr. Ir. Hidayat Pawitan, M.Sc
Research Title : Applying SWAT and GIS to Predict impact of Landuse Change to Water Yield and Optimizing Landuse in Upper Cimanuk Catchment Area.
Student Name : Iwan Ridwansyah Student ID : G051070071
Study Program : Master of Science in Information Technology for Natural Resources Management.
Approved by, Advisory Board
Prof. Dr. Asep Sapei, MS. Ir. Machmud A. Raimadoya, M.Sc Supervisor Co-Supervisor
Endorsed by,
Program Coordinator Dean of the Graduate School
Dr. Ir. Hartrisari Hardjomidjojo, DEA. Prof. Dr. Ir. Khairil A. Notodiputro, MS.
ACKNOWLEDGMENTS
Alhamdulillah, I am grateful to His Lordship Almighty Allah SWT for blessing me to undertake this research study, without which it would have been impossible to complete. At this moment, my feelings of happiness, success, gratitude, and of course occasional frustration through all my life during these years are being recalled. I surely believe that without the help from the following people, I could not have this achievement.
I gratefully extend my thanks to my supervisor Prof. Dr. Asep Sapei, MS and co-supervisor Ir. Mahcmud A. Raimadoya M.Sc for their guidance especially during the development of this research; Prof Dr. Hidayat Pawitan as the external examiner.
My thank goes to Dr. Hartrisari Hardjomidjojo, DEA, as the program coordinator and all my lecturer for having teaching and sharing their knowledge and experience. MIT secretariat and staff for helping and support me to arrange the administration, technical and facilities.
I specially thank to Drs. M. Fakhrudin as Chief of Inland Water Computation System division, Research Centre for Limnology – Indonesian Institute of Science for his support and my colleagues in Hydro-informatics laboratory, Research Centre for Limnology; Mas Hendro, Mas Eko, Agit, Meti, Fajar, Dini, Unggul, Dewi, Awang, and Luki.
I would like to thank my kindly classmates MIT years 2007; Chandra, Rachmat, Jimmy, Budi, Zaenal, Ahmad, and Marten, also for all of my friends at MIT for pleasant friendship and togetherness.
My deep appreciation is extended to all my family members, in particular my lovely wife (R. Nurni Yusnita), my daughter (Atharina Nurjahra R.) and my son (M. Raffa Nurmalik R.) for the continuous encouragement and support during my long absence. Thank you for blessing and affection from my father, mother, brothers and sisters.
CURRICULUME VITAE
Iwan Ridwansyah was born in Bogor, West Java, Indonesia on March 12th 1971. He was graduate from Pakuan University, Faculty of Engineering, and Geological Engineering Department in 2002. He was entered the IPB Graduate School in year 2007. He was enrolled as private student in Master of Science in Information Technology for Natural Resources Management, Bogor Agricultural University in 2007, and completed his master study in 2010. His final thesis is “Applying SWAT and GIS to Predict impact of Landuse Change to Water Yield and Optimizing Landuse in Upper Cimanuk Catchment Area”.
I.
INTRODUCTION
1.1 Background
The autonomy status gives right to local government to manage every natural resource to develop the area. Unfortunately this authority does not consider the knowledge of sustainable development. Many landcover areas are being changed from forest into non-forest area because of increasing land demand. Landcover changes will have impacts; one of them is hydrology process.
Many studies on landuse impacts have been done using land-use scenarios, aimed to forecast the changes in hydrological processes, based on some assumptions on future states of land use. Empirical flood formulas are useful for making quick estimates of peak flow in case of very little data available. Generally these equations are restricted by the size of the basin and the climatic/hydrologic region of the world in which they were developed. Most of the empirical flood formulas describe the relation between peak discharge and drainage area of the basin.
The study on impact of landuse change on hydrological system can be done in three steps; Development of landuse change scenario, Simulation of Hydrology region, and Evaluation on variable hydrologic response of water resources. Landuse change pattern will decrease the region of water availability which can lead to extreme discharge fluctuation, i.e. extreme drought and extreme flood (Pawitan, 1999). The principle of soil conservation must be taken into account in landuse change; otherwise land degradation will likely happen rapidly. Land degradation can be identified by high erosion rate, runoff peak discharge fluctuation, and sedimentation.
Soil erosion, transportation and sedimentation in downstream are natural process, but erosion increase and sedimentation are anthropogenic processes. Human activities in upstream area have changed hydrologic condition resulting to on impact on water and sediment yield. Recent condition of Java hydrology and water resources was characterized by occurrence of extreme floods and drought with high pollutant concentration in water body. The water crisis is anticipated as a real threat which proves that there is an increasing water demand due to population growth and land conversion activities (Pawitan, 2002).
Cimanuk River which catchment area of 3,752 km2 is the longest river in West Java which has an important meaning for people living around the river, the river flows from Garut district through Cimanuk delta of Indramayu and Cirebon district. Increasing population growth with rapid changes of other aspects such as social and economy, lead to increasing demand of settlement or agriculture area. Based on Watershed Management (BPDAS) for Cimanuk-Citanduy data, during 1995-2003 about 400,000 trees in forest of Cimanuk catchment area were loss due to illegal logging, and demand of agriculture area. However, impact of landuse change, such as the extension of settlement or agricultural area, has a profound impact on runoff hydrographs. Increased impervious surfaces are a common cause of increased peak-runoff volumes. This condition will increase erosion, sedimentation on water body, decrease water resources, increase agricultural pollutant, landslide and decrease agricultural production. Now erosion in Cimanuk Watershed reaches 25 ton or 4.3 million m3 sediment per year (PU executive summary).
According to the decree of three ministries, Ministry of Internal Affairs, Ministry of Forestry, and Ministry of Public Work, No.19/1984, No.059/Kpts-II/1984, No.124/Kpts/1984, the Catchment of Cimanuk is one of the 22 critical watersheds.
continuous event hydrology model developed to predict the impact of land management practice on water, sediment, and agricultural chemical yield in large, complex watershed with varying soils, landuse, and management condition over long period of time.
1.2 Problems Statement
Population growth and increasing economic condition have pushed the increased of agriculture productions with intensive agricultural and land expansion even in unsuitable area. The agricultural system is focused on economic benefit, without considering environmental aspect. We can easily find location of a field in steep slope areas having plantation pattern direction exactly the same as the direction of steepness. This condition will increase water discharge.
Landcover in upper cimanuk catchment area has changed; the most changes are conversion to settlement areas. During 1991-2002, about 131.2 Ha of plantation have been converted to settlement area from paddy fields to settlement area about 323.9 Ha, while that of un-irrigated agriculture to settlement about 91.9 Ha. The converted areas became wider in 2005, whereas plantation was 169 Ha, paddy field was 258.9 Ha and agricultural area was 274.4 Ha. Forest and paddy field areas relatively decrease in Upper Cimanuk Catchment area (Daruati, 2008). Landuse and land-cover may have four major direct impacts on hydrological cycle and water quality. The changes can cause floods, droughts and they can affect water quality (Roger, 1994 in Weng, 2001). The process of urbanization has a considerable hydrological impact in terms of influencing the nature of runoff and other hydrological characteristics, pollutant transport to river, and rate of erosion (Goudie, 1990 in Weng, 2001).
1.3 Research Objectives
The major objective of the research is to develop SWAT and GIS model to investigate impact of landcover change to water discharge in Upper Cimanuk Catchment Area.
The specific objectives are:
To create hydrological respond unit (HRU) and water availability
To use SWAT and GIS for determining the impact of landuse change to water yield.
To use model simulation to find optimum landuse that ensures the availability of water.
1.4 Research Question
The study will address the following research question.
1. How the Upper Cimanuk Catchment Area is affected by different landuse condition.
2. Is there any landuse change in Upper Cimanuk Catchment Area? 3. Is SWAT model applicable for watershed management in Indonesia?
1.5 Scope of research
This research is focused to describe relationship between catchment conditions and water yield and sediment yield in the outlet of catchment. The catchment condition is presented by landcover changes due to human activities. The optimum landuse in the catchment is determined by simulation with several scenarios.
1.6Research output
II.
LITERATURE REVIEW
2.1 Hydrology Process
Hydrology deals with some aspects of water as resources. Specifically hydrology can be defined as a science that deals with space-time characteristics of quantity and quality of the water of the earth. The hydrology study is encompassing their process, movement, distribution, circulation, exploration, storage, development and management (Singh, 1992). Other definition of hydrology is a science that explains water distribution in liquid and gas form in earth surface. In applied hydrology the distribution is focused on quantity (Sumawiganda, 1992).
Hydrologic cycle is a giant nature machine, always constantly running distillation and pumping system every time. The Sun, supplying heat energy, together with the force of gravity keeps the water moving from the earth to atmosphere through evaporation and transpiration, and from the atmosphere to earth by condensation and precipitation. Water also moves in land surfaces as runoff and stream flow, while there are portion of it infiltrates into ground water stores and flow into the ocean. The scheme of hydrologic cycle is shown in Figure 1 (http://ga.water.usgs.gov/edu/watercycle.html).
Figure 2.1. Hydrologic cycle (USGS, 2010)
Catchment area and Watershed management
Catchment area is land area including river network and streams that have function to receive, collect and flow the water from rainfall to lake or ocean naturally. Its boundary is determined by topography and by water body that being influenced by land activities.
Hydrology model
A model is simplification of a system. It is impossible to develop a model that presents all processes in a system due to its complexity (Hartrisari, 2007). A system is a mechanic in which various components interact in such a way to perform a function (Handoko, 2005). A model is developed for several goals:
‐ Process comprehension in a system ‐ Prediction
‐ Decision support system.
A model is developed of at least two variables and one or more relationship between those variable. A variable is a quantity that may assume a succession of value such as annual precipitation. Model variable may be independent or dependent (Black, 1995).
Mathematical model is divided in to deterministic and stochastic. A deterministic model has no random component, while the stochastic model contains a random component. Deterministic model has two categories; distributed model and lumped model. The most generalformulation would involve partial differential equations in three space dimensions and time. If the spatial derivatives are ignored, the model is said to be ‘‘lumped’’, If the model truly distributed, all aspects of the model including parameters, initial, boundary condition, sources and sink most watershed hydrology models are deterministic, but some consist of one or more stochastic components. (Black,1995. Hadi, 2006 and Singh and Woolsiher, 2002).
In general description of hydrology model is a simple representation from a complex hydrology system (Harto, 1993). A system is a structure, tools, schematic, or procedure that can form real or un-real, and the system connected in a time reference, input or cause of, power or information with output effect or reaction in comprehensive system(Linsley et al, 1986).
physically base model (Pawitan, 2004). Whereas, Singh and Woolhiser (2002) stated that Hydrology model is an assemblage, a mathematical descriptions of components of hydrology cycle. Singh also classified hydrology model based on; process description, time scale, space scale, technique of solution, landuse, and model use.
The rainfall – runoff mathematical simulation is necessary to comprehend the interaction between the climatic, terrestrial, topographic and hydrological elements of a watershed. A number of mathematical models have been developed for the investigation of these physical processes (Bourletsikas et al, 2006). Additionally, many researchers proposed a variety of surface runoff models that usually interact with Geographic Information Systems (GIS) (DeVantier and Feldman 1993, Olivera and Maidment 1996, Jain et al. 1997 in Bourletsikas et al, 2006).
Hydrology model is capable to study the response of landuse change at hydrologic process. Mathematical understanding of equations and manners to presenting hydrology model behavior is used to give mathematical image relatively complex for hydrology cycle.
2.2 Landuse Change
Landuse is the human modification of natural environment or wilderness into built environment such as fields, pastures, and settlements. Deforestation and sub-urbanization are landuse changes process in Indonesia (Rustiadi, 1996 in Hamonangan, 2001 and Arsyad, 2006). Deforestation on large areas are mostly found in outer part of Java Island like Sumatera, Kalimantan, Sulawesi and Papua. Deforestation is a basic problem in Indonesia caused by environmental damage. Whereas, sub-urbanization is occurs in Java and Bali, where agriculture has been converted to non-agriculture like residential area and industry.
Landuse Optimization
Optimization is a mathematical method to find the best or optimal solution to given problems. It has been widely used for resources allocation/management and even for comprehensive planning (Yeo, 2005). Spatial optimization modeling should aim at finding a set of high-performing alternatives instead of just one solution (Bankes 1993, Church 1999, Harris 2001 in Zielinska, 2008).
Optimization model can be used to generate landuse planning alternative under planning goal, with significantly different considerations and conditions. The optimization is used as systematic process to allocate different landuse and activities to specific location to meet certain constraints and planning goals.
2.3 Sediment and Water Assessment Tools (SWAT) Model
SWAT (Sediment and Water Assessment Tools)
The SWAT (soil and water assessment tool) model, developed by the USDA Agricultural Research Service, simulates the land phase of the hydrologic cycle in daily time steps. Routines are also included for simulating the detachment of sediments from the watersheds and their transport through the drainage systems. The SWAT model is designed to route water and sediments from individual watersheds, through the river systems. It can incorporate the tanks and the reservoirs/check dam’s off-stream as well as on-stream. The agricultural areas can also be integrated with respect to its management practices. The major advantage of the model is that unlike the other conventional conceptual simulation models, it does not require much calibration and therefore can be used on un-gauged watersheds.
The model can be used for the assessment of existing and anticipated water uses and water shortages. The model provides a complete accounting of the quantity of water that is supplied to the land by precipitation; enters the streams as surface run-off; is used and returned to the atmosphere by natural vegetation, agricultural crops and evaporation, and that percolates through the root zone and a part returns as groundwater contribution.
(Neitsch, S.L., 2005)
Where : SWt : final soil water content (mm H2O)
SWo : initial soil water content on day i (mm H2O)
t : time (days)
Rday : amount of precipitation on day i (mm H2O)
Qsurf : amount of surface runoff on day i (mm H2O)
Ea : amount of the evapotranspiration on day i (mm H2O)
Wseep : amount of water entering the vadose zone from the soil profile on day i (mm H2O)
Surface runoff resulted from the rate of precipitation exceeding the rate of infiltration. SWAT offers two methods for estimating surface run off; the SCS curve number procedure and the Green and Ampt infiltration methods. SWAT simulates surface runoff volumes and peak runoff rate for each HRUs (Hydrology Response Units). The SCS curve number equation is:
. .8
Where : Rday : Rainfall depth per day (mm)
S : retention parameter (mm)
The retention parameter is defined by: .
curve number is the lowest value and hence can be assumed in dry conditions. The curve number of average and wet moisture condition are calculated by the equation as follow:
.
exp . . .
CN3 = CN2 . exp [0.00673 . (100 - CN2)]
Typical curve number for average moisture condition is listed in various tables (Neitsch et al, 2005). The values are prepared for 5% slope. Williams (1995) developed an equation to adjust the curve number to a different slope:
. . exp .8 .
Where : CN2S : the average moisture curve number adjusted for slope slp : average of slope in sub-catchment
Permeability is defined as the capacity of the soil to transmit water and air through the most restricted horizon (layer) when moist. The profile of permeability classes are based on the lowest saturated hydraulic conductivity, the code assigned to Cperm is:
1. Rapid (>150 mm/hour)
2. Moderate to rapid (50 – 150 mm/hour) 3. Moderate rapid (15 – 50 mm/hour) 4. Slow to Moderate (5 – 15 mm/hour) 5. Slow (1 – 5 mm/hour)
6. Very slow (<1 mm/hour).
Model Limitations
Another limitation is the accuracy of Hydrologic Response Units (HRUs) simulating field variations including conservation practices. SWAT is being altered to account for landscape spatial positioning so that conservation practices such as riparian buffers and vegetative filter strips can be adequately simulated.
Data files can be difficult to manipulate and can contain several missing records. The model simulations can only be as accurate as the input data. SWAT does not simulate detailed event-based flood.
2.4 SWAT Mapwindows® Plugg-in
SWAT MapWindows (MWSWAT) is a graphical user interface, written in FORTRAN language (www.waterbase.org). The MVSWAT consists of three key components:
(1) a pre-processor to generate the sub-basin topographic parameters and model input parameters;
(2) a facility for editing input data and to execute the SWAT simulation; (3) a post-processor to view the graphical and tabular simulation results.
MWSWAT1.5 contains databases for soils, crops, pesticides, fertilizers, tillage operations and urban simulations. All the existing databases are specifically related to the United States, but the user can easily add information to the databases according to requirements.
The MWSWAT requires
1. Personal computer using a Pentium I processor or higher, which runs at 166 MHz or faster
2. 64 Mb RAM minimum, higher is better.
3. Microsoft Windows 95, 98, NT 4.0 or Win2000 operating system with most recent kernel patch, SWAT also can run in Windows XP.
4. VGA graphics adapter and monitor.
5. 50 Mb free memories on the hard drive for minimal installation and up to 300 Mb for a full installation.
6. Mapwindows 4.6 (open sources GIS software) 7. Dialog Developer 3.1 or later (GIS software)
SWAT/Arc View interface, and project generated maps and tables (Neitsch et al., 2005).
MapWindow is an open source "Programmable Geographic Information System" that supports manipulation, analysis, and viewing of geospatial data and associated attribute data in several standard GIS data formats. MapWindow is a mapping tool, a GIS modeling system and a GIS application programming interface (API) all in one convenient redistributable open source solution (Usman et al, 2008 and Gatry et al, 2007).
The MapWindow application is a free, extensible geographic information system (GIS) that can be used in many ways:
• As an open-source alternative desktop GIS • To distribute data to others
• To develop and distribute custom spatial data analysis tools
2.5 Calibration and Validation
Calibration is testing of the model with known input and output used to adjust or estimate factor. The model calibration procedure can be either manual or auto-calibration; the manual calibration depends to knowledge, experience and patience. Validation is a comparison between simulation and the observed data on time step with the use of several indexes, and mainly in Nash and Sutcliffe coefficient. The Nash and Sutcliffe coefficient is an estimate of the variation of a time series from another, provided by equation;
∑ , ,
∑ , ,
Where; Q sim = Simulation time series
QObs = Observe time series
Qsim = the numerical mean for simulation time series
2.6 GIS and Remote Sensing in Hydrology model
Remote sensing and Geographic Information Systems (GIS) are providing new tools for advanced ecosystem management. The collection of remotely sensed data facilitates the synoptic analyses of earth-system function, patterning, and change at local, regional, and global scales over time. Such data also provide a vital link between intensive, localized ecological research and the regional, national, and international conservation and management of biological diversity (Mansouri and Mazouz, 2007).
GIS is a special type of information system in which the data source is a database of spatially distributed features and procedures to collect, store, retrieve, analyze, and display geographic data. In other words, a key element of the information used by utilities is its location relative to other geographic features and objects (Shami, 2002 in Weizhe, 2007).
Digital Elevation Model (DEM) and Grid format
SWAT model need DEM data as input for delineating the catchment boundary, sub-catchment and stream network. DEM is digital representation of ground surface and also known as a digital terrain model (DTM). DEM can be visualized as a raster (squared grid) or a Triangular Irregular Network (TIN). DEM are commonly developed using remote sensing technique or land surveying.
III.
METHODOLOGY
3.1 Time and Location
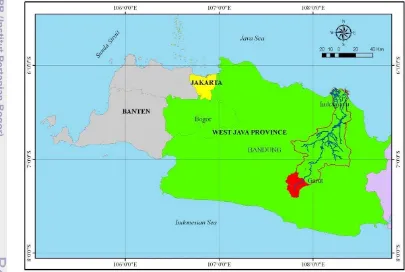
The study covers the period of March to July 2009, but collection of data has been done since 2006. The study area is located in Upper Cimanuk Catchment Area. Located at 107o 42’ 21” E – 107o 58’ 32” E and 7o 7’ 4” S – 7o 24’ 45” S, it has on area about 448.6 km2. Administratively the study area belongs to Garut Regency and approximately 6 hours away from Jakarta. Based on Statistical Bureau data the population of Garut regency consists of 2.196 million people in 2005. The location of study is shown in Figure 3.1.
Figure 3.1. Study area (Upper Cimanuk Catchment Area).
3.2 Required Tools
This research used field and laboratory equipments. The field calibrated equipments are follows:
‐ Global position system (GPS) Garmin-GPSMap78CS ‐ Ring soil sample.
‐ Bottle sampler ‐ Digital camera
Laboratory Equipment
‐ Personal computer with following software: a. Microsoft office 2007
b. ERMApper 6.0 c. Mapwindows 4.6
‐ Plug in MWSWAT 1.5
d. ArcView version 3.3 with extension: ‐ SpatialAnalyst 2.0
‐ 3DAnalyst e. SWATEditor2005 f. SWATPLOT 1.1 g. SWATGRAPH 1.1
ERMapper 6.0 is used for image processing and ArcView 3.3 is used for spatial analysis; the application are not open sources application until for used who did not have license can change with other open sources application like as; ILWIS, GRASS, Quantum, gvSIG, etc.
3.3 Framework of Data collecting
Climatic data and GIS Data
There are several digital data being used in hydrological. These data are: ‐ Soil map; derived from semi-detailed soil map, scale 1: 250.000, Puslitanak ‐ Stream network and topography map; derived from RBI (Rupa Bumi Indonesia),
scale 1 : 25.000, Bakosurtanal
‐ Climate gauge point map and rainfall data; Derived from daily rainfall, BMG and Research Centre for Water Resources, Ministry of Public Work.
Attribute data used for SWAT simulation are: ‐ Climatic series data
‐ Rainfall data
‐ Water discharge data series ‐ Soil characteristic
3.4 Methodology
The methodology of this study is limited to the condition of the data and SWAT model application. The integration of Geographic Information System (GIS), remote sensing and SWAT model was divided into three major steps, as follows; ‐ SWAT model
‐ Calibration and Validation ‐ Landuse Change analysis
‐ Impact of Landuse change to water yield ‐ Landuse Optimizing.
Figure 3.2 shows the flow chart of methodology. The study started by data preparation where coordinates of all spatial data is appropriate to WGS84 coordinate system, then landuse data series are definite to SWAT model landuse database and developed soil database, landuse series data is also prepared for crosstab process to detect landuse change. Next step of study is Simulated MWSWAT model, then calibrating the output of SWAT simulation. After the validation is enough the study is continued by analysis of landuse change using cross table of landuse series data and then each landuse data is simulated by SWAT model.
3.5 Field survey
The field survey is conducted to observe water discharge, sediment load and soil characteristics in the same location. Measurement and sampling required in this research are:
‐ River profile
‐ Water velocity in several stream segment
‐ Soil sampling to determine characteristic of soil type.
The measurement of river profile is done in several locations based on morphological factor and existence of gauge. This location will be used for validation of SWAT simulation result. Profile measurement employs terrestrial mapping using digital theodolite. Measurement is done by crossing the river, where every one meter measures distance and height. The water discharge is obtained by measuring water velocity by current meter.
One of SWAT input model are soil characteristics, hence each soil type will be sampled. The location for soil sampling is selected based on soil map and the location is recorded by GPS and plotted by GIS. Each type of soil is sampled by ring soil sample (Ø 2.5”) and 0.5 kg soil. Parameters of soil characteristics to be analyzed are:
‐ Structure and Texture ‐ Organic content ‐ Permeability ‐ Bulk density
‐ Available water content ‐ Porosity.
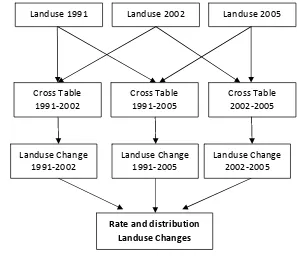
3.6 Landuse Change Detection
Figure 3.3 Flow diagrams for landuse change analysis
3.7 MWSWAT
Within the process of setting up the model run/input files with MWSWAT a series of operations are required. The first step is generating the catchment and sub-basin boundaries using the DEM. After that we define HRU’s and locate the weather files. Figure 3.4 shows schematic framework of MWSWAT System.
MWSWAT operates by taking a Digital Elevation Model (DEM) as an input and delineating the catchment boundary and stream networks based on a threshold number of cells draining to a particular point. Sub-basins are derived automatically based on the stream networks. The user can remove or include additional sub-basins by adding outlets at appropriate locations or junctions of the stream, depending on requirements.
Landuse 1991 Landuse 2002 Landuse 2005
Cross Table
1991‐2002 Cross Table1991‐2005 Cross Table2002‐2005
Landuse Change 1991‐2002
Landuse Change 1991‐2005
Landuse Change 2002‐2005
Figure 3.4Schematic framework of MWSWAT system (Revised from Diluzio and Arnold, 2004).
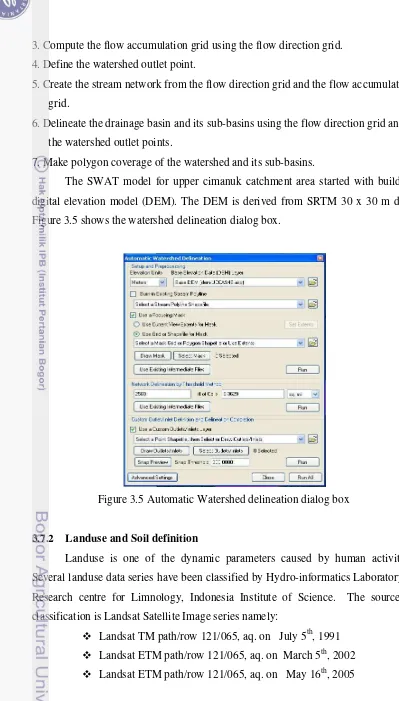
3.7.1 Automatic Watershed Delineation (AWD)
Watershed delineation is used for segmenting watershed into several hydrological connected sub-watersheds (Neitsch et al, 2005). Preparing DEM data is done before defining catchment area boundaries. The unit for this data was set using properties of MapWindows facilities. The unit used is in meters with the same resolution as DEM sources (SRTM 30m), and the cell area is 900 m2. The projection was set to UTM on zone 48 with the datum is WGS84.
The first step in hydrologic data development is defining catchment area boundaries. These boundaries normally fall along the ridges in a watershed. On one side of the ridge, water flows into the watershed, while on the other side of the ridge, water flows into a separate watershed. Seven steps are involved in defining these drainage basin boundaries from an elevation grid:
1. Fill any pits in the elevation grid.
2. Compute the flow direction grid using the elevation grid.
MWSWAT
3. Compute the flow accumulation grid using the flow direction grid. 4. Define the watershed outlet point.
5. Create the stream network from the flow direction grid and the flow accumulation grid.
6. Delineate the drainage basin and its sub-basins using the flow direction grid and the watershed outlet points.
7. Make polygon coverage of the watershed and its sub-basins.
The SWAT model for upper cimanuk catchment area started with building digital elevation model (DEM). The DEM is derived from SRTM 30 x 30 m data. Figure 3.5 shows the watershed delineation dialog box.
Figure 3.5 Automatic Watershed delineation dialog box
3.7.2 Landuse and Soil definition
Landuse is one of the dynamic parameters caused by human activities. Several landuse data series have been classified by Hydro-informatics Laboratory in Research centre for Limnology, Indonesia Institute of Science. The source of classification is Landsat Satellite Image series namely:
Figure 3.6 Landuse data series (1991-2002-2005)
The classification result has been compared with field data and the accuracy of classification is about 82.7% (Daruati, 2008). Figure 3.6 shows Landuse data series as result of classification and Figure 3.7 shows composition of landuse series data.
Figure 3.7 Composition of landuse class
Soil Property and Hydrology Soil Groups (HSG)
Soil type of study area is derived from research center for soil (Puslitanak, 1990) and the distribution of soil type is shown in figure 9. There are six soil types. The dominant soil type is brown andosols and regosols association that can be found in Mount Papandayan and lower part of Mount Cikuray. The secondly dominant soil type is brown latosol that can be found between Mount Papandayan and Mount Cikuray or covering main stream of Upper Cimanuk River.
1991 2002 2005
0.0 2000.0 4000.0 6000.0 8000.0 10000.0 12000.0 14000.0
Area
(ha)
Table 3.1 Hydrograph Soil Groups and Infiltration range (Asdak, 2002 and
A Sandy, deep, well drained soils; deep losses; aggregated silt soil 8 - 12 B Sandy loams, shallow loess, moderately deep and moderately well drained soils 4 - 8
C
Clay loam soils, shallow sandy loams with a low permeability horizon impeding drainage (soils with a
high clay content), soils low in organic content . 1 - 4
D
Heavy clay soils with swelling potential (heavy plastic clay) water-logged soils, certain saline soils, or shallow
soils over an impermeable layer 0 - 1
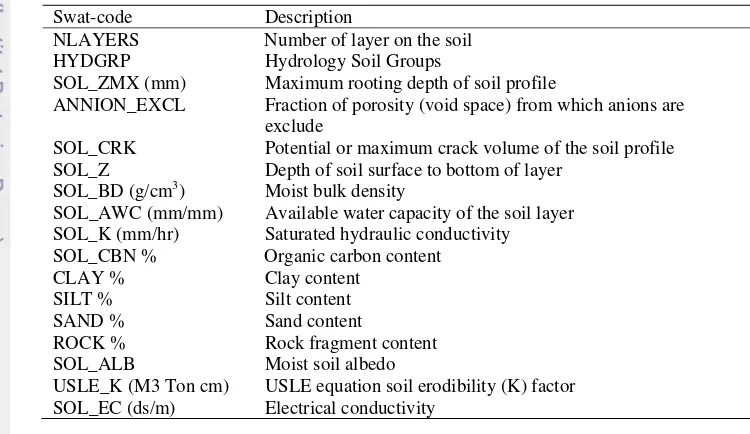
Table 3.2. Soil property input for SWAT model (Neitsch. et al, 2005)
Swat-code Description NLAYERS Number of layer on the soil HYDGRP Hydrology Soil Groups
SOL_ZMX (mm) Maximum rooting depth of soil profile
ANNION_EXCL Fraction of porosity (void space) from which anions are exclude
SOL_CRK Potential or maximum crack volume of the soil profile SOL_Z Depth of soil surface to bottom of layer
SOL_BD (g/cm3) Moist bulk density
SOL_AWC (mm/mm) Available water capacity of the soil layer SOL_K (mm/hr) Saturated hydraulic conductivity SOL_CBN % Organic carbon content
CLAY % Clay content SILT % Silt content SAND % Sand content
ROCK % Rock fragment content SOL_ALB Moist soil albedo
USLE_K (M3 Ton cm) USLE equation soil erodibility (K) factor SOL_EC (ds/m) Electrical conductivity
The establishment of the Hydrological Soil Groups (HSG) is based on the analysis of texture, infiltration and retention capacity of each pedological entity. The different land use types have consequences in the majority of the surface hydrologic processes such as interception of the precipitated water quantity, Table 3.1 shows the hydrology soil group and infiltration range.
Runoff Curve Number
The Curve number is derived from spatial analysis whereas soil map is converted to Hydrology Soil Group and overlaid with land cover for each data series. The runoff curve number (CN) is an empirical parameter used in hydrology for predicting direct runoff or infiltration from rainfall excess. The curve number method was developed by the USDA Natural Resources Conservation Service, which was formerly called the Soil Conservation Service or SCS. The runoff curve number was developed from an empirical analysis of runoff from small catchments and hillslope plots monitored by the USDA. It is widely used and efficient method for determining the approximate amount of direct runoff from a rainfall event in a particular area. The runoff curve number is based on the area's hydrologic soil group, land use, treatment and hydrologic condition.
3.7.3HRUs Distribution
After stream and sub-catchment delineated, the next step is creation of Hydrological Response Units (HRUs). An HRU is an intersection of sub-catchment polygon with landuse, soil type and slope polygon. There are two options for HRUs; only one HRUs in each sub catchment, and more than one HRU in each sub-catchment. HRUs has a unique combination between landuse, soil characteristics and slope. In this research a second option is used for Upper Cimanuk Catchment area. Figure 3.8 shows the dialogs box for developing HRUs.
3.7.4 Weather data
SWAT database used weather station and location and stored in wgnstation.dbf. The Upper Cimanuk Catchment Area used one weather station and three locations for rain gauge. The weather station belongs to Plantation Company, while Rain Gauge belongs to Geophysics Agency (BMG) and The Public Work Ministry (PU). Figure 3.9 shows the setting tools for weather data.
The sensitivities of weather generator inputs were limited to precipitation because this is by far the most determining weather factor of the water balance (McKay, 1988 in Heuvelmans et al, 2005). Tested precipitation parameters were rainfall pattern, intensity and quantity. To generate rainfall pattern, the SWAT has two options as follows;
‐ Describe the temporal rainfall pattern with the probability of wet day after a dry day and after a wet day was chosen as a reference.
‐ When these probabilities are unknown, the second option is available that uses the number of wet days in a month.
Figure 3.9 Weather data dialog box
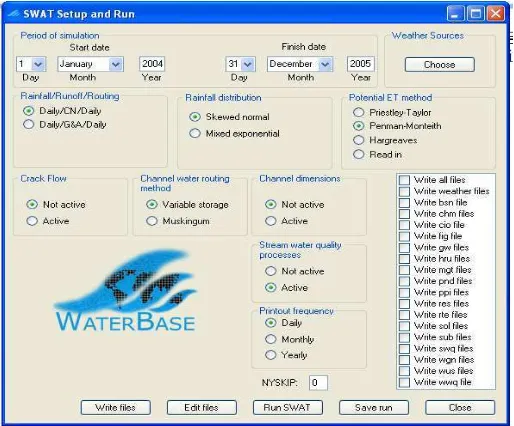
3.7.5 Run SWAT
Figure 3.10 Dialog box for running The SWAT model
3.7.6 Calibration
SWAT model uses more than 500 parameters for simulation, but not all of them are used to develop a model for Upper Cimanuk Catchment Area, due to limited time and data support. The selection of those parameters is continued during calibration, especially in manual calibration process.
Figure 3.11 Flow chart of Calibration procedure Yes
Separated water discharge
Statistical evaluation RUN SWAT
Adjust sensitive parameter
Calibration complete
No NSE and
Manual calibration focuses on the detailed representation of landuse data; it means more precise simulation on hydrology cycle, and in using sensitivity of landuse model. The procedure for calibration is shown in flow chart diagram of Figure 3.11, where result of SWAT simulation has to separate water discharge from reach system, then statistical evaluation will show appraise the simulation is good enough or not, if the validation of simulation is not precise, the calibration is frequented by adjusting sensitive parameters.
Calibration is focused on surface, the procedure for calibration uses basic water balance and total flow calibration on SWAT user manual (Neitsch et al, 2002). The procedure started by adjust Curve Number (CN2 in .mgt file) until surface runoff is acceptable. If surface run off value is not acceptable the calibration is continued by adjusting soil available water capacity (SOL_AWC in .sol) and soil evaporation compensation (ESCO in .bsn or .hru). Once surface calibration is conducted it should be compared with the observed and simulation value of base flow resulting two condition; too high base flow or too low. Figure 3.12 shows sensitive parameters to water discharge for calibration.
Figure 3.12 Sensitive parameters to water discharge for Calibration (Heuvelmans et al, 2004).
the SWAT parameters Geodatabase and properly formatted SWAT project database. The SWAT Editor provides the following capabilities;
‐ Editing of SWAT database
‐ Editing of SWAT model parameters
‐ Editing model point source, inlet and reservoir ‐ SWAT model setup
‐ Calibration and sensitivity analysis (Winchell and Srinivasan, 2007).
The dialog box of this SWAT Editor and manual calibration application is shown in figure 3.13.
Figure 3.13 Dialog box of manual calibration by SWAT Editor 2005.
3.7.7 Impact of Landuse change and Landuse Optimization.
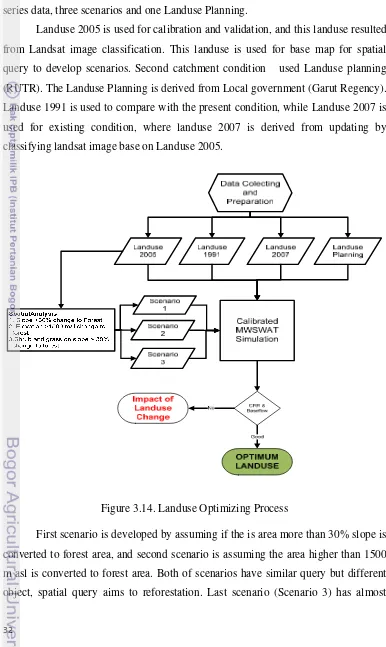
The SWAT model is simulated based on land use of 2005. The simulation also used rainfall and temperature of the same year. The selection of landuse time considers the availability of complete discharge data used for calibration. After the model already calibrated and the value of validation is good enough then the model simulated for 1991, 2007 and several scenarios. The Simulation in different landuse time series is objected to determine the impact of landuse change to water yield.
are two hydrology criteria, they are; discharge and base flow and to find optimum landuse seven landuse are compared. The landuse condition consists of three landuse series data, three scenarios and one Landuse Planning.
Landuse 2005 is used for calibration and validation, and this landuse resulted from Landsat image classification. This landuse is used for base map for spatial query to develop scenarios. Second catchment condition used Landuse planning (RUTR). The Landuse Planning is derived from Local government (Garut Regency). Landuse 1991 is used to compare with the present condition, while Landuse 2007 is used for existing condition, where landuse 2007 is derived from updating by classifying landsat image base on Landuse 2005.
Figure 3.14. Landuse Optimizing Process
similar goal with scenario 1 but the reforestation is limited only on shrub and grass land. Figure 3.13 shows the optimizing process. Optimizing is done by analyzing several criteria such as; base flow, and discharge.
The discharge criteria uses coefficient of river regime (CRR). The CRR is ration between maximum and minimum discharge. Base on Director General of Land Rehabilitation and Social Forestry, about monitoring and watershed evaluation, No. P.04/V.Set/2009, CRR is divided in three categories:
‐ CCR < 50 is Good
‐ CCR = 50 – 150 is moderate ‐ CCR > 150 is bad.
Table 3.3 shows seven conditions for optimizing landuse in Upper Cimanuk Catchment Area
Tabel 3.3 Catchment condition for optimizing landuse
No. Spatial process action
1 Landuse 2005 Discharge Calibration and validation
2 Landuse 1991 Past condition
3 Landuse 2007 Existing condition 4 Landuse Planning Urban planning 5 Slope >30% change to be forest area
(Scenario1)
reforestation
6 Elevation >1500 m msl change to be forest area (Scenario 2)
reforestation
7 Shrub and grass in Slope >30% change to forest area (Scenario 3)
IV.
RESULT AND DISCUSSION
4.1 Characteristic of Study Area
The characteristics of a catchment area will influence the transformation of rainfall into discharge in hydrologic system. It explains the importance of research on characteristic of upper Cimanuk catchment area.
4.1.1 Physiographic and Geology setting
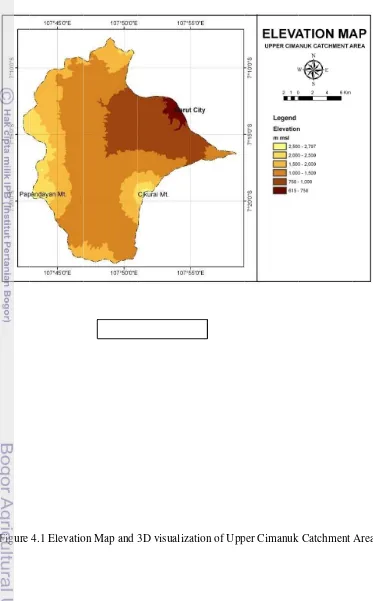
Physiographic of the catchment area is within the Bandung zone that has volcanic quarter (Bemmelen, 1949). The catchment is surrounded by mountains, in the west is bounded by Papandayan Mountain (+2,573 asl) and GunungKareta Mountain (+2608 asl), while its eastern boundary is Cikuray Mountain (+2,820 asl). The flow pattern is mostly radial in mountain region. The pattern of the middle part of the catchment, where most part of the main river flows, is rectangular which is characterized by tectonic activity. Figure 4.1 shows distribution of elevation and 3 dimensional visualization of the catchment area. Elevation of catchment area is derived from SRTM (The Shuttle Radar Topography Mission) image with 30 x 30 m resolution.
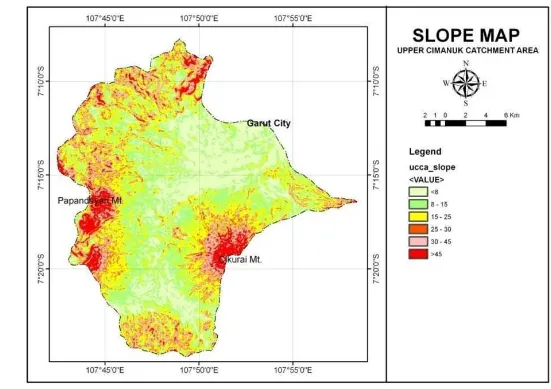
Slope and length of slope are two factors that determine the topography of catchment area. Those factors are important for surface runoff because they determine velocity and volume of runoff (Asdak, 2002). Figure 4.2 shows slope distribution in UCCA. The Slope of the bounding mountains is generally very steep on the top and getting slighter on lower flank of mountain. Smoother slopes can be found in the middle of study area, where main river of Cimanuk flows. Type of drainage pattern of study area is dominated by dendrithic type.
Figure
4.1 Elevatioon Map and 3D VIS
3D visualiza Ciku SUALIZATION
ation of Upp uray Mt.
per Cimanuk Papand
Kareta Mt
k Catchment dayan Mt.
t.
4.1.2 Soil Characteristics
Generally, soil type in the study area was developed from volcanic material resulting from volcanic eruption. There are four soil characteristics that determine erodibility level; texture, organic content, structure and permeability. The values of the characterizing parameters were determined from samplings in undisturbed and disturbed area. Aside from that, the slope of the area was also measured. Figure 4.4 shows soil sampling and slope measurement. The site of soil sampling was determined based on soil type map and elevation. The distribution of soil type and location of soil sampling is shown in figure 4.5.
Figure 4.4 Measurement and soil sampling
4.1.3 Climatology condition
Climatologic condition was derived from averaged monthly data from 2004 to 2008 on Nariwatie climate gauge. The gauge is located in the eastern of study area and belongs to a plantation Company. This gauge recorded climatic parameters, such as temperature, rainfall, solar radiation, humidity, and wind velocity. Table 4.1 shows monthly averaged data of climate condition in study area.
Based on daily climate data during 2004 - 2008, air temperature in Upper Cimanuk Catchment Area ranged from 14.40C to 33.8oC, humidity ranged from 83.2% to 90.2%, wind velocity ranged from 1.2 to 7.5 m/second, while Solar radiation ranged from 12.49 to 50.4 mjm-2/day.
Table 4.1 Average climate during 2004 to 2008 in Upper Cimanuk Catchment Area
Rainfall
There are 13 rain gauges found around the study area. The gauges are mostly located at downstream area and belong to The Public Works Department. The rainfall data is also mostly discontinuous as shown in Table 4.2. Several gauges have continuous data such as Bayongbong (1990-2007), Chinchona and Paseh (1990-2004), Leles (1998-2008), and Tarogong (1997-2006). Figure 4.6 shows distribution of rain gauge location in study area. Considering the availability of precipitation and landuse data, the simulation was done using the data from year 2005.
Table 4.2 Availability of precipitation data in UCCA.
No Gauge 90 91 92 93 94 95 96 97 98 99 00 01 02 03 04 05 06 07 08 Qty
season occurs from October to April, whereas according to the research of Gandasasmita in 2001 the rainy season occurred from November to April. This difference is caused by different outlets of catchment area.
Figure 4.6 Distribution of Rain gauge, climate and discharge gauge
Figure 4.7 Average daily precipitations each month in Upper Cimanuk Catchment Area.
0.00 5.00 10.00 15.00 20.00
Jan Feb Mar Apr May Jun Jul Aug Sep Oct Nov Dec
P
(mm
)
Figure 4.8 shows monthly precipitation in Bayongbong rainfall gauge where total of rainfall in year 2005 is 2,106 mm this number will compared with result of SWAT simulation. Figure 4.9 shows daily precipitation in Bayongbong rainfall gauge, the figure present stability of rainfall data during 1990 to 2006.
Figure 4.8 Monthly precipitations in Bayongbong Rain Gauge
Figure 4.9 Daily precipitations in Bayongbong Rain Gauge. 0.0
50.0 100.0 150.0 200.0 250.0 300.0 350.0 400.0 450.0
P
(mm)
0 20 40 60 80 100 120 140
P
4.1.4 Hydrologic condition
Upper Cimanuk Catchment Area, one of the upstream areas of Cimanuk watershed has length of 50 km length of main river. There are two discharge gauges in this area; Bayongbong gauge which is located in the middle of the catchment and Leuwidaun gauge which is located in downstream from Bayongbong gauge. Leuwidaun river gauge is used as outlet of catchment in SWAT simulation.
Figure 4.10 Watershed boundary of UCCA
Catchment area is derived from SRTM 30 m data by watershed delineation process. Afterward the delineation is supported by stream network which was derived from Peta Rupa Bumi scale 1:25,000 published by Bakosurtanal. Result of watershed delineation process is shown in Figure 4.10.
River Discharge
velocity and river profile used theodolite instrument. The availability of discharge data is shown in Table 4.3. According to the table, Leuwidaun river gauge has better availabile data compared to other river gauges whereas the discharge data were collected since 1970.
Table 4.3 Availability of discharge data in UCCA
No Gauge 90 ‐ 04 05 06 07 08 Qty
Figure 4.11 Monthly average discharge in Leuwidaun river gauge (1990 – 2006).
Figure 4.11 shows average of monthly discharge data series in Leuwidaun gauge. Average discharge data shows the maximum and the minimum discharge which occurred in December (40.4 m3/sec) and September (6.3 m3/sec), respectively.
Figure 4.12 shows daily discharge in Leuwidaun river gauge in 1971-1983 and 1993-1996, respectively. During 1971-1983 the discharge data did not show any increment, but it occurred in 1993-1996. The condition of discharge data also is shown in Figure 4.13 where maximum and minimum data are more diverged since 1999. The figure also presents coefficient of river regime during 1999 – 2005 which has large number.
0
Jan Feb Mar Apr May Jun Jul Aug Sep Oct Nov Dec
Q
(cm
46
100 150 200 250 300
4.2 Landuse Change Analyses 4.2.1 Rate of Change
Multi-date Landsat Image (1991, 2002 and 2005) were classified. The areas of each landcover class were calculated. The percentage of landuse change during 1991 – 2005 is shown in Table 4.4. During 1991 – 2005 some areas were decreasing, such as forest, plantation, paddy and brush. The increasing percentage was for settlement and agriculture areas.
During 1991 – 2002, most landcover changed to settlement area. The area for settlement increased 27.2% or 541 ha and the changes continued during 2002 – 2005 which became 19.3% or 605 ha. The total changes settlement area during 1991-2005 is increase about 57.5% or 1147.1 ha. Whereas the condition of forest was different, during 1991- 2002 forest area decreased to 18.6% or 1,832.8 ha, and the next period (2002-2005) the forest area increased about 3.2% or 2661 ha. The deforestation is appropriate to BKSDA report in Zuhri and Sulistiawaty (2007), where deforestation in Papandayan Mountain reserve reached about 340.8 ha during 1996-2003 caused by illegal logging. The increase of forest area during 2002-2005 is caused by re-forestation by the Ministry of Forest. With the result that total changes of forest area during 1991 – 2005 decreased about 15.9% or 1,566.7 ha.
Table 4.4 Percentage of variation of landuse change in Upper Cimanuk Catchment Area
Forest 9866.5 8033.7 8299.8 ‐18.6 3.2 ‐15.4
Plantation 10457.3 10632.1 10220.4 1.7 ‐4.0 ‐2.3
Agriculture 11990.2 13253.9 13197.5 10.5 ‐0.4 10.1
Settlement 1994.3 2536.2 3141.5 27.2 19.3 57.5
Paddy field 9304.0 9029.6 8799.1 ‐2.9 ‐2.6 ‐5.4
Brush 1250.5 1227.6 1223.0 ‐1.8 ‐0.4 ‐2.2
Bare land 32.4 171.2 0.0 429.1 ‐100.0 ‐100.0
The table also shows the increase of agriculture areas, in 1991 – 2002 agriculture area increased to 10.5% or 1263.7 ha but during 2002 – 2005 agriculture area decreased to 0.4% in total agriculture areas during 1991 – 2005 increased to 10.1% or 1207.3 ha. The higher changes of landuse is to became bare land, during 1991-2002 this landuse increased to 429.1% or 138.8 ha, but during 2002-2005 bare land areas changed to other landuse class.
4.2.1 Distribution of Landuse Change
Each pixel for the first year was compared to the same pixel location in the second year and similarly second year to the third year. Changes of landuse area during the first period of 1991-2002 are shown in Table 4.5. The largest landuse change during 1991-2002 was conversion from forest to plantation for about 1,338.9 ha. Forest area was also reduced to 2,112 Ha due to its conversion into plantation, agriculture, and bare land. Cross table also shows that about 571 ha area was converted into settlement areas; this number was resulted from the change from plantation, agriculture, paddy field, brush and bare land areas. The distribution of landuse change during 1991 to 2002 is shown in Figure 4.14. The largest converted areas were located in western area and eastern part, whereas in lowland area it was converted to residential area.
Table 4.5 Result of cross tabulation (1991 – 2002).
Figure 4.14 Distribution of landuse change during 1991 – 2002
During the second period (2002 – 2005) about 141.6 ha forest was converted to plantation and 8.0 ha to agriculture. Additional to that, about 404.4 ha of plantation and 9.7 ha of agriculture area were reforested. Table 4.6 shows the distribution of changes, while figure 4.15 shows location of landuse change of 2002 – 2005. The table shows that many landuse classes have been converted into urban areas. Landuse change reached 711 ha and this value is higher compare to the first period which has longer duration.
area; these numbers was resulted from plantation, Agriculture, Paddy, and brush. The increasing of settlement area or urbanization drives the change of landuse pattern, which may also have adverse impact on ecological of area, especially hydro-geomorphology and vegetation (Long et al, 2008). The distribution landuse change during 1991 – 2005 periods is shown in Figure 4.16.
Table 4.6 Result of cross tabulation (2002 – 2005).
2002/2005 Forest Plantation Agriculture Settlement Paddy Brush Bare
Table 4.7 Result of cross tabulation (1991 – 2005)
Figure 4.15. The distribution of landuse change during 2002 – 2005
4.3 SWAT Model 4.3.1 Model Setup
4.3.1.1 Automatic Watershed Delineation
First step in model setup in MWSWAT is Watershed delineation. The process uses Automatic Watershed Delineation (AWD) in MWSWAT Plug-ins. The process need mask area of study and output location. The mask area is developed by bordering the study area by square map and then determining the number of cells for network delineation by threshold method or inputting the area. The threshold area of UCCA is 8 km2 which is equal to 949 grid cells. The last input for developing sub-catchment on automatic watershed delineation was determining output location. The location can use a point map where the river gauge (Leuwidaun) is located. Result of this process divided UCCA in 35 sub-catchments. Figure 4.17 shows result of the automatic watershed delineation by MWSWAT.
4.3.1.2 Landuse and Soil Definition
The simulation used Landuse 2005, whereas the landuse classes were adjusted to crop type in SWAT database. The settlement area used urban SWAT database, whereas low residential density was used to define residential area in upper cimanuk catchment area. Table 4.8 shows landuse definition for SWAT model.
Soil characteristics were obtained from soil map characteristic and sampling of soil. Soil characteristics database was also obtained from Final report of Land Suitability by Research Centre for Soil and Agro-climate (Puslitanak) in 1990. This report is used to support the development of soil database.
Table 4.8 Landuse definition for SWAT model
No Landuse SWAT Database CODE ID_Landuse
1 Forest Mixed Forest FRST 24
2 Plantation Orchad ORCD 28
3 Agriculture Agriculture AGRC 29
4 Settlement Low density
residential density URLD 1
5 Paddy field Paddy RICE 27
6 Scrubland Scrubland SHRB 7
7 Bareland Grass GRSH 8
8 Water Body Water body WATB 16
4.3.1.3 HRUs Distribution
HRUs is an intersection of sub-catchment polygon with landuse, soil and slope. There were 182 HRUs built in this process based on landuse 2005. For Upper Cimanuk Catchment Area HRUs it was developed by multiple HRU.
4.3.1.4 Weather Data