THE JOURNAL
zyxwvutsrqponmlkjihgfedcbaZYXWVUTSRQPONMLKJIHGFEDCBA
OF BIOLOGICAL CHEMISTRYzyxwvutsrqponmlkjihgfedcbaZYXWVUTSRQPONMLKJIHGFEDCBA
Printed in U. S.
zyxwvutsrqponmlkjihgfedcbaZYXWVUTSRQPONMLKJIHGFEDCBA
A.zyxwvutsrqponmlkjihgfedcbaZYXWVUTSRQPONMLKJIHGFEDCBA
Vol. 257, No. 8,
zyxwvutsrqponmlkjihgfedcbaZYXWVUTSRQPONMLKJIHGFEDCBA
Issue ofzyxwvutsrqponmlkjihgfedcbaZYXWVUTSRQPONMLKJIHGFEDCBA
April 25, pp. 443-4437, 1982The Asymmetric Distribution of Charges on the Surface
of
Horse
Cytochrome
c
FUNCTIONAL IMPLICATIONS*
(Received for publication, October 8, 1981, and in revised form, November 17,1981)
Willem H. Koppenol$ and E. Margoliashg
From the Department
zyxwvutsrqponmlkjihgfedcbaZYXWVUTSRQPONMLKJIHGFEDCBA
of Biochemistry and Molecular Biology, Northwestern Uniuersity, Evanston, Illinois 60201The electric potential field around native horse cy- tochrome c and 12 singly modified 4-carboxy-2,4-dini- trophenyl- (CDNP) lysine cytochromes c is asymmetric, mainly because of the inhomogeneous distribution of negative charges. Dipole moments of 325 and 308 debye,
(1.08 lo-'' and 1.03
lo-''
coulomb -meter), respec- tively, were calculated for horse ferri- and ferrocyto- chrome c. The angle between the heme plane and the dipole vector of horse ferricytochrome c is 33" and increases 1" upon reduction to the ferrous form. Dipole moments of the CDNP-lysine cytochromes c differ from that of native cytochrome c by as much as 140 debye in magnitude and 45" in direction. It is proposed that its dipole moment causes cytochrome c to orient itself in the electric fields of its redox partners, and that the CDNP-lysine cytochromes C, which have different di- pole moments, do not form a productive complex. Reo-rientation to the correct position for electron transfer increases the activation energy and lowers the rate of reaction. This model describes quantitatively the rela- tive activities of those CDNP-lysine cytochromes c
which are modified outside of the interaction domain and it allows correction of the activities of those mod- ified inside the domain, on the front surface of the molecule, for the change in dipole moment. The inter- action domain for the reaction with cytochrome c re- ductase includes in decreasing order of involvement lysines 13,72,86,27, and 87. That for the reaction with cytochrome c oxidase is slightly smaller, with lysines
13,12,86, and 27. The cytochrome c peroxidase domain is the largest of all and is defined by lysines 72, 86, 13,
87, 27, and 73. All refined interaction domains encom- pass the exposed heme edge and are to a large extent overlapping, indicating that electron transfer takes place at or close to this prosthetic group and that cytochrome c must move on the outer surface of the inner mitochondrial membrane during electron trans- port between reductase and oxidase. For a quantitative description of the electrostatic interaction of cyto- chrome c with other molecules, it is essential to take into account the totality of its charge configuration.
Studies with singly modified cytochromes c have shown
that electron transfer takes place most probably at, or close
zyxwvutsrqponmlkjihgfedcbaZYXWVUTSRQPONMLKJIHGFEDCBA
* This work was supported by Grant GM 19121 from the National Institutes of Health. The costs of publication of this article were defrayed in part by the payment of page charges. This article must
therefore be hereby marked "advertisement" in
zyxwvutsrqponmlkjihgfedcbaZYXWVUTSRQPONMLKJIHGFEDCBA
accordance with 18U.S.C. Section 1734 solely to indicate this fact.
+
Present address, Department of Chemistry, University of Mary- land Baltimore County, Catonsville, MD 21228.9
To whom correspondence may be addressed.to, the exposed heme edge (1-12). The surface area of the heme group accessible to water molecules forms only 0.6% of the total surface of the protein as calculated from the crystal- lographic structure (13). If a similar percentage applies to the mitochondrial redox partners of cytochrome c, then a ran- domly formed complex between cytochrome c and one of these systems stands only a very small chance of having the correct orientation for electron transfer. Using an equation which takes into account the size of the molecules and of the active sites (14), one can show that rates of reaction will be lower than diffusion controlled by a factor of at least 1000. However, direct measurements by stopped flow show that electron transfer between cytochrome c and its physiological redox partners takes place a t rates which are close to diffusion- controlled (10, 15-17). This discrepancy indicates that the reactants orient themselves as they approach, leading to the suggestion that electrostatic forces, resulting from the asym- metric distribution of charges, help the molecules to attain the proper orientation for electron transfer (18-20). This model predicts that any disturbance of the charge configura-
tion will lead to a slower reaction, under conditions in which
the association is rate-limiting.
Electric potential fields have been calculated for carboxy- peptidase A (21, 22), carbonic anhydrase (23), and tRNAPhe
(24). In these studies, potentials were derived from fractional
charges allotted to every protein atom, or from
zyxwvutsrqponmlkjihgfedcbaZYXWVUTSRQPONMLKJIHGFEDCBA
ab initiocalculations. Recently, the electric potential fields around bovine superoxide dismutase (25) and tuna cytochrome c were computed (19), taking into account only the permanent charges which arise from the ionized residues and the pros- thetic groups. The results for tuna cytochrome c showed that the distribution of charges was asymmetric leading to a high value of approximately 250 debye for the dipole moment. Remarkably, the centers of the interaction domains on cyto- chrome c for the reaction with cytochrome c oxidase, cyto- chrome c reductase, purified cytochrome c1, yeast cytochrome
c peroxidase, and sulfite oxidase (4, 5, 7-11, 26, 27) nearly coincide with the point where the positive part of the dipole axis emerges from the protein surface. However, studies with the CDNP'-modified horse cytochromes c (28, 29) showed that charge changes on the back surface of the molecule, well away from any possible enzymic interaction domain, have a small but definite effect on the activities (4,5, 7,8, 10, 11). To explain this observation, it is proposed that these activity changes are due to alterations of the dipole moment of the molecule, which cause it to approach its redox partners incor- rectly. Because of this misalignment, a higher than normal energy of activation is required to reorient cytochrome c to
'
The abbreviations used are: CDNP, 4-carboxy-2,6-dinitrophenyl;TNP, trinitrophenyl; TFA, trifluoroacetyl; TFC, trifluoromethyl- phenylcarbamyl; e.u., entropy units.
4426
by guest, on July 15, 2011
www.jbc.org
Dipole Moment of
zyxwvutsrqponmlkjihgfedcbaZYXWVUTSRQPONMLKJIHGFEDCBA
Horse Cytochrome czyxwvutsrqponmlkjihgfedcbaZYXWVUTSRQPONMLKJIHGFEDCBA
zyxwvutsrqponmlkjihgfedcbaZYXWVUTSRQPONMLKJIHGFEDCBA
4427zyxwvutsrqponmlkjihgfedcbaZYXWVUTSRQPONMLKJIHGFEDCBA
the correct position for electron transfer, thereby lowering the activity. In the case of a charge change within the interaction
domain, short range effects, such
zyxwvutsrqponmlkjihgfedcbaZYXWVUTSRQPONMLKJIHGFEDCBA
as changes in quadrupole and higher order moments and steric hindrance, become im-portant and the activities of those modified cytochromes should be less than predicted from the change in dipole moment. The dipole moment calculations make it possible to determine what fraction of the inhibition results from local changes in the interaction domain, leading to their more precise definition.
Preliminary accounts of some of these results have been presented earlier (30, 31).
M E T H O D S ~
Electric Potential Field and Dipole Moment Calculations-The polypeptide backbone conformation of horse cytochrome c was as- sumed to be the same as that of tuna cytochrome c, of which the structure has been determined to a resolution of 2.0
A
by x-ray crystallography (32). The positions of amino acid side chains in horse cytochrome c, which differ from those in the tuna protein, were fitted by a computer program, and their Coordinates were kindly supplied by R. Feldmann of the Macromolecular Surface Display Project, National Institutes of Health, Bethesda, Md, who also calculated the center of mass. Since tuna cytochrome c does not contain a glutamic acid 104, the atomic coordinates of asparagine 103 of the horse proteinfrom the 2.8
zyxwvutsrqponmlkjihgfedcbaZYXWVUTSRQPONMLKJIHGFEDCBA
8, resolution map (33) were used to calculate a transfor- mation matrix, from which the coordinates of glutamic acid 104 werecomputed. This was followed by a calculation of the new coordinates of the center of mass.
It is assumed that the CDNP-group carries a single negative charge located at the carboxylic acid group, that all lysines and all arginines are protonated, that all carboxylic acids are dissociated, except the propionic acid side chains of the heme which are involved in hydrogen bonding (34), which appears to be a common property of C-type cytochromes (35). In free heme, the propionyl side chains have a pK estimated to be 5.7 (36). This will be higher in a medium of lower dielectric constant (37), such as the interior of cytochrome c. Indeed, in cytochrome c-551, in which these groups are not as well shielded from the solvent as they are in cytochrome c, single ionization pK values of approximately 6.0 and 7.3 have been determined by NMR for the ferric and ferrous forms of the protein, respectively (38, 39), indicating that only one of the two propionyl groups ionizes in the pH range of 4 to 10. No such ionization is detected with cytochrome c
(40, 41). It is also unlikely that the propionyl pK is lowered in cytochrome c, since this would require the formation of salt bridges, and the closest basic groups are either involved in other interactions, which is 5.3 as for lysine 79 (42) or are too far away, as in the case of arginine 38, 8, from the posterior propionic acid (32). These calcula- tions apply to a neutral pH, where the above assumptions are most likely correct. The coordinates of the negative charge of the CDNP- group were calculated by placing the negative charge at the appro- priate distance along a line from the center of mass through the p-
carbon atom of the lysine bearing the substituent. The center of mass was recalculated for every CDNP-modified cytochrome. In some cases, these calculations were repeated using the a-carbon instead of the P-carbon atom.
In addition, the influence of the electric field generated by a-helices (43) was taken into account. According to Hol et al. (44), this field, caused by the near perfect alignment of the small peptide bond
dipoles, can be approximated by placing a charge
zyxwvutsrqponmlkjihgfedcbaZYXWVUTSRQPONMLKJIHGFEDCBA
+1/2 e at the NH2- terminal side and a charge of -1/2 e a t the COOH-terminal side ofthe helix, in which e is the elementary charge. Tuna cytochrome
zyxwvutsrqponmlkjihgfedcbaZYXWVUTSRQPONMLKJIHGFEDCBA
ccontains four segments of a-helix which are 6 or more residues in length: residues 2 to 14, 49 to 55, 60 to 70, and 88 to 103. The coordinates of the +1/2 e charges were calculated by taking the mean of the coordinates of the first three a-carbons of the a-helix. For the
*
Portions of this paper (including part of “Methods” and Fig. 7) are presented in miniprint at the end of this paper. Miniprint is easily read with the aid of a standard magnifying glass. Full size photocopies are available from the Journal of Biological Chemistry, 9650 Rockville Pike, Bethesda, MD 20814. Request Document No. 81M-2475, cite authors, and include a check or money order for $1.60 per set ofphotocopies. Full size photocopies are also included in the microfilm edition of the Journal that is available from Waverly Press.
coordinates of the -1/2 e charges, those of the last three peptide carbonyl oxygens were used. Calculation of the distance between the two charges showed that within a relative error of 3%, the correct dipole density of 3.5 debye/l.5 8, (44) was obtained. It is assumed that other peptide bond dipoles do not contribute significantly to the electric potential field, because the many directions of the dipole vectors would tend to minimize their cumulative effect.
Details of the calculations, including Equations 1-7 are given in the Miniprint.
Relation between Electron Transfer Activities and Electrostatic Interactions-To develop a model for the influence of electrostatic parameters on the interaction between cytochrome c and its redox partners, it is assumed that 1) the derivatized cytochromes approach their negatively charged redox partners in such a way that the dipole
vectors point toward them; 2) the complex so
zyxwvutsrqponmlkjihgfedcbaZYXWVUTSRQPONMLKJIHGFEDCBA
formed is unproductive; 3) it is necessary to turn the molecule through an angle 8 for electrontransfer to occur; and 4) the work of turning the cytochrome appears in the Arrhenius equation as an extra activation energy.
It would be more accurate to calculate for every charge the differ- ence in energy between the productive and unproductive orientation. However, since the surface charge configurations of cytochrome c oxidase and reductase are unknown, an approximation is made by representing cytochrome c as a dipole which has to be turned through an angle B in a homogeneous external electric field E generated by the surface charges of the redox partner (see “Discussion”). The energy involved is given by Equation 8.
U = p * E ( I - COS 8) (8)
in which p is the dipole moment of the modified cytochrome c. As shown in the Miniprint, the influence of an inhomogeneity of the electric field is small and can be neglected (Equations 9-11).
An increase of the activation energy ( E , ) by an amount U will decrease the rate of reaction. The relative activity, r, which is defined as the ratio of the rate constant for a derivatized protein ( k ~ ) to that for native cytochrome c ( k ~ ) is given by
If it assumed that the pre-exponential factor A remains the same, this equation reduces to
(13) in which k is Boltzmann’s constant. Values of r for the various derivatives can be calculated from their activities (see below). For those derivatives which are modified outside the interaction domain, a plot of In r versus U/E should be a straight line, the slope of which is dependent on the magnitude of the electric field.
Relative Activities-The relative activities of all or some of the CDNP-lysine horse cytochrome c preparations modified at lysines 7, 8, 25, 27, 39, 60, 72, 73, 86, 87, or 99, and TNP-lysine 13 horse cytochrome c were calculated for the reaction with beef cytochrome c reductase (7), beef cytochrome c oxidase (4,8) and yeast cytochrome c peroxidase (5) from steady state kinetic data and from stopped flow experiments, for the reaction with beef cytochrome c oxidase (15, 16) and with purified beef cytochrome c1 (IO). The latter yield a direct measure of the biomolecular rate constants. For the steady state spectrophotometric experiments, the relative bimolecular rate con- stants were calculated from the intercepts with the V / S axis of an
Eadie-Hofstee plot, which yields V,,/K,. Taking the following scheme as an example, in which the reduction of ferricytochrome c
(c3+) to ferrocytochrome c (c”) by cytochrome c reductase ( bc12+ for
the ferrous form, and bcl3+ for the ferric form),
= e-U/kT
bC12+ + c3+
2
k bc,2+c3+2
k bC13+C2+2
bC13+ + cz+( 14)
k-1 k-2 k-3
V,,/K, is equal to (47)
Furthermore, if k-1 = ks, k2 = k-2, and k-1 << kz, then
V,,/K, = ‘hk,[bc~]~.,~a. For the steady state polarographic assay (4), it is assumed that V,,,../K, is proportional to k l , enabling values of r
to be calculated for the CDNP-modified proteins and the TNP-lysine 13 cytochrome c.
by guest, on July 15, 2011
www.jbc.org
4428
zyxwvutsrqponmlkjihgfedcbaZYXWVUTSRQPONMLKJIHGFEDCBA
Dipole Moment ofzyxwvutsrqponmlkjihgfedcbaZYXWVUTSRQPONMLKJIHGFEDCBA
Horse Cytochrome czyxwvutsrqponmlkjihgfedcbaZYXWVUTSRQPONMLKJIHGFEDCBA
FIG. 1. Stereoscopic diagram of cytochrome
zyxwvutsrqponmlkjihgfedcbaZYXWVUTSRQPONMLKJIHGFEDCBA
c as determined circles are the a-carbons with the residue numbers written in them,from an electron density map of tuna ferricytochrome c at a and the smaller circles represent the side chain atoms. The coordinate
resolution of 2.0 A
zyxwvutsrqponmlkjihgfedcbaZYXWVUTSRQPONMLKJIHGFEDCBA
(32). The molecule is viewed from the right, system used throughout is indicated in the upper left corner. The Y-such that the plane of the heme (black circles) is parallel to the plane axis is perpendicular to the plane of the heme, pointing downwards, of the page. The "front" of the molecule, containing the exposed heme and passes through the center of mass (see Fig. 2), which is the origin. edge, is at the left side, while the "back" is at the right. The larger
TABLE I
Dipole moments of horse cytochrome c
Approximate points at which the dipole axis c r o e s the protein surface
Cytochrome c
zyxwvutsrqponmlkjihgfedcbaZYXWVUTSRQPONMLKJIHGFEDCBA
8" l l b P UEPositive end Negative end
degrees debye c o ~ ~ ~ b '
Ferric 0 33 325 0 Peptide N of Phe 82 Between
zyxwvutsrqponmlkjihgfedcbaZYXWVUTSRQPONMLKJIHGFEDCBA
pC of Phe 36 and N/O of Ferrous 3.0 34 308 0.1 PC of Phe 82 6N/O of Asn 103Ferric, neglecting a-helices 9.5 28 345 1.6 y2C of Ile 81 yC of Phe 36 Ferric, histidine 33-protonated 9.4 24 304 1.4 Peptide 0 of Ile 81 PC of Phe 36 Ferric, propionic acid of pyrrole 8.2 33 301 1.0 Peptide C of Phe 82 aC of Phe 36 Ferrous, neglecting a-helices 7.gd 30 327 1.0 PC of Phe 82 6N/O of Asn 103
Asn 103 ring I11 ionized
0 is the angle between the dipole vectors of ferric cytochrome c and the other cytochromes, as listed.
zyxwvutsrqponmlkjihgfedcbaZYXWVUTSRQPONMLKJIHGFEDCBA
p is the angle between the dipole vectors and the plane of the porphyrin.The work, U, per electric field strength, E , to turn the cytochrome to the orientation of ferric cytochrome c.
With respect to the dipole vector of ferrocytochrome c.
TABLE I1 TABLE I11
zyxwvutsrqponmlkjihgfedcbaZYXWVUTSRQPONMLKJIHGFEDCBA
I Femc
Cytochrome c
Native CDNP-lysine 7 CDNP-lysine 8 CDNP-lysine 13 CDNP-lysine 25 CDNP-lysine 27 CDNP-lysine 39 CDNP-lysine 60 CDNP-lysine 72 CDNP-lysine 73 CDNP-lysine 86 CDNP-lysine 87 CDNP-lysine 99 TNP-lvsine 13
24.4 11.4 35.9 41.2
U / E x
l0TJ
*oulomb. meter
0
15.6 26.4 12.7 23.9 19.7 13.7 3.1 11.7 22.2
17.8 27.8 3.3
debye degrees
385 35.0
175 40.0 249 44.1 223 41.0 287 46.4 457 12.6 261 10.0
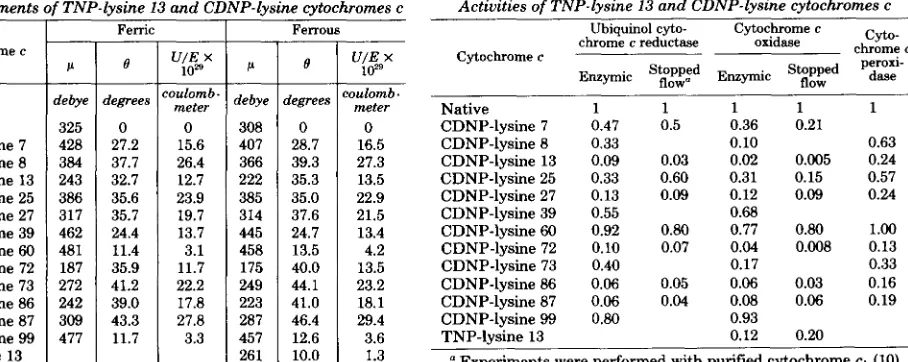
Dipole moments of TNP-lysine 13 and CDNP-lysine cytochromes c Activities of TNP-lysine 13 and CDNP-lysine cytochromes c
I Ferrous Ubiquinol cyto- Cytochrome c cyto-
f
Cytochrome c chrome c reductase Stopped Enzymic oxidase Stopped peroxl- dasechrome c
coulomb. flow" flow meter
0
16.5 27.3 13.5 22.9 21.5 13.4 4.2 13.5 23.2 18.1 29.4
3.6 1.3
Native 1 1 1 1
CDNP-lysine 7 0.47 0.5 0.36 0.21 CDNP-lysine 8 0.33 0.10
CDNP-lysine 13 0.09 0.03 0.02 0.005 CDNP-lysine 25 0.33 0.60 0.31 0.15
CDNP-lysine 27 0.13 0.09 0.12 0.09 CDNP-lysine 39 0.55 0.68
CDNP-lysine 60 0.92 0.80 0.77 0.80
CDNP-lysine 72 0.10 0.07 0.04 0.008 CDNP-lysine 73 0.40 0.17
CDNP-lysine 86 0.06 0.05 0.06 0.03 CDNP-lysine 87 0.06 0.04 0.08 0.06 CDNP-lysine 99 0.80 0.93 TNP-lysine 13 0.12 0.20
Experiments were performed with purified cytochrome
1
0.63 0.24 0.57
0.24
1.00 0.13 0.33 0.16 0.19
by guest, on July 15, 2011
www.jbc.org
[image:3.590.112.473.64.277.2] [image:3.590.86.540.557.738.2] [image:3.590.298.545.563.732.2]Dipole Moment of
zyxwvutsrqponmlkjihgfedcbaZYXWVUTSRQPONMLKJIHGFEDCBA
Horse Cytochrome czyxwvutsrqponmlkjihgfedcbaZYXWVUTSRQPONMLKJIHGFEDCBA
4429RESULTS
zyxwvutsrqponmlkjihgfedcbaZYXWVUTSRQPONMLKJIHGFEDCBA
Electric Potential Fields-Potential fields of cytochrome c
zyxwvutsrqponmlkjihgfedcbaZYXWVUTSRQPONMLKJIHGFEDCBA
are depicted in Figs.
zyxwvutsrqponmlkjihgfedcbaZYXWVUTSRQPONMLKJIHGFEDCBA
2-5 and, in the Miniprint in Fig. 7 . In these figures, the molecule is viewed from the right, such that,with the exception of Fig. 2, A and C, the plane of the heme coincides with the plane of the page. The exposed heme edge, or the “front,” is at the lower left side of Fig. 2B and the “back” of the protein at the upper right. The structure of cytochrome c itself (32) is shown in Fig. 1. The orientation of the molecule in this figure differs from that in the electric potential field plots by a clockwise rotation of 45” in the XZ-
plane, as indicated by the coordinate system in the upper left corner.
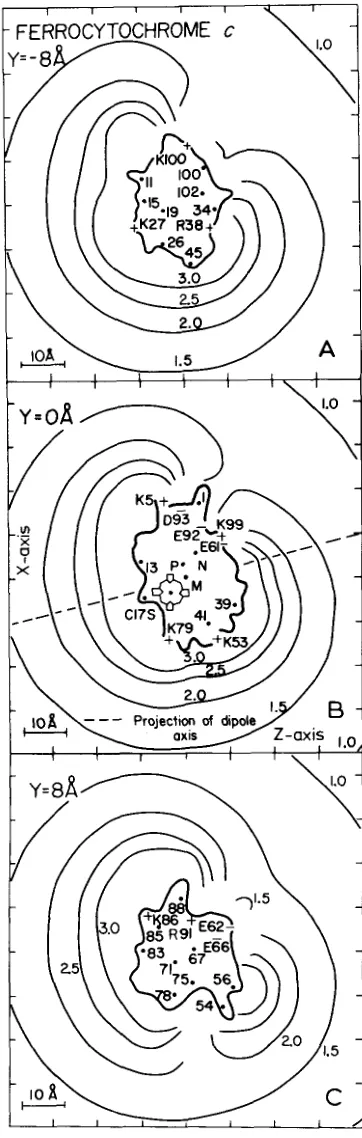
Fig. 2 shows three parallel sections at 8-8, intervals through horse ferrocytochrome c and its electric potential field. The potential is expressed in units of kT/e. Since all molecules have a translational kinetic energy of 1.5 KT, the use of these units facilitates the interpretation of the figures. Thus, an ion with a single negative charge will encounter cytochrome c
when it has crossed the 1.5 kT/e surface. The 1 kT/e surface
is nearly a perfect sphere at a distance of 50-60
zyxwvutsrqponmlkjihgfedcbaZYXWVUTSRQPONMLKJIHGFEDCBA
8, from the center of the molecule, as earlier shown for tuna cytochromec (19). A t this distance and further away, the effect of the asymmetric charge distribution is negligible, whereas it be- comes significant a t the 1.5 kT/e and higher potential surfaces. The latter surfaces are indented at the back, because of the concentration of negative charges in that area of the protein. Another important feature of Fig. 2 is that the potential surfaces do not indicate the location of individual charges. Fig. 3 represents the electric potential field of ferrocytochrome
c without the contribution of a-helix dipoles. This figure is very similar to Fig. 2B, except that at the back of the molecule the charge distribution is slightly more asymmetric. Fig. 4
gives the distribution of equipotential lines in a cross-section of horse ferricytochrome c. As one would expect from the higher net charge, these lines are further away from the protein surface.
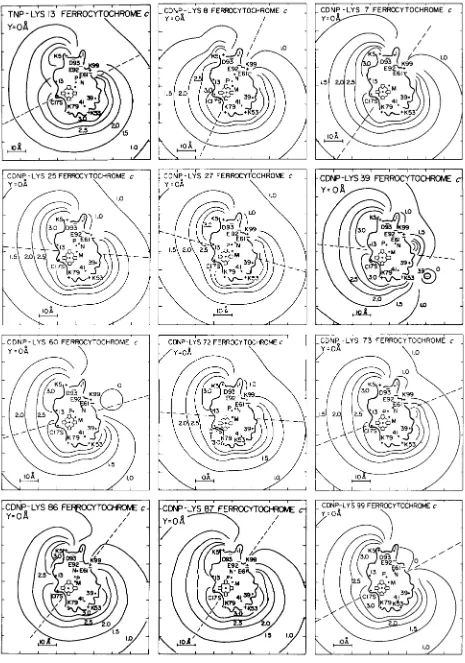
In the case of the CDNP derivatives, it is possible to observe a single charge, because the negative charge at the 4-position of the phenyl group is assumed to be located in the aqueous phase at some distance from the protein surface and thus has a distinct effect on the distribution of potential surfaces. This
is evident in Fig. 5, depicting a section through the electric potential field of CDNP-lysine 13 horse ferrocytochrome c,
which, like all the chemically modified cytochromes c, also
shows the effect of the smaller net charge, f 6 e instead of
zyxwvutsrqponmlkjihgfedcbaZYXWVUTSRQPONMLKJIHGFEDCBA
+8e. Electric potential fields calculated for 12 other chemically modified horse cytochromes c are shown in Fig. 7 in the Miniprint.
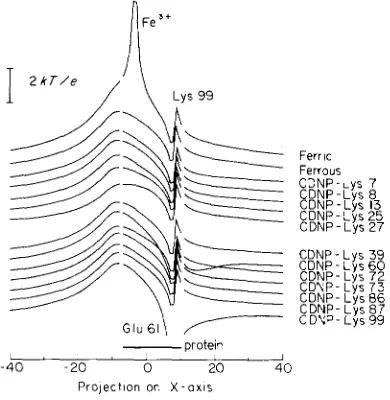
To test whether there was a correlation between activity and the strength of the potential field close to the exposed heme edge, the area through which electron transfer is most likely to occur, the potential was calculated along a line starting in front of the molecule, through the bridging carbon- atom between pyrrole rings I1 and 111, the iron atom, the
bridging carbon-atom between pyrrole rings I and IV, leaving
the protein near the salt bridge between lysine 99 and glutamic acid 61 (Fig. 6). The differences in potential in front of the heme edge between the various derivatives were found to be small and to vary in a way which is not correlated with enzymic activity.
Dipole Moments-The center of positive charge, P, of horse ferricytochrome c was located 3.11 8, from the center of mass, M, while the center of negative charge, N , is 5.87 8, from M
toward the back of the molecule. The distance from N to p is
zyxwvutsrqponmlkjihgfedcbaZYXWVUTSRQPONMLKJIHGFEDCBA
I I I I
1.5
I 1 I I I I \ I
A
I I I I I 1 I
c
I I I I I I
FIG. 2. Equipotential lines around horse ferrocytochrome c
in three parallel sections perpendicular to the Y-axis. The potentials are expressed in units of kT/e. Only charges (+,-) and a-
carbons (.) of amino acids between
zyxwvutsrqponmlkjihgfedcbaZYXWVUTSRQPONMLKJIHGFEDCBA
Y+
2 A and Y - 2 A are indicated.D, E , K , R , P, N , and M indicate aspartic acid, glutamic acid, lysine,
arginine, the center of positive, the center of negative charge, and the center of mass, respectively. The dashed line is a projection of the dipole axis on the plane Y = 0. A , marked Y = -8 A, represents a section 8 8, above the XZ-plane. B , marked Y = 0
A
represents a section containing the heme plane and the center of mass. C , markedY = 8 A, is a section 8 A below the XZ-plane.
by guest, on July 15, 2011
www.jbc.org
[image:4.598.336.517.61.630.2]4430 Dipole Moment
zyxwvutsrqponmlkjihgfedcbaZYXWVUTSRQPONMLKJIHGFEDCBA
of Horse Cytochromec
zyxwvutsrqponmlkjihgfedcbaZYXWVUTSRQPONMLKJIHGFEDCBA
FIG. 3 (left). Cross-section of the electric potential field around horse ferrocytochrome c calculated without the con- tribution of a-helices. This figure should be compared with Fig. 2B.
Symbols are as
zyxwvutsrqponmlkjihgfedcbaZYXWVUTSRQPONMLKJIHGFEDCBA
given for Fig. 2. FIG. 4 (center). Cross-section of the electric potential fieldaround horse ferricytochrome c. Symbols are as given for Fig. 2.
zyxwvutsrqponmlkjihgfedcbaZYXWVUTSRQPONMLKJIHGFEDCBA
-protein
1 1 . 1
zyxwvutsrqponmlkjihgfedcbaZYXWVUTSRQPONMLKJIHGFEDCBA
-40
zyxwvutsrqponmlkjihgfedcbaZYXWVUTSRQPONMLKJIHGFEDCBA
- 2 0zyxwvutsrqponmlkjihgfedcbaZYXWVUTSRQPONMLKJIHGFEDCBA
0 20 40P r o ~ e c t ~ o n on
zyxwvutsrqponmlkjihgfedcbaZYXWVUTSRQPONMLKJIHGFEDCBA
X - 0 x 1 s FIG. 6. Electric potential for ferric and ferrous native horsecytochrome c and for the ferrous forms of the various CDNP- cytochromes c. The potential was calculated along a line starting in front of the heme edge, through the bridging C-atom between pyrrole rings I1 and 111, the iron atom, the bridging C-atom between pyrrole
rings
zyxwvutsrqponmlkjihgfedcbaZYXWVUTSRQPONMLKJIHGFEDCBA
I and IV, and leaving the protein near the salt bridge between lysine 99 and glutamic acid 61. In the calculation, partial charges wereneglected and the dielectric constants inside and outside of the protein were assumed to be the same. Because of these approximations, the absolute values of the potentials given for the interior of the protein (the area indicated on the figure), is surely underestimated and can only be employed to compare qualitatively one cytochrome c with another.
4.46
A,
leading to a dipole moment of 325 debye (Equation 6 ;zyxwvutsrqponmlkjihgfedcbaZYXWVUTSRQPONMLKJIHGFEDCBA
see Fig. 2 B ) . Table I list the dipole moments of horse ferri-and ferrocytochrome c and the differences which would result from an ionized histidine 33, an ionized propionic acid of pyrrole ring 111, and from neglect of the &-helices. In all cases, the angle between the dipole vectors is less than loo and the magnitude is affected by a t most 7%.
The dipole moments of the CDNP-derivatives are listed in Table 11. They vary in magnitude by 140 debye and in direc- tion by 4 5 O . The relative error, deriving from lack of a precise localization of the CDNP-moiety, is estimated to be less than 10% of the reported value, based on comparison of the results
FIG. 5 (right). Cross-section of the electric potential field around CDNP-lysine 13 ferrocytochrome c. Note the change in the shape of the field in front of the molecule, and in the direction of the dipole axis, as compared to Fig. 2. Symbols are as given for Fig. 2.
TABLE I V
Dipole moments and enzymic activities of TFA- and TFC-lysine cytochromes c
Activities calculated from Table I1 of Smith et al. (9).
Succi-
Cytochrome ca P e U / E tochrome chrome c nate-cy- Cyto- c reduc- oxidase
tase
debye degrees c o ~ ~ ~ ~ '
Native 325 0 0
TFA-lysine 13 291 10.7 1.4 0.24 0.20
TFA-lysine 22 379 9.3 1.7 1.00 0.91 TFA-lysine 25 326 13.9 3.2 1.06 0.37
TFA-lysine 55 316 12.2 2.3 1.03 1.00
TFA-lysine 72 262 8.0 2.5 0.48 0.32 TFA-lysine 87 297 16.7 4.1 0.50 0.36
TFA-lysine 88 328 17.5 5.1 0.67 0.71 TFA-lysine 99 371 5.9 0.6 1.00 1.11 TFC-lysine 8 331 19.1 6.0 0.59 0.42
TFC-lsyine 13 278 13.8 2.1 0.26 0.14
TFC-lysine 27 302 14.7 3.3 0.48 0.63 TFC-lysine 72 252 10.1 3.9 0.48 0.37
TFC-lysine 79 297 12.5 2.3 0.43 0.56 TFC-lysine 100 369 9.3 1.6 1.00 1.06
"Dipole moments, p , angles, 8, and amounts of work per electric field strength, U / E , are given for the oxidized state of the protein
only. The values for the reduced cytochromes are not expected to be significantly different (see Table 11).
TABLE V
Apparent electric field strengths close to the surfaces
zyxwvutsrqponmlkjihgfedcbaZYXWVUTSRQPONMLKJIHGFEDCBA
of the physiological redox partners of cytochrome c calculated from theslopes of the plots of In r versus U / E
Redox partner Method of assay
skFgh
Fig. E xntM V . m"
Cytochrome c reductase Spectrally" 100 8 18.0
Cytochrome CI Stopped flowb 300 9 13.6
Cytochrome c oxidase Polarographic' 25 10 28.0
Cytochrome c oxidase Stopped flowd 133 11 38.5 Cytochrome c peroxidase Spectrally' 50 12 9.1 Sulfite oxidase Spectrally' 50 23.7
Ref. 7. Ref. 10. Refs. 4 and 8. Refs. 15 and 16. Ref. 11.
e Ref. 5.
by guest, on July 15, 2011
www.jbc.org
[image:5.590.47.548.61.231.2] [image:5.590.69.264.301.501.2] [image:5.590.302.542.304.535.2]Dipole Moment
zyxwvutsrqponmlkjihgfedcbaZYXWVUTSRQPONMLKJIHGFEDCBA
of Horse Cytochrome czyxwvutsrqponmlkjihgfedcbaZYXWVUTSRQPONMLKJIHGFEDCBA
4431zyxwvutsrqponmlkjihgfedcbaZYXWVUTSRQPONMLKJIHGFEDCBA
I
.o
zyxwvutsrqponmlkjihgfedcbaZYXWVUTSRQPONMLKJIHGFEDCBA
Reductase
+ ZI
zyxwvutsrqponmlkjihgfedcbaZYXWVUTSRQPONMLKJIHGFEDCBA
zyxwvutsrqponmlkjihgfedcbaZYXWVUTSRQPONMLKJIHGFEDCBA
0.4.-
.? 0.3
zyxwvutsrqponmlkjihgfedcbaZYXWVUTSRQPONMLKJIHGFEDCBA
c V
a
zyxwvutsrqponmlkjihgfedcbaZYXWVUTSRQPONMLKJIHGFEDCBA
Y
0.21
i
-
c
-: 2
2?
0.08 13
Q06 ?6 8.7
I
T
T
zyxwvutsrqponmlkjihgfedcbaZYXWVUTSRQPONMLKJIHGFEDCBA
u
0 IO 2 0 3 0UE" x IO2' ( C m )
zyxwvutsrqponmlkjihgfedcbaZYXWVUTSRQPONMLKJIHGFEDCBA
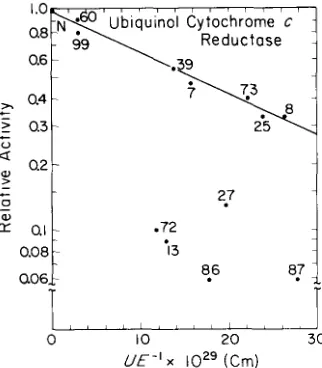
FIG. 8 (left). Steady state relative activities of various mono-CDNP-cytochromes c with ubiquinol cytochrome c reductase
(7) plotted logarithmically as a function of the amount of work,
17, divided by the electric field strength, E, to turn the dipoles of the CDNP-derivatives over an angle B for effective reaction. The line represents the expected relative activities for a homogeneous electric field of 18.0 X
lo6
V.m". The numbers denote the aminoacid positions of the modified lysyl residue in the various CDNP-
A t i
c
8
0.1 -c
o.2
1
W
1 0.06 .72 -86 - '0 0.04
W 0.02
1
* I 30.0 I
0.006
t
0 I O 2 0 3 0
U E - I x ( C m ) cytochromes c tested.
FIG. 9 (right). Relative bimolecular rate constants for the reaction of various mono-CDNP-cytochromes c with cyto- chrome CI, as determined by stopped flow kinetics (10) plotted logarithmically as a function of the work parameter given in Fig. 7. The slope represents the expected relative activities for a
homogeneous electric field of 13.6 X 10'
zyxwvutsrqponmlkjihgfedcbaZYXWVUTSRQPONMLKJIHGFEDCBA
V.m".FIG. 10 (left). Steady state relative activities of various termined by the stopped flow technique (14,15), plotted as in mono-CDNP-cytochromes c with cytochrome c oxidase as de- Fig. 7. The slope represents the expected relative activities for a
termined in the polarographic assay (4,8), plotted as in Fig. 7. homogeneous field of 38.5 X
lo6
V.m".The slope represents the expected relative activities for a homoge- FIG. 12 (right). Steady state relative activities of various neous electric field of 28.0 X
lo6
V.m". mono-CDNP-cytochromes c with cytochrome c peroxidase (5)FIG. 11 (center). Bimolecular relative activities of various plotted as in Fig. 7. The slope represents the expected relative mono-CDNP-cytochromes c with cytochrome c oxidase as de- activities for a homogeneous field of 9.1 X
lo6
V . m-'.from calculations in which the a-atom of the respective lysine instead of the p-atom is used to calculate the position of the CDNP-moiety. There is no clear relation between these dipole moments, in either direction or magnitude, and the relative enzymic activities listed in Table 111. However, as shown in
Fig. 8, there appears to be an inverse relation between the logarithms of the relative activities of the cytochromes modi- fied a t positions 99, 60, 39, 7, 73, 25, or 8, and the quantities
U / E , which are proportional to the amount of work required to turn the molecule to the proper orientation for electron transfer in the electric field of the enzyme. The plot in Fig. 8 is based on the steady state enzymic reduction by ubiquinol cytochrome c reductase (7). Interestingly, a very similar pat- tern is observed in Fig. 9 from the results of the stopped flow measurements with purified cytochrome c1 (lo), the site of the
cytochrome c reductase complex at which electron transfer to
cytochrome c takes place (48,49). The negative slopes of the lines in Figs. 8 and 9 indicate that the modified cytochromes
c reorient themselves with respect to a surface with a net negative charge. The relative activities of the cytochromes c
modified at positions 13, 72, 86, 27, or 87 fall below the line which quantitatively describes the activities of the other mod- ified cytochromes c. This indicates that the first order ap- proximation to represent these modified cytochromes as di- poles is insufficient and/or that the reaction is affected by factors additional to the change in dipole moment, such as
steric hindrance, In either case, this demonstrates that these lysines, all close to the exposed heme edge, are part of the cytochrome c reductase interaction domain.
Similar considerations for the reactions of the modified cytochromes c with cytochrome c oxidase, as studied by the polarographic assay (4, 8) (Fig. 10) and by stopped flow (15, 16) (Fig. ll), show that lysines 13,72,86, and to a lesser extent lysine 27 form part of the interaction domain. The patterns
on the two plots, Figs. 10 and 11, are quite similar.
The relative activities and calculated dipole moments for
by guest, on July 15, 2011
www.jbc.org
[image:6.596.121.282.65.249.2] [image:6.596.303.468.83.254.2] [image:6.596.49.544.339.487.2]4432
zyxwvutsrqponmlkjihgfedcbaZYXWVUTSRQPONMLKJIHGFEDCBA
Dipole Moment ofzyxwvutsrqponmlkjihgfedcbaZYXWVUTSRQPONMLKJIHGFEDCBA
Horse Cytochrome cFIG. 13.
zyxwvutsrqponmlkjihgfedcbaZYXWVUTSRQPONMLKJIHGFEDCBA
Schematic representationof the domains on
zyxwvutsrqponmlkjihgfedcbaZYXWVUTSRQPONMLKJIHGFEDCBA
cytochrome czyxwvutsrqponmlkjihgfedcbaZYXWVUTSRQPONMLKJIHGFEDCBA
for the interaction with beef cyto-chrome c reductase and oxidase, yeast cytochrome c peroxidase, and beef sulfite oxidase. The shaded rec- tangle represents the solvent-accessible heme edge. The number of circles around a given lysyl residue is propor- tional to the percentage of the inhibition of the CDNP-cytochrome c modified at khat lysine which is unaccounted for by the alteration in dipole moment. The radii of these circles are multiples of an arbitrary value of 2.5 A. The numbers
indicate the relative positions of the
zyxwvutsrqponmlkjihgfedcbaZYXWVUTSRQPONMLKJIHGFEDCBA
a-carbons of the residues and D is the point near the the P-carbon of phenylalanine 82, at which the dipole axis of native cytochrome c crosses the front surface of the protein. The interaction domain for sulfite oxidase depicted in this fashion is
taken from Ref. 11.
zyxwvutsrqponmlkjihgfedcbaZYXWVUTSRQPONMLKJIHGFEDCBA
CYTOCHROME c REDUCTASE CYTOCHROME c OXIDASE
SULPHITE OXIDASE CYTOCHROME c PEROXIDASE
TFA- and TFC-lysine cytochromes c (9) are listed in Table
IV. As expected, neutralization of a single positive charge affects the dipole moment much less than the double charge change which occurs in the CDNP-modified cytochromes c.
A similar approach to the reaction of modified cytochromes
c with yeast cytochrome c peroxidase (5) appears to indicate
that lysines 13, 27, 72, 73, 86, and 87 are located in the interaction domain (Fig. 12). This figure should be interpreted with caution, since not enough points are available to identify with certainty the derivatives whose activities define the straight line. The lines in Figs. 8-12 were drawn without the use of curve-fitting techniques, since the relative activities of only some of the derivatives can be expected to follow the simple linear relation In r = - U / k T .
The slopes of the line in Figs. 8-12 are proportional to the apparent electric fields of the enzymic reaction partners of cytochrome c examined. The calculated strengths of these
electric fields are listed in Table V.
The proportions of the inhibitions which could not be accounted for by the change in dipole moment were used to represent the enzymic interaction domains. Around a given
lysine residue, circles were drawn such that the number
zyxwvutsrqponmlkjihgfedcbaZYXWVUTSRQPONMLKJIHGFEDCBA
ofcircles was proportional to this fraction. The maximum num- ber of circles was arbitrarily set at 5 for the most inhibited derivative. From the outside to the inside, circles were con- nected when they intersected. The results, shown in Fig. 13 for beef cytochrome c reductase, cytochrome c oxidase, and yeast cytochrome c peroxidase, define the surface areas of
cytochromes c which interact with these protein electron
exchange partners, a site generally referred to as the enzymic interaction domain.
DISCUSSION
Electric Potential Fields-The shape of the electric poten- tial fields around horse ferro- and ferricytochrome c (Figs. 1-
4) indicate that the charge distribution on the surface of
cytochrome c is asymmetric, as has been found previously for tuna cytochrome c (19). This is not obvious from the 1 k T / e
surface, which is nearly spherical because cytochrome c has a
high net charge. The potential at a given point can be de- scribed as the sum of the potentials of the net charge, dipole moment, and higher order moments which are proportional to l/r and 1/?, etc., respectively, in which r is the distance between the center of the molecule and the point outside the molecule. Because of the high net charge, the inhomogeneous charge distribution becomes noticeable only close to the sur- face of the molecule. For our calculations, we assumed that the charges were imbedded in water, with a dielectric constant of 78.5. However, the protein forms a cavity of low polariza- bility. From Gauss’ law, one can show that the presence of the protein has no influence on the component of the potential which is due to the net charge. Thus, the positions of the spherical 1 k T / e and lower k T / e surfaces, which presumably are caused only by the net charge, should not change with respect to the protein when more rigorous calculations are carried out. Closer to the protein surface the potential is probably underestimated, depending on the extent to which surface charges are “solvated” by local induced and perma- nent dipoles (50).
The presence of an inert electrolyte will diminish the strength of the electric potential field (19), but it will not abolish it: ionic strength studies between 5 and 100 mM, where the Brgnsted-Debye-Huckel theory can be applied (51), show that over that entire range cytochrome c behaves as a highly
charged molecule (52-54). This does not only apply to cyto- chrome c, but also to other highly charged proteins, such as
lysozyme (55), so
zyxwvutsrqponmlkjihgfedcbaZYXWVUTSRQPONMLKJIHGFEDCBA
that the assumption of Clementi et al. (56), that all acidic and basic residues in this protein will be un-ionized or neutralized by counter-ions, is imprecise in dilute electrolyte solution.
by guest, on July 15, 2011
www.jbc.org
Dipole Moment
zyxwvutsrqponmlkjihgfedcbaZYXWVUTSRQPONMLKJIHGFEDCBA
of Horse Cytochromec
zyxwvutsrqponmlkjihgfedcbaZYXWVUTSRQPONMLKJIHGFEDCBA
4433zyxwvutsrqponmlkjihgfedcbaZYXWVUTSRQPONMLKJIHGFEDCBA
From Figs. 2B and 3, it is
zyxwvutsrqponmlkjihgfedcbaZYXWVUTSRQPONMLKJIHGFEDCBA
clear the contribution of peptide bond dipoles to the electrostatic potential field is relativelyminor as compared to that of the ionized residues. We there- fore concur with Sheridan and Allen (57) in that the termini
of a-helices
zyxwvutsrqponmlkjihgfedcbaZYXWVUTSRQPONMLKJIHGFEDCBA
wllistabilize the binding of ions but will not attract them from a great distance, as implied by Hol et al.(44). The latter suggested that the NH2 terminus of an a-helix could serve as a binding place for phosphate groups. Interest- ingly, the high affinity phosphate binding site on cytochrome
c is found near lysine 87 (58), while the NH2 terminus of an
a-helix starts near residue 88. The low affinity phosphate binding site is close to residues 25-27, where no a-helix is present.
Recently, a correlation was found3 between the reactivity of native and various CDNP-cytochromes c with ascorbate and the strength of the electric potential field in front of the heme edge (Fig. 6). A good fit to the data required a reduction of the electric potential field strength by 48%, as expected from the ionic strength (19), and the assumption of an “effective” dielectric constant of 61. This value seems reasonable in light of the model for protein titration curves proposed by Mofers (59), which assumes a gradual decrease in dielectric constant
as one approaches the surface of the protein.
Dipole Moments-Fig. 2B shows that the center of positive charge is not far from the center of mass, while the center of negative is found more toward the back. This indicates that the distribution of positive charges is more homogeneous than that of the negative charges and that the latter are the main contributors to the dipole moment of the protein, constituting 74% of the total (Equation 5).
It is interesting to note that the dipole moment resulting from the four segments of a-helix, 60 debye, partly counteracts the dipole moment of 345 debye caused by the asymmetric charge distribution to yield a net dipole moment of 325 debye (Table I, Figs. 2B and 3). A calculation which takes into account all peptide bond dipoles, yields a dipole moment of
334 debye in a direction which differs only 9.6” from the one presented here! As changes of that magnitude have little effect on the amount of work needed to reorient cytochrome
c (see Tables I and 11), the present approximation is adequate. The Interaction of Cytochrome c with Cytochrome c Re- ductase a n d Oxidase-From the steady state enzymic reduc- tion kinetics of native and modified cytochromes c by cyto- chrome c reductase, as well as the stopped flow experiments with cytochrome c1 (Figs. 8 and 9), it was concluded that the relative activities of the cytochromes c modified at positions
13,27, 72,86, or 87 are too low to be explained entirely by the change in dipole moment. This indicates that these residues are involved in the interaction with cytochrome c , as shown in Fig. 13. It should be noted that, although CDNP-lysine 86
cytochrome c
zyxwvutsrqponmlkjihgfedcbaZYXWVUTSRQPONMLKJIHGFEDCBA
has the lowest activity in the enzymic assay, the cytochromes modified at positions 13 and 72 are the mostinhibited after correction for the influence of the change in dipole moment. The interaction domain so defined is slightly smaller than that presented by Smith et al. (9). Since the TFA and TFC modification reactions employed by those authors result in the neutralization of the positive charge at the €-nitrogen of a lysine, the change in dipole moment is much less than that for the CDNP-derivatives (Table IV).
This, combined with the higher ionic strength they utilized in the assay, which reduces the strength of the electric field, indicates that the correction for the change in dipole moment would be small. Thus, relative activities of less than 1 should, apart from quadrupole and higher order effects, directly in-
B. Konig, S. H. Speck, E. C. I. Veerman, A.
zyxwvutsrqponmlkjihgfedcbaZYXWVUTSRQPONMLKJIHGFEDCBA
0. Muijsers,w.
H.Koppenol, B. F. van Gelder, and E. Margoliash, unpublished.
F. J. M. Mofers, personal communication.
dicate residues in the interaction domain. In addition to the lysines listed above, Smith et al. (9) include residues 79 and, peripherally, 8 and 88 in the interaction domain. We have no data for residues 79 and 88, while the activity of CDNP-lysine 8 ferrocytochrome c can be entirely accounted for by the change in dipole moment.
From differential chemical modification studies, in which the relative chemical reactivities of lysyl residues of cyto- chrome c free in solution were compared to those in complexes with cytochrome c reductase and oxidase, Rieder and Bos- shard (26) concluded that residues 5, 8, 13, 72-73, 86, and 87 interacted with the enzyme systems. Lysines 7,25,27, 79, and
88 showed only slightly smaller reactivities in the complex and were considered to be peripheral to the interaction do- main. The fact that this interaction domain is somewhat larger than that presented here could be inherent to the approach: residues which are not directly involved in the binding may be shielded from modification because of steric hindrance.
In Fig. 10, which shows the logarithm of the relative reac- tivity of the various derivatives in the polarographic assay for reaction with cytochrome c oxidase as a function of the amount of work per electric field strength, the scatter of the points which are supposed to follow the straight line relation- ship is larger than in Fig. 8. This may be caused by the biphasicity of the Eadie-Hofstee plot since correction for the contribution of the second phase to the fist is not yet possible. In particular, such a correction would decrease the activities of the cytochromes modified at lysines 39 and 99 of which the slopes of the second phases are more negative than those of the other derivatives and lead to a better fit in Fig. 10. The interaction domain for the reaction with cytochrome c oxidase is smaller than that for the reductase: only lysines 13, 72, 86, and, to a lesser extent, 27 are involved. Again this domain is smaller than that obtained by Smith et al. (9) and by Rieder and Bosshard (26). It is likely that the interaction domains for both enzymes also include lysine 79 (9,26,60), of which no CDNP-derivative has so far been obtained. Thus, although the interaction domains for cytochrome c oxidase and reduc- tase are slightly different (see Fig. 13), both encompass the heme edge, and the centers of both domains are close to the P-carbon of phenylalanine 82. The confidence one may have in these conclusions is bolstered by the fact that the results obtained in three different laboratories, employing two inde- pendent approaches, three different sets of chemically modi- fied cytochromes c, and several different assay systems and conditions for reaction with mitochondrial redox partners, all lead to very similar interaction domains.
The negative slopes of the lines in Figs. 8-12 show that in every case studied the dipole vectors of the modified cyto- chromes c align themselves with the electric field vector (see Fig. 5 of Ref. 19). However, from the amino acid sequence of
cytochrome CI (61), one can estimate that this protein is
approximately neutral at pH 7. Thus, cytochrome c cannot be guided by the net charge of cytochrome cl. In principle, an appropriate electric field could be brought about by charges on neighboring subunits of the reductase complex, but, be- cause the patterns in Figs. 8 and 9 for the cytochrome c
reductase complex and for purified cytochrome cl, respec- tively, are very similar, this appears not to be the case. One can therefore expect that the surface charge distribution of cytochrome c1 is very asymmetric, leading to a dipole moment of several hundred debye, and that cytochrome c reacts at the negative side of the dipole.
Recently, enthalpies and entropies of activation were re- ported for the reaction of native, TNP-lysine 13, and CDNP- cytochromes c modified at positions 7, 13, 25, 27, 60, and 72 (15, 16). Below 20 “C, the enthalpies of activation were found
by guest, on July 15, 2011
www.jbc.org
4434 Dipole Moment
zyxwvutsrqponmlkjihgfedcbaZYXWVUTSRQPONMLKJIHGFEDCBA
of Horse Cytochrome czyxwvutsrqponmlkjihgfedcbaZYXWVUTSRQPONMLKJIHGFEDCBA
to be the same for all these preparations, a t a value of
zyxwvutsrqponmlkjihgfedcbaZYXWVUTSRQPONMLKJIHGFEDCBA
16.5 0.5 kcal mol”. The entropies of activation of TNP-lysine 13and CDNP-lysine 13 and 72 cytochromes c were reported as
8,11, and 9 entropy units lower than that of native cytochrome
c, 32 e.u., while those of the cytochromes modified a t positions
zyxwvutsrqponmlkjihgfedcbaZYXWVUTSRQPONMLKJIHGFEDCBA
60, 7,25, and 27 were lower than that of the native protein by only 2, 3, 4 and 3 e.u. respectively. According to the electro- static model presented in this paper for the mechanism by which the activities of the CDNP-modified cytochromes c are inhibited, of the modified proteins examined, CDNP-lysine 25
cytochrome c is the one which requires the largest extra activation energy, U , to reorient it in the 38.5. lo6 V.m”
electric field of the oxidase. (Fig. 11 and Table V). The value of U in this case is 2.1 kT, corresponding to 1.3 kcal-mol”. For the other modified cytochromes c, for which activation parameters have been determined, U is even smaller. Such
values are small enough to be within the error of direct measurements, in agreement with the fact that no significant differences in the values of AHt were observed (15, 16).
With regard to the entropies of activation, only those cy- tochromes modified within the enzymic interaction domain showed significant decreases (15, 16). As the inhibition of these derivatives, beyond that which results from a change in AH*, must be due to decrease in AS*, one can calculate from
Fig. 11 that such decreases in AS* would amount to 8.3 and
7.5 e.u. for CDNP-lysine 13 and 72 cytochrome c, respectively. This compares well with the experimentally determined val- ues of 11 and 9 e.u. (15, 16). The large positive AS* in entropy
upon formation of the transition complex might indicate that in this state protein-bound water molecules are released (62, 63); that ASt is smaller for the cytochromes modified near the heme edge indicates that the proper complex is not formed, but of itself does not distinguish between a result of steric hindrance or an electrostatic effect.
The Interaction with Yeast Cytochrome c Peroxidase-
The domain on the surface of cytochrome c for interaction with yeast cytochrome c peroxidase is slightly larger than that for cytochrome c reductase (Fig. 13). It compares well with that determined by Pettigrew (27) and contains all of the lysines which were postulated by Poulos and Kraut (64) to be involved in this interaction.
Functional Significance of the Asymmetric Distribution of
Charges on Cytochrome c-Since the solvent-accessible heme
edge forms part of the refined enzymic interaction domains presented here, and elsewhere for sulfite oxidase ( l l ) , it seems likely that electron transfer takes place at, or close to this site, as much earlier proposed for the reactions of cytochrome c with small molecular weight oxidants and reductants (see Refs. 65 and 66). Furthermore, cytochrome c cannot form a productive tertiary complex with cytochrome c oxidase and reductase (the so-called “solid state” model), since the inter- action domains for both complexes are largely overlapping. A teritary complex in which cytochrome c has rotational mobil- ity cannot be ruled out, but seems unlikely. Since there is
much less change in the direction of the dipole vector during the redox cycle than would be required to facilitate rotation of the molecule and bring its heme edge from one electron exchange partner to the other, it is difficult to see how such a rotational mechanism would operate effectively. For example, at an ionic strength of 100 mM, from the data for native
cytochrome c and an effective electric field of 18
zyxwvutsrqponmlkjihgfedcbaZYXWVUTSRQPONMLKJIHGFEDCBA
X lo6 V.m”(Table V), a rotation of 180” would require an energy expend- iture of about 9 KT. If the proximity of the two negatively
charged enzymic complexes leads to a diminution of the net electric field to an insignificant level, cytochrome c would tend to migrate elsewhere. A model of the system in which cyto- chrome c diffuses between its physiological redox partners
(67) is therefore preferable. Whether diffusion takes place
over the outer surface of the inner mitochondrial membrane, namely in two dimensions, or whether three-dimensional dif- fusion is the dominant mode, namely with cytochrome c free in the intermembrane space, will depend on the direction and the strength of the electric field in that space (68).
The contradiction between such a diffusional model and the results of experiments in which cytochrome c was cross- linked covalently to mitochondrial inner membrane prepara- tions while retaining electron transfer activity between reduc- tase and oxidase (69), may only be apparent. Indeed, such preparations contain a major proportion of the cytochrome c bound to phospholipid (69, 70), the diffusion of which in the plane of the membrane (71) may well be sufficient to sustain the observed electron transfer activity. In fact, in the two cases in which the protein was covalently linked to purified cytochrome c oxidase from a well d e f i e d locus on the cyto- chrome c molecule, the resulting complex was inactive (72, 73).
The concept that the same pathway operates for both oxidation and reduction has recently been challenged (74).
Several internally modified cytochromes c were observed to
have close to normal activities with cytochrome oxidase while being severely inhibited in the succinate-cytochrome c reduc- tase system. However, this does not necessarily indicate dif- ferent interaction domains for the two systems, since the reduction potentials of the chemically modified cytochrome c
preparations employed were 60 to
zyxwvutsrqponmlkjihgfedcbaZYXWVUTSRQPONMLKJIHGFEDCBA
90 mV lower than that of native cytochrome c, providing a simple thermodynamic basisfor the observations, including the identity of V,,, values for
the modified and native cytochromes c.
In considering the influence of electrostatic charge on the reaction rate (see Ref. 51) or the binding of cytochrome c with its electron exchange partners, the influence of charged side chains elsewhere than in the presumed binding domain has commonly been ignored. Thus, the models proposed for the interaction of cytochrome c with cytochrome b5 (75) and
cytochrome c peroxidase
zyxwvutsrqponmlkjihgfedcbaZYXWVUTSRQPONMLKJIHGFEDCBA
(64) rely only on the charged residues located within the respective heme edge regions. Similarly,great significance has been attached to the ring of lysines on the front surface of cytochrome c, while other regions are termed “unimportant” and the lower part of the molecule, containing several charged residues is termed “unnecessary”
(76). In fact, as noted above, it is not even the distribution of positive charges that makes the largest contribution to the dipole moment, but that of the negative charges. That changes in charge occurring outside the enzymic interaction domain have sigmfkant effects on reaction rates is amply demon- strated by the CDNP-cytochromes c. Furthermore, the net charge of cytochrome c and, in all probability, its dipole moment, are evolutionarily strongly conserved parameters, in the face of relatively numerous variations in individual charged residues (77).
Recently, the ionic strength dependencies of the reactions
of TFA- and TFC-modified cytochromes c with succinate cytochrome c reductase, cytochrome c oxidase yeast cyto-
chrome c peroxidase, and sulfite oxidase were determined (78-
zyxwvutsrqponmlkjihgfedcbaZYXWVUTSRQPONMLKJIHGFEDCBA
80). Using a simplified Marcus-Debye treatment (see Ref. 51),
the ionic strength dependence was considered to be a function of the number of charge-pair interactions. However, as dis- cussed earlier (11, 51), such a treatment cannot serve to determine the number of charge-pair interactions.
Indeed, it is the complete charge configuration of cyto- chrome c that will determine the orientation with respect to a negatively charged surface. Since the angle between the dipole vector and the heme is approximately 30” for either ferri- or ferrocytochrome c, the angle between the heme and
by guest, on July 15, 2011
www.jbc.org
Dipole Moment
zyxwvutsrqponmlkjihgfedcbaZYXWVUTSRQPONMLKJIHGFEDCBA
of Horse Cytochrome czyxwvutsrqponmlkjihgfedcbaZYXWVUTSRQPONMLKJIHGFEDCBA
zyxwvutsrqponmlkjihgfedcbaZYXWVUTSRQPONMLKJIHGFEDCBA
4435zyxwvutsrqponmlkjihgfedcbaZYXWVUTSRQPONMLKJIHGFEDCBA
the negative surface would be 60". An angle of about 70" has in fact been estimated in a fluorescence study of binding of
porphyrin cytochrome c to oriented layers of cytochrome c
oxidase (81). In contradistinction, Brown and Wiithrich (82)
concluded from I 3 C and 'H NMR and from spin-label studies
of the binding of cytochrome c to 1:4 cardiolipin-phosphati- dylcholine vesicles that the heme edge is pointed away from the negative membrane. However, methionine 65, to which the spin-label was attached, is approximately equatorial with respect to the dipole axis. Thus, it is possible that, with cytochrome c binding to cardiolipin head groups in an ori- entation determined by the direction of the dipole moment, the spin-label is in a position to interact with the membrane, especially since the protein may penetrate the bilayer for a
few angstroms (83, 84).
zyxwvutsrqponmlkjihgfedcbaZYXWVUTSRQPONMLKJIHGFEDCBA
For neutral, zwitterionic phospholip- ids, one would expect a weaker binding in which cytochromec is oriented with the negative end of the dipole axis toward the membrane, allowing interaction between negatively charged groups on the surface of cytochrome c and the posi-
tively charged groups of the membrane. In this case an angle
of 180" -
zyxwvutsrqponmlkjihgfedcbaZYXWVUTSRQPONMLKJIHGFEDCBA
30" or 150" would occur between the heme and theplane of a lipid monolayer,
zyxwvutsrqponmlkjihgfedcbaZYXWVUTSRQPONMLKJIHGFEDCBA
as has indeed been observed in a study of the interaction of cytochrome c with a monolayer ofdipalmitoylphosphatidylcholine (85). At very low ionic strength, the angle changed to 80". Under those conditions, cytochrome c penetrates deeper into the monolayer, permit- ting a larger number of hydrophobic interactions between protein and lipid and leading to a change in orientation. In a mixed film of dipalmitoylphosphatidylcholine and phospha- tidic acid (1O:l) the same angle of 150" was found (85), while one would expect both 150" and 30" angles to be observed. It might be that both types of binding indeed took place but that the 30" binding was not detected because the probe, dansyl- phosphatidylethanolamine, by virtue of being a zwitterion, only participated in the 150" type of binding.
Acknowledgments-We thank R. Feldmann for the coordinates of
horse cytochrome c, Dr. S. Ferguson-Miller, Dr. F. Mofers, and Dr. J. van Leeuwen for helpful discussion, and Dr. S. H. Speck for the activity determinations of CDNP-lysine 39 and 99 cytochrome c in the cytochrome c reductase assay.
1. 2. 3. 4. 5. 6. 7. 8. 9. 10. 11. 12. 13. 14. REFERENCES
Staudenmayer, N., Smith, M. B., Smith, H. T., Spies, F. K., Jr., and Millett, F. (1976) Biochemistry 15, 3198-3205
Staudenmayer, N., Ng, S., Smith, M. B., and Millett, F. (1977)
Biochemistry 16,600-604
Smith, H. T., Staudenmayer, N., and Millett, F. (1977) Biochem-
istry 16,4971-4974
Ferguson-Miller, S.,
zyxwvutsrqponmlkjihgfedcbaZYXWVUTSRQPONMLKJIHGFEDCBA
Brautigan, D. L., and Margoliash, E. (1978)zyxwvutsrqponmlkjihgfedcbaZYXWVUTSRQPONMLKJIHGFEDCBA
J. Biol. Chem. 253, 149-159
Kang, C. H., Brautigan, D. L., Osheroff, N., and Margoliash, E.
(1978) J. Biol. Chem. 253,6502-6510
Ahmed, A. J., Smith, H. T., Smith, M. B., and Millett, F. S. (1978)
Biochemistry 17,2479-2483
Speck, S. H., Ferguson-Miller, S., Osheroff, N., and Margoliash, E. (1979) Proc. Natl. Acad. Sci. U. S. A . 76, 155-159
Osheroff, N., Brautigan, D. L., and Margoliash, E. (1980) J. Bwl. Chem. 255,8245-8251
Smith, M. B., Stonehuerner, J., Ahmed, A. J., Staudenmayer, N., and Millett, F. (1980) Biochim. Biophys. Acta 592,303-313 Konig, B. W., Osheroff, N., Wilms, J., Muijsers, A. O., Dekker,
H. L., and Margoliash, E. (1980) Febs Lett. 111,395-398 Speck, S. H., Koppenol, W. H., Dethmers, J. K., Osheroff, N.,
Margoliash, E., and Rajagopalan, K. V. (1981) J. Biol. Chem.
256, 7394-7400
Butler, J., Davies, D. M., Sykes, A. G., Koppenol, W. H., Osheroff, N., and Margoliash, E. (1981) J. Am. Chem. SOC. 103,469-471
Stellwagen, E. (1978) Nature 275, 73-74
Schmitz, K. S., and Schurr, J. M. (1972) J. Phys. Chem. 76,534-
545
15. Wilms, J. (1980) Doctoral dissertation, Chapt. 6, University of Amsterdam, Rodopi, Amsterdam
16. Veerman, E. C. I. (1981) Doctoral dissertation, Chapt. 4, Univer- sity of Amsterdam, Rodopi, Amsterdam
17. Capeillere-Blandin, C., Iwatsubo, M., Testylier, G. and Labeyrie,
F. (1980) in Flavins and Flauoproteins (Yagi, K., and Yamano, T., eds) pp. 617-630, University Park Press, Baltimore
18. Margoliash, E., Ferguson-Miller, S., Brautigan, D. L., and Chav- iano, A. H. (1976) in Structure-Function Relationships of Pro- teins (Markham, R., and Horne, R. w., eds) pp. 145-165, Else-
vier/North Holland, Amsterdam
19. Koppenol, W. H., Vroonland, C. A. J., and R. Braams (1978)
Biochim. Biophys. Acta 503,499-508
20. Ferguson-Miller, S., Brautigan, D. L., and Margoliash, E. (1979) in The Pophyrins (Dolphin, D., ed) Vol. VII, pp. 149-240, Academic Press, New York
21. Hayes, D. M., and Kollman, P. A. (1976) J. Am. Chem. SOC. 98, 3335-3345
22. Hayes, D. M., and Kollman, P. A. (1976) J. Am. Chem. SOC. 98,
7811-7817
23. Sheridan, R. P., and Allen, L. C. (1981) J. Am. Chem. Soe. 103,
24. Lavery, R., Pullman, A., and Pullman, B. (1980) Theor. Chim.
Acta 57,238-243
25. Koppenol, W. H. (1981) in Oxygen and Oxy-radicals in Chemistry and Biology (Powers, E. L., and Rodgers, M. A. J., eds) pp.
671-674, Academic Press, New York
26. Rieder, R., and Bosshard, H. R. (1980) J. Biol. Chem. 255,4732-
4739
27. Pettigrew, G . (1978) FEBS Lett. 86, 14-16
28. Brautigan, D. L., Ferguson-Miller, S., and Margoliash, E. (1978)
J. Biol. Chem. 253,130-139
29. Brautigan, D. L., Ferguson-Miller, S., Tarr, G . E., and Margoliash, E. (1978) J. Biol. Chem. 253,140-148
30. Koppenol, W. H., Ferguson-Miller, S., Osheroff, N., Speck, S. H., and Margoliash, E. (1982) in Oxidases and Related Redox
Systems (King, T. E., Mason, H. S., and Morrison, M. eds) Pergamon Press, Oxford, in press
31. Koppenol, W. H.,