DRAINAGE TIME OF POROUS ASPHALT MIXES DUE TO THE VARIOUS PROPORTION AND CONCENTRATION OF SOILS
ABSTRACTS
The function of porous pavement will be decreasing due to voids that are clogged by soil and dust. This condition is a common phenomenon until a certain period of time as this pavement has to be maintained by removing the trapped soil in voids. It is estimated that soil proportion, nominal maximum aggregate size and the cleansing method of trapped soil play a vital role in determining the loss of water drainage time. This paper presents the loss of drainage time based on the variety of soil proportions and concentrations. Drainage time after removing trapped soils from the voids of porous asphalt is also presented. There are three methods of removing the trapped soils from porous asphalt mix required tools such as a brush (k1), water sprayer (k2) and a vacuum cleaner (k3). The results showed that the proportion and concentration of soil used in this study influenced the loss of water drainage times. Drainage time value at the soil proportion of 85:15 is better than 57:43 proportions. This is verified by the decrease in drainage time value 2.6 and 1.9 times respectively when 25 grams and 10 grams soil were used. The equipment selection to remove trapped soil in voids of porous asphalt mix has to be considered. The vacuum cleansing method was found better compared to water sprayer and brush methods.
Keywords: Drainage time, porous asphalt, soils, proportion, concentration, voids.
INTRODUCTION
Porous asphalt (PA) is designed to have interconnected voids with high permeability. Water easily enters the pavement and is removed from the surface. The ability to transmit water through porous asphalt decreases with age. Researchers such as Nakanishi et al. (1995), Fwa et al. (1999), Bochove (1996) and Mallick et al. (2000) stated that a porous asphalt mix that became clogged up easily by dust and debris was not suitable for porous asphalt pavement. Local residual soils deposited from dirty wheels and vehicles carrying earth has been a major source of materials contributing to clogging of porous asphalt layers (Fwa et al., 1999).
In general, porous asphalt is more permeable compared to other types of asphalt mixes. This is due to porous asphalt mix that has an open gradation with a coarse aggregate proportion that is greater than the fine aggregate. From one perspective, the use of coarser aggregate can improve permeability value, but from another point of view, void in mix can be easily clogged by small materials such as particles and soils. When voids in porous asphalt mix are clogged, cleansing is required to remove small materials from voids so that porous asphalt mix can retain its permeability. According to Huber (2000), air voids decreased 3% to 4%, about one-fifth of initial voids after construction, but permeability dropped sharply. This condition was measured
during the first 5 years of service life. Next, Kraemer (1990) reported, the initial drainage times of porous asphalt surfacing in the range of 25 to 75 seconds had increased to 80 to 100 seconds after 3 years and to 160 to 400 seconds after 9 years.
The main objective and scope of this study was to determine the drainage time of porous asphalt mix due to the various proportion and concentration of soil. The investigation of drainage time based on the various cleansing methods of trapped soil in porous asphalt specimen is also presented. Soil used as clogging agent was obtained from two different sources which aimed at acquiring the various proportions and properties of soil. In order to determine the method of removing the trapped soils from porous asphalt mix required tools such as a brush (k1), water sprayer (k2) and a vacuum cleaner (k3). In this study, specimens used were porous asphalt mix made of three gradations, namely NMAS 20, 14 and 10 mm. All gradations used were based on the principles of packing theory.
RESEARCH METHOD
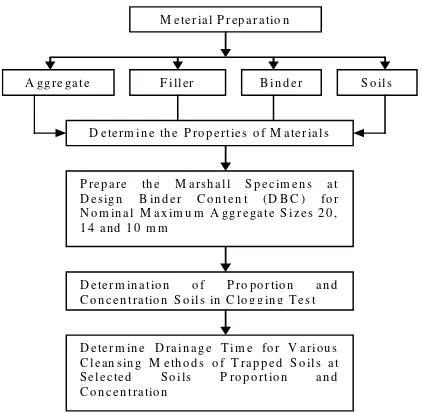
In order to minimize the mistakes of laboratory works in this investigation, all tests were carried out based on the established standards and procedures for experimentation highway pavement materials. The complete research design of this research is visualized in a flow chart as shown in Figure 1. Hardiman
Department of Civil Engineering, Syiah Kuala University Darussalam, Banda Aceh (23111)
Figure 1. Flow Chart of this Investigation
Material Used
Materials for Bituminous Mixes
Crushed aggregates used in this investigation were supplied by Kuad Quarry Sdn. Bhd. from Penang, Malaysia. The aggregate gradations adopted were developed based on the theory of aggregate packing. The detailed procedure used was an extension to the method presented in an earlier literature (Hardiman, 2004a). From this procedure, three gradations shown in Figure 2 that differs in terms of maximum aggregate sizes, were developed and tested. Each gradation incorporated a 2% hydrated lime filler.
Figure 2. Gradations Used in This Investigation
Binder used in this research was conventional binder (60/70 penetration). The design binder content (DBC) used to prepare specimens was based on the Cantabrian and binder drainage tests. From these tests, the design binder contents for conventional
binder corresponding to 10, 14 and 20 mm maximum aggregate size equal 5.4%, 5.0%, 4.5% (Hardiman, 2004b).
Clogging Agent
The material for clogging agent used was a clay silt soil combination, where more than 90% passed the 0.075 mm sieve. The soils were taken from Sungai Petani (designated as Soil A) and Sungai Kecil Hilir sites (designated as Soil B) in Kedah, Malaysia. The results of the dry sieve analysis and properties of soils A and B are shown in Table 1 (Hardiman, 2007).
Table 1. Gradation and Properties of Soil Used in this Investigation
Cumulative Percentage Passing (%)
Sieve Size (mm)
Soil A Soil B
2.36 1.18 0.60 0.30 0.15 0.075
100 99.9 99.7 99.4 99.0 98.6
100 87.5 75.7 64.4 56.8 53.1
Liquid Limit (%) 56.52 40.18
Plastic Limit (%) 35.52 27.74
Plasticity Index (%) 21.00 12.44
Specimen Preparation
In this clogging test, Marshall specimens were used. All porous asphalt specimen gradations used NMAS 20, 14 and 10 mm. In order to simplify the mix identification, the specimens were designated as SL. In front of SL, number 20, 14 and 10 were given to indicate the size of NMAS, as shown in Table 2.
Table 2. The Mix Designation of Porous Asphalt Specimens Used
NMAS (mm) Mix
Designation
20 14 10
Porous Asphalt 20SL 14SL 10SL
Clogging Test
The clogging test was developed at the highway engineering laboratory of the University Sains Malaysia (USM). This is a new experiment and 0
1 0 2 0 3 0 4 0 5 0 6 0 7 0 8 0 9 0 1 0 0
0 .0 1 0 .1 1 1 0 1 0 0
S ie v e S iz e ( m m )
C
u
m
u
a
ti
v
e
P
a
s
s
in
g
(
%
NM A S 1 0 NM A S 1 4 NM A S 2 0 M e te ria l P re p a ra tio n
A g g re g a te F ille r B in d e r S o ils
D e te r m in e th e P ro p e rtie s o f M a te ria l s
P re p a re th e M a rs h a ll S p e c im e n s a t D e s ig n B in d e r C o n te n t (D B C ) fo r N o m in a l M a x i m u m A g g r e g a t e S iz e s 2 0 , 1 4 a n d 1 0 m m
D e te r m in a tio n o f P ro p o rtio n a n d C o n c e n tra tio n S o ils in C lo g g in g T e s t
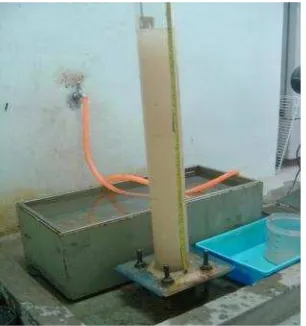
the equipments are shown in Figure 3. The permeability test for clogging evaluation begun after the sample had cooled overnight in its Marshall mould without extrusion.
Figure 3. Permeameter for Clogging Test
In this Investigation, the result of study is discussed to determine soil proportion and concentration used in clogging test. Three methods of cleansing that were used are also discussed and this includes using a brush, water sprayer and a vacuum cleaner.
The clogging test involves the following steps: 1) Determination of particle size distribution of
the soil which acts as the clogging agent. 2) Determination of the amount of soil required to
fill voids in the specimen.
3) Determination of a method to remove part of soils trapped or soils that clogged the specimen.
In determining the soil particle size distribution that acted as the clogging agent, trials were conducted on different combinations of Soils A and B. The selection of the right combined quantity was based on the time required to attain the minimum permeability which reflects the amount of soil filling up the voids. The minimum coefficient of permeability stipulated in the Korean standard for porous asphalt is 0.01 cm/sec (Darin Technology 2000), while the corresponding value from TRL is 0.03 cm/sec. In the clogging test, permeability was expressed in drainage time (second). The minimum requirement of permeability adopted in this research is 0.03 cm/sec or in drainage time was about 240 seconds (Hamzah and Hardiman, 2004). Here, drainage time was defined as the total of time required to flow 5 liters of water through a specimen. In this investigation, two permeant concentrations were prepared by dissolving 10 grams and`25 grams in 1 liter of water. The amount of soil
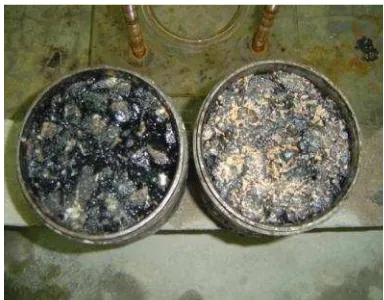
particle passing and retained by the specimens were also determined. Next, fresh water was used to determine the permeability of the clogged specimen. In order to determine the method of removing the trapped soils from porous asphalt mix required tools such as a brush (k1), water sprayer (k2) and a vacuum cleaner (k3), as shown in Figures 4-6. The method selected was based on the highest permeability. The permeability test for clogging began after the sample had cooled overnight. Then, the specimen was tested for permeability and the value was used as a reference point to indicate the highest achievable permeability for unclogged specimens for comparative purposes. Figure 7 shows the specimen condition before and after clogging test.
Figure 4. Cleansing by a Brush
Figure 5. Cleansing by Water Sprayer
Figure 7. Specimen Condition before and after Clogging by Using Solis
Tests were carried out to determine a suitable permeant concentration. Soil concentrations ranging from 1.0 grams to 2.0 grams/liter were used. For this step, the procedure involved removing trapped soil using a vacuum cleaner. The vacuum cleaner used was a German fabrication, type 786/B. The model of this equipment is INOX 30 Professional with 220-240 V, 50/60 Hz, and 1400 watt. There were no particular specifications for brush and water sprayer methods. The common painting brush with 25.4 mm wide and PVC pipe water sprayer with 12.5 mm diameter were used. The duration of spraying, brushing and vacuuming for each specimen was 15 seconds.
The procedure of clogging test is summarized underneath:
1) Perform the initial permeability on virgin sample (without clogging agent).
2) Mix soil with water (gram/liter) and stirred vigorously for several minutes.
3) Pour soil-water mixes into the permeameter and clog the specimen.
4) Determine sample permeability using fresh water. However, some soils remain trapped in the voids.
5) Repeat steps 3 and 4 until the minimum permeability is attained.
6) Leave specimen to dry overnight, then remove the soil from specimen by using some methods: sprayer water, a brush and a vacuum cleaner.
7) Carry out permeability test by using the fresh water as permeant.
In the analysis, the coefficient of permeability values were not calculated but the permeability was indicated by the value of time taken for water to drop between two designated points on the permeameter.
RESULTS AND DISCUSSION
Determination of Soil Proportion for Clogging Test
Before soil could be used as a clogging test material, an investigation on soil distribution and plasticity index were performed. The results of the sieve analysis and properties for soils A and B are shown in Table 1. In Soil A, 100% passes the 2.36 mm sieve while 97.8% passes the 0.075 mm sieve. For Soil B, the corresponding values are 100% and 46.9%. The results indicated that soil A was finer than soil B. Preliminary investigation showed that the specimen had clogged in for a short time when only Soil B was used as a clogging agent. It took a longer time to clog the specimen when Soil B was used because Soil B was coarser compared to Soil A. It is therefore necessary to select the most suitable combinations of both soils so that the rate of clogging is acceptable.
Clogging test was performed using two combinations of Soil A and Soil B proportion. The first combination was 57% soil A: 43% soil B and the second combination was 85% soil A: 15% soil B. Both combinations were selected to produce two types of soil proportions at 0.075 sieve, namely less than 90% and above 90%. The gradation of the soil combinations are shown in Table 3. Total soil used was 10 grams and 25 grams. The value of drainage time and total soil trapped in porous asphalt mix are shown in Tables 4 and 5.
Table 3. Two Combinations of Soil Used in this Investigation
Soil Combination
I
Combination II Sieve
(mm) A B 57%
A 43%
B Total
(%) 85%
A 15%
B Total
(%)
2.36 100 100 57.0 43.0 100 85.0 15.0 100
1.18 99.5 94.2 56.7 40.5 97.2 84.6 14.1 98.7
0.6 99.2 84 56.5 36.1 92.7 84.3 12.6 96.9
0.3 98.8 67.4 56.3 29.0 85.3 84.0 10.1 94.1
0.15 98.2 52.4 56.0 22.5 78.5 83.5 7.9 91.3
Table 4. The Drainage Time for Various Amount and Soil Proportion
Drainage Time (sec) NMAS
(mm) Without
soil
at 10 g soil
at 25 g soil Soil Proportion (%) 20 14 10 44.5 54 54.9 101 210 380 655 865 1360
Average 51.1 230.3 960
Soils A 57 Soils B 43
20 14 10 43 54.1 56.1 84 135.4 151 387 394 310
Average 51.1 123.5 363.7
Soils A 85 Soils B 15
Table 5. Amount of Soil in Specimen Voids at Various Soil Proportions
Soils (g) NMAS
(mm)
Total Retained Passing Trapped
in voids Soil Proportion (%) 20 14 10 25 25 25 4.8 7.4 13.1 8.6 7.6 2.8 11.6 10 9.1
Average 25.0 8.4 6.3 10.2
Soils A 57 Soils B 43
20 14 10 25 25 25 0.5 2.2 3.4 17 12.1 10 7.5 10.7 11.6
Average 25.0 2.0 13.0 9.9
Soils A 85 Soils B 15
Table 4 shows the drainage time results as a consequence of clogging specimen using varying proportions of Soils A and B. When both soils were combined in 57:43 ratios, the permeability fell below the minimum value. At this combination the percentage passing 0.075 mm sieve is 75.9% and it easily clogged the specimen. However, the drainage time as a consequence of adding 25 grams is higher compared to addition of 10 grams soil. The average drainage time increased 4.5 and 19.2 times respectively when the quantity of soil used was increased from 10 to 25 grams.
Next, the proportion was changed to 85:15. The results from this proportion show that the drainage time was lower and the percentage passing the 0.075 mm sieve was 90.1%. This proportion results show that the drainage time was lower and the percentage passing the 0.075 mm sieve was 90.1%. It is found that using both proportions, the amount of trapped soil is approximately 10 grams as shown in Table 5. Therefore, the maximum mass of soil to be used as permeant should be at a maximum of 10 grams when the proportion of Soil A and B is 85:15.
At this proportion, drainage time increased 2.4 to 7.1 times when the quantity of soil used was increased from 10 to 25 grams. From the clogging test results shown in Table 4, the ability of a specimen to trap soils increases when the maximum aggregate size decreases. However, drainage time value at the soil proportion of 85:15 is better than 57:43 proportions. This is verified by the decrease in drainage time value 2.6 and 1.9 times respectively when 25 grams and 10 grams soil were used.
Determination of Soil Concentration for Clogging Test
Based on the soil proportion obtained, the preliminary study was extended to soil concentration in clogging test. Soil concentration was defined as the total of soil in one liter of water and the normal unit used is gram/liter. When the concentration was bigger, the specimen tended to clog easily. The delay in clogging of porous asphalt mix is determined by the quantity of soil loading in asphalt mix. The porous asphalt mix was considered clogged when loading time reached 240 seconds. At that time, porous asphalt was no longer able to function as a permeable layer. For this clogged porous asphalt layer to remain functional, the cleansing of soil and other small particles that were trapped in mix void was required.
Preliminary trials were again conducted using 10 grams soil. The soil was mixed in 5 liters of water which is the volume of the permeameter tube and was equivalent to 2.0 grams/liter of concentration. The preliminary tests were conducted only on mixes with NMAS 20 mm prepared with base bitumen. The results are displayed in Table 6.
Table 6. Time of Soil Loading of Specimen at Two Soil Concentrations
Time of Soil Loading (s) Soil
Concentra tion
(g/liter) to t1 t2 t3 t4 t5 t6 t7
1.0 2.0 58 58 74 191 86 239 107 -118 -134 -116 -167
Determination of Soil Removal Methods from Specimen
After the trapped soil in the specimen of porous asphalt mix had removed, the drainage time was observed. In this test, Soil A and soil B combined in the ratio 85:15. Therefore, mass soil to be used as permeant should be at 10 grams to be dissolved in 5 liters of water.
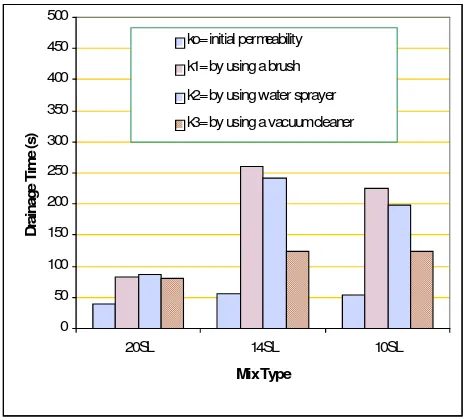
The drainage time of PA mix is shown in Figure 8. Figure 8 shows the drainage time of PA mix using various trapped soil removal methods. It appears that the drainage time after removing soil from specimen is only 116.5% of the initial permeability when a vacuum cleaner is used. Nevertheless, when water sprayer and brushing is used, the corresponding values are 236.8% and 260.4%, respectively. The results illustrate that drainage time after specimen was cleansed using vacuum cleaner is closer to the initial drainage time. In other words, the loss of drainage time was smaller. This indicates that the vacuum cleaner removed more trapped soil from specimen compared to other methods and is adopted in future investigations. However, the mixes made of NMAS 20 mm has the lowest drainage time for all methods used.
Figure 8. Drainage Time after Removal Soils by Using Various Methods at PA Mixes
CONCLUSION
This paper is based on a number of investigations of porous development and it can be concluded that:
1. The proportion and concentration of soil used in this study influenced the water drainage time. Drainage time value at the soil proportion of 85:15 is
better than 57:43 proportions. This is verified by the decrease in drainage time value 2.6 and 1.9 times respectively when 25 grams and 10 grams soil were used.
2. The equipment selection to remove trapped soil in voids of porous asphalt mix has to be considered. The vacuum cleansing method was found better compared to water sprayer and brush methods. However, in clogging test, the combination of water sprayer and vacuum cleaner were used, which the selection of this combination simulates actual field activities to clean porous asphalt.
ACKNOWLEDGEMENT
The data used in this paper was based on a research project on porous asphalt, which funded by the IRPA Grant, the Ministry of Science, Technology and Innovation, Malaysia. Thanks are also extended to the University of Science Malaysia for its facilities and Associate Professor Dr. Meor Othman Hamzah as the Project Leader.
REFFRENCES
Bochove, V.G.G. (1996). Twinlay, a new concept of drainage asphalt concrete. Proceedings of 1st Euroasphalt and Eurobitume Congress, Strasbourg, France, May 7-10, 1996.
Darin Technology (2000). The performance improvement of hot mix asphalt and enhanced applicability to pavement structure thickness design using DAMA (drain asphalt modified additive), Available at:
http://www.library.uq.edu.au/training/citation/ harvard.html
Fwa, T.F., Tan, S.A. and Guwe, Y.K. (1999). Laboratory evaluation of clogging potential of porous asphalt mixtures. Journal of the Transportation Research Board (TRB), No. 1681, pp. 43-49.
Hamzah M.O and Hardiman (2004). Proposed impact compaction procedure for double layer porous asphalt specimens. Proceedings of Malaysian Universities Transport Research Forum Conference MURTF 2004, Universiti Teknologi Mara, Selangor, Malaysia, 1-2 December 2004
Hardiman (2007). Engineering properties and clogging behaviour of double layer porous asphalt. PhD Thesis, Universiti Sains Malaysia (Unpublished)
Hardiman (2004a). Application of packing theory on design grading for porous asphalt mixtures. Journal of Dimensi Teknik Sipil, Univ. Kristen
0 50 100 150 200 250 300 350 400 450 500
20SL 14SL 10SL
Mix Type
D
ra
in
ag
e
T
im
e
(s
)
ko= initial permeability
k1= by using a brush
k2= by using water sprayer
Petra, Surabaya, Indonesia, September 2004, Vol. 2.
Hardiman (2004b). Application of cantabrian and binder drainage tests in designing of porous asphalt binder content.Journal of Forum Studi Transportasi antar Perguruan Tinggi, Volume 4 No. 2, Bandung, Indonesia, Desember 2004. Huber G. (2000). Performance survey on
open-graded friction course mixes. National Co-Operative Highway Research Program, Synthesis of Highway Practice 284, Transportation Research Board, National Academy Press, Washington DC.
Kraemer, C. (1990). Porous asphalt surfacing in Spain. Proceedings of International
Symposium on Highway Surfacing, University of Ulster.
Mallick, R. B., Kandhal, P.S., Cooley, L.A. and Watson, D.E. (2000). Design, construction and performance of new generation open-graded friction course. Journal of the Association of Asphalt Paving Technologist, Vol. 69, pp. 391-423.