ABSTRACT
DANI ARDIYANTO. A Space-time Permutation Scan Statistic for Measles Disease Hotspots Detection in West Java. Under the advisory of ASEP SAEFUDDIN and BAGUS SARTONO.
In this research, scan statistic was implemented to detect clusters in a point process. The scan statistic can be applied on wide area of interest, one of them are on disease area clustering. The ability in performing disease surveillance without population-at-risk data is important in developing countries, where these data may be hard to be obtained.
This paper presents the application of the scan statistic in order to detect measles disease hotspots in West Java Province. Unlike the spatial scan statistic, space-time permutation scan statistic not only detects the location of the significant hotspot cluster but also identifies its occurrence. Further, the space-time permutation scan statistic can be implemented when the population-at-risk is unavailable. This method creates a large number of permutations of the spatial and temporal attributes of each dataset to get the expected number of cases, with the underlying assumption that the probability of a case being in an area z, given the observed d, is equal. The test statistic was based on likelihood ratio test and evaluated using Monte Carlo hypothesis testing.
The research used aggregated measles disease case in West Java districts obtained from Statistics Indonesia Potensi Desa (Podes) year 2003 and 2006. They were twelve detected measles hotspots in West Java during year 2003 and 2006, which only four of them were significant. The highest log-likelihood ratio values, the most likely cluster (MLC), happened in Cirebon in 2006 time frame.
A SPACE-TIME PERMUTATION SCAN STATISTIC
FOR MEASLES DISEASE HOTSPOTS DETECTION IN WEST JAVA
DANI ARDIYANTO
DEPARTMENT OF STATISTICS
FACULTY OF MATHEMATICS AND NATURAL SCIENCES
BOGOR AGRICULTURAL UNIVERSITY
This thesis is dedicated to my father and my mother.
You’ll always have a place within my heart.
I Love You.
ABSTRACT
DANI ARDIYANTO. A Space-time Permutation Scan Statistic for Measles Disease Hotspots Detection in West Java. Under the advisory of ASEP SAEFUDDIN and BAGUS SARTONO.
In this research, scan statistic was implemented to detect clusters in a point process. The scan statistic can be applied on wide area of interest, one of them are on disease area clustering. The ability in performing disease surveillance without population-at-risk data is important in developing countries, where these data may be hard to be obtained.
This paper presents the application of the scan statistic in order to detect measles disease hotspots in West Java Province. Unlike the spatial scan statistic, space-time permutation scan statistic not only detects the location of the significant hotspot cluster but also identifies its occurrence. Further, the space-time permutation scan statistic can be implemented when the population-at-risk is unavailable. This method creates a large number of permutations of the spatial and temporal attributes of each dataset to get the expected number of cases, with the underlying assumption that the probability of a case being in an area z, given the observed d, is equal. The test statistic was based on likelihood ratio test and evaluated using Monte Carlo hypothesis testing.
The research used aggregated measles disease case in West Java districts obtained from Statistics Indonesia Potensi Desa (Podes) year 2003 and 2006. They were twelve detected measles hotspots in West Java during year 2003 and 2006, which only four of them were significant. The highest log-likelihood ratio values, the most likely cluster (MLC), happened in Cirebon in 2006 time frame.
A SPACE-TIME PERMUTATION SCAN STATISTIC
FOR MEASLES DISEASE HOTSPOTS DETECTION IN WEST JAVA
BY:
DANI ARDIYANTO
G14103029
Thesis
For the Degree Bachelor of Science
Department of Statistics
DEPARTMENT OF STATISTICS
FACULTY OF MATHEMATICS AND NATURAL SCIENCES
BOGOR AGRICULTURAL UNIVERSITY
Title :
A SPACE-TIME PERMUTATION SCAN STATISTIC FOR
MEASLES DISEASE HOTSPOTS DETECTION IN WEST JAVA
Name : Dani Ardiyanto
NRP : G14103029
Approved by:
Advisor I,
Dr. Ir. Asep Saefuddin, M.Sc
NIP. 130938261
Advisor II,
Bagus Sartono, M.Si
NIP. 132311923
Acknowledged by:
Dean of Faculty of Mathematics and Natural Sciences
Bogor Agricultural University
Dr. Drh.Hasim, DEA
NIP 131578806
BIOGRAPHY
Author was born in Bogor, July 17th, 1985, as the first of two children of Arief Murdiman and Siti Rodiyah.
In 1997, author graduated from SD Negeri Cibuluh 1 Bogor, and then continued his study at SLTP Negeri 1 Bogor and graduated in 2000. Author finished his study at SMU Negeri 1 Bogor in 2003, and then was accepted as a student at Department of Statistics, Faculty of Mathematics and Natural Sciences, Bogor Agricultural University, in the same year through USMI (Undangan Seleksi Masuk IPB).
During his study, author joined Himpunan Keprofesian Gamma Sigma Beta as a staff of
Departemen Olahraga dan Seni in 2004/2005. Author also became the lecturer assistant of
PREFACE
All praise and gratitude for Allah SWT, God of the Universe, for all the blessing and kindness that made me able to finished my thesis, with the title “A Space-Time Permutation Scan Statistic for Measles Disease Hotspots Detection in West Java”. There are a lot of knowledge, lessons, experiences, advices and valuable critics during the process of my research, so hereby I would like to express my grateful to:
1. Dr. Ir. Asep Saefuddin, M.Sc and Bagus Sartono, M.Si for the early motivation, discussions, advices, supports, and their great enthusiasm.
2. Lecturers and staffs at Department of Statistics, for the sharing their knowledge and technical supports.
3. Martin Kulldorff and Ganapati Pawan Patil for their correspondence and supports. 4. My beloved family for the eternal pure loves.
5. Pramesti Puspitasari, untiringly shower me with lots of love and care.
6. The people of Palladium (Rio, Edo, Arif, Yudi, Ipunk, Daus, Bayu), Puri 9 (Meinalisa, Indri, Dina), and Batosai (Deni, Adit, Agus) who always make me feel welcome.
7. The big family of Department of Statistics.
8. And everyone that helps me in this study, which can not be named personally.
This thesis is not perfect, to make this thesis useful to everybody, I am expecting the critics, advises, and recommendations to people who read my thesis. Thank You.
Bogor, January 2008
CONTENTS
Page
LIST OF TABLES ...v
LIST OF APPENDICES ...vi
INTRODUCTION Background ...1
Objective ...1
DEFINITIONS Measles...1
Hotspot ...1
Scan Statistic ...1
Space-time Permutation Scan Statistic ...2
Relative Risk ...2
Likelihood Ratio Test ...2
Monte Carlo Hypothesis Testing ...3
MATERIALS AND METHODS Data Sources...3
Methods ...3
RESULTS AND DISCUSSION West Java...4
Detected Hotspots...4
Significant Hotspots ...5
CONCLUSION ...6
SUGGESTIONS ...6
REFERENCES...7
LIST OF TABLES
Page
1. Top Ten Districts of Measles Case ...4
2. Pearson Correlation of Measles Case 2003 and 2006 ...4
3. Description of the Detected Hotspots...4
4. Summary of the First Significant Hotspots ...5
5. Summary of the Second Significant Hotspots...5
6. Summary of the Third Significant Hotspots ...5
LIST OF APPENDICES
Page
1. 2003 Measles Case Thematic Map ...9
2. 2006 Measles Case Thematic Map ...9
3. SaTScan Software Output ...10
4. Summary of the Detected Clusters...15
INTRODUCTION
Background
There is a long history of geographical surveillance of disease by publishing disease atlases. If there are areas with exceptionally high rates, they may give the clues to the etiology of the disease, indicating areas where health care needs to be improved, or to be targeted for preventive measures. Implementing scan statistic, we can do the surveillance of particular disease on particular area. This study applied retrospective space-time permutation scan statistic to construct measles disease surveillance in West Java.
According to the World Health Organization (WHO), vaccination rate has been high enough to make measles relatively uncommon in developed countries, but in developing countries it is still common. Globally, measles deaths went down 60 percent, from an estimated 873,000 deaths in 1999 to 345,000 in 2005. Africa has been the most success area, with annual measles deaths falling by 75 percent in just 5 years, from an estimated 506,000 to 126,000 (UNICEF World Press Release in Wikipedia, 2007).
The ability in detecting measles outbreaks early is important in order to minimize morbidity and mortality through timely implementation of measles prevention and control measures. A scan statistic can be used widely in any field to recognize any significant hotspot in terms to find any spatial areas that have elevated risk than their surroundings.
In space-time, the scan statistic can provide early warning of disease outbreaks and can monitor their spatial spread. This study using a retrospective space-time permutation scan statistic for detecting measles disease hotspot in West Java that utilized only case numbers, with no need for population-at-risk data, where these data are very difficult or irrelevant to be obtained.
This method was applied on annual data of measles disease cases in West Java in 2003 and 2006 periods.
Objective
The objective of this study is to detect measles disease hotspots in West Java in order to reveal its outbreaks using historical data of
Podes 2003 and 2006, where the detected hotspots indicated to be taken care due to the condition of health care and preventive measures action must be conducted.
DEFINITIONS
Measles
Measles, also called rubeola, is a highly contagious - but rare - respiratory infection that is caused by a virus. It causes a total-body skin rash and flu-like symptoms, including a fever, cough, and runny nose.
Measles is spread through respiration (contact with fluids from an infected person's nose and mouth, either directly or through aerosol transmission). About 90% of people without immunity sharing a house with an infected person will catch it. Airborne precautions should be taken for all suspected cases of measles. The incubation period usually lasts for 4–12 days (during which there are no symptoms). Infected people remain contagious from the appearance of the first symptoms until 3–5 days after the rash appears (Wikipedia, 2007).
Hotspot
Hotspot is defined as something unusual, anomaly, aberration, outbreak, elevated cluster, critical area, etc (Patil and Taillie, 2004).
Hotspot clusters were generated by setting the relative risk in some counties to be larger than one (Song and Kulldorff, 2003).
Hotspots are locations or regions that have consistently high levels of disease and may have characteristics unlike those of surrounding areas (Haran, Molineros, & Patil, 2006 in Septiani, 2006).
Scan Statistic
First studied by Naus in 1965, the scan statistic is an elegant way to solve problems of multiple testing when there are closely overlapping spatial areas and/or time intervals being evaluated. Temporal, spatial, and space– time scan statistic are now commonly used for disease cluster detection and evaluation, for a wide variety of diseases.
Space-Time Permutation Scan Statistic
The space–time permutation scan statistic utilizes thousands or millions of overlapping cylinders to define the scanning window, each being a possible candidate for an outbreak. The circular base represents the geographical area of the potential outbreak.
A typical approach is to first iterate over a finite number geographical grid points and then gradually increase the circle radius from zero to some maximum value defined by the user, iterating over the areas in the order in which they enter the circle. In this way, both small and large circles are considered, all of which overlap with many other circles.
The height of the cylinder represents the times. For each center and radius of the circular cylinder base, the method iterates over all possible temporal cylinder lengths. This means that we will evaluate cylinders that are geographically large and temporally short, forming a flat disk, those that are geographically small and temporally long, forming a pole, and every other combination in between.
What is new with the space–time permutation scan statistic is the probability model. Since we do not have population-at-risk data, the expected must be calculated using only the cases. Suppose we have annually case counts for z areas, where czd is the observed number of cases in area z during time d. The total number of observed cases (C) is
∑∑
=
z d zdc
C
…(1)For each area and time, we calculate the expected number of cases μzd conditioning on
the observed marginals:
⎟
⎠
⎞
⎜
⎝
⎛
⎟
⎠
⎞
⎜
⎝
⎛
=
∑
∑
d zd z zdzd
c
c
C
1
μ
…(2)In words, this is the proportion of all cases that occurred in area z times the total number of cases during time d. The expected number of cases μA in a particular cylinder A is the
summation of these expectations over all the area-time within that cylinder:
∑
∈=
A d z zd A ) , (μ
μ
…(3)The underlying assumption when calculating these expected numbers is that the probability of a case being in area z, given that it was observed on time d, is the same for all times d.
Let cA be the observed number of cases in the cylinder. Conditioned on the marginals, and
when there is no space–time interaction, cA is distributed according to the hypergeometric distribution with mean μA and probability
function (Kulldorff, 2005):
⎟
⎟
⎠
⎞
⎜
⎜
⎝
⎛
⎟
⎟
⎟
⎠
⎞
⎜
⎜
⎜
⎝
⎛
−
−
⎟
⎟
⎠
⎞
⎜
⎜
⎝
⎛
=
∑
∑
∑
∑
∈ ∈ ∈ ∈ A d zd A d A zd A z zd A A z zd Ac
C
c
c
C
C
c
c
C
P
(
)
…(4)The space-time scan statistic may be used for either a single retrospective analysis or for time-periodic prospective surveillance. In a retrospective analysis, the analysis is done only once for a fixed geographical region and a fixed study period, evaluating both ‘alive’ clusters, lasting until the study period and date, as well as ‘historic clusters’ that ceased to exist before the study period end date. The prospective option is used for the early detection of disease outbreaks, when analyses are repeated every day, week, month or year. Only alive clusters, clusters that reach all the way to current time as defined by the study period end date, are then searched for.
This study using the retrospective space-time scan statistic since the research only done once in West Java Province in 2003 and 2006.
Relative Risk
The relative risk, any non-negative number, representing how much more common event (case) is in this location compared to the baseline. Setting a value of one is equivalent of not doing any adjustments. A value of greater than one is used to adjust for an increased risk and a value of less than one to adjust for lower risk. A relative risk of zero is used to adjust for missing data for that particular location. Relative risk is calculated simply by dividing observed number to its expected (Kulldorff, 2006).
Likelihood Ratio Test
For each location and size of the scanning window, the alternative hypothesis is that there is an elevated risk within the window as compared to outside. When both
∑
and∈A z zd
c
∑
∈A d zdc
are small compared to C, cA isPoisson generalized likelihood ratio (GLR) as a measure of the evidence that cylinder A
contains an outbreak:
( )
( )
I
C
c
C
c
A C cAA A c A A −
⎟⎟
⎠
⎞
⎜⎜
⎝
⎛
−
−
⎟⎟
⎠
⎞
⎜⎜
⎝
⎛
μ
μ
…(5)In words, this is the observed divided by the expected to the power of the observed inside the cylinder, multiplied by the observed divided by the expected to the power of the observed outside the cylinder. I() is an indicator function. When the objective of this study is set to scan only for clusters with high rates, I() is equal to 1 when the window has more cases than expected under the null-hypothesis, and 0 otherwise. The opposite is true when the objective of the study is set to scan only for clusters with low rates. When the study scans for clusters with either high or low rates, then I()=1 for all windows.
The likelihood function is maximized over all window locations and sizes, and the one with the maximum likelihood constitutes the most likely cluster. This is the cluster that is least likely to have occurred by chance. The likelihood ratio for this window constitutes the maximum likelihood ratio test statistic (Kulldorff, 2006).
Monte Carlo Hypothesis Testing
Once the value of test statistic calculated, it is easy to do the inference. We cannot expect to find the distribution of test statistic in closed analytical form. Instead we rely on Monte Carlo hypothesis testing.
With Monte Carlo hypothesis test, the statistical significance of an observed test statistic calculated from a set of data that assessed by comparing it with a distribution obtained by generating alternative set of data from some assumed model. If the assumed model implies that all data orderings are equally likely then this amounts to a randomization test with random sampling of the randomization distribution.
Monte Carlo hypothesis testing using in scan statistic consist of four steps procedure: 1. Calculate the value of the test statistic for
the real data.
2. Create a large number of random data sets under the null hypothesis.
3. Calculate the value of test statistic for each random replication.
4. Sort the value of test statistic in step 3 (simulation data), then compare it with the value of test statistic in step 1 (real data). If
value of test statistic for real data ranked in the highest α percent of value of test statistic for simulation data, then reject the null hypothesis at α percent significance level.
On the other hand, p-value can be denoted by p-value = rank /(1 + number of simulation generated) (Kulldorff, 1999).
MATERIALS AND METHODS
Data Sources
This study used secondary data of measles disease cases in West Java obtained from 2003 and 2006 of Potensi Desa (Podes) surveys by Statistics Indonesia.
Methods
During the completion of this study, several steps were done as mentioned below: 1. Merging the 2003 and 2006 measles case
in West Java districts using SAS 9.1. 2. Generating any possible scan windows
with the maximum spatial cluster size was 10% of population and maximum temporal cluster size was 1 year.
3. Calculating the relative risk of each scanned window mentioned on step 2, and then discarding the window with relative risk less than 1.
4. Calculating the likelihood function value of each scanned window obtained at step 3.
5. Obtaining the statistical significant value for each hotspot candidate using Monte Carlo simulation with 9999 replications. 6. Interpreting the results and presenting the
hotspot area on West Java map using MapInfo Professional 7.8 SCP.
This study use SaTScan 7.0 to perform step 2 to 5.
The size of spatial and temporal window can vary up to 50% of the total study area or time. Subjectively, the value of the spatial window was set up to 10% of the total West Java area and the value of temporal window was set up to 50% of the total two-year period of study, 2003 and 2006. Before the value of the spatial window was set to 10%, this research had tried the different maximum spatial windows, of 5%, 15%, 25%, and 50%. The value of maximum temporal window cannot be changed, because this research only involved two points of time.
area study, because when it was allowed to expand more, the likelihood no longer reflects a cluster of increased disease risk inside, but a decreased risk outside.
RESULTS AND DISCUSSION
West Java
According to Podes data from Statistic Indonesia, West Java Province consists of 18 regencies/municipalities, divided into 507 districts in 2003 and 547 districts in 2006. The observed measles cases in this study period was 349 and 231 in 2003 and 2006 respectively, thus the total cases is 580 cases. It means that the case was decreasing between 2003 and 2006, perhaps could be considered as an indicator that West Java Province carried out some improvement on public health service.
The top ten districts on measles case number could be seen on the Table 1. The number in parentheses reflects the case of the corresponding districts. More simultaneously information about the spread of the measles case can be reviewed by thematic map at the Appendix 1 and 2.
Table 1. Top Ten Districts on Measles Case.
No 2003 2006
1 Ciawi Bogor (13) Cikarang (11) 2 Talaga (11) Mundu (11) 3 Megamendung(10) Beber (7) 4 Garutkota (7) Cisurupan (6) 5 Situraja (7) Jatitujuh (6) 6 Cibarusah (6) Bekasi Selatan (5) 7 Cidaun (6) Cidaun (5) 8 Juntinyuat (6) Kadungora (5) 9 Krangkeng (6) Banjarwangi (4) 10 Waled (6) Cibuaya (4)
The relationship degree of measles case during two year period in each region of West Java is shown on the Table 2. This table was obtained after dividing West Java region into 4 non-overlapping areas and calculating the Pearson correlation between 2003 and 2006 measles case in each area.
The correlation values were all significant although the relationship between the 2003 and 2006 measles case data seems too weak, because the Pearson correlation values tend close to zero. This means that if there is an excess measles case in certain area, the chance
of the excess still remains in that area is very small because the tendency is weak.
Table 2. Pearson Correlation of Measles Case 2003 and 2006.
Area Correlation P-value
North 0.13 0.050
South 0.17 0.014
West 0.14 0.042
East 0.15 0.028
Overall 0.14 0.003
After doing some adjustment conditioned on the West Java digital map limitation, the number of district in the area of study decrease to only 442 districts. Hence, this study only search cluster within districts registered on existing digital map. Using SaTScan software, the calculations for the retrospective space-time permutation scan statistic on 800 MHz PC with 384 MB of RAM took 11 minutes and 15 seconds. The output of the software can be reviewed at Appendix 3.
Hotspot Candidates
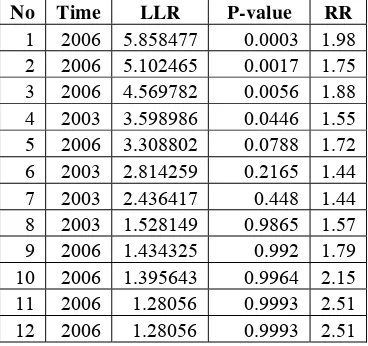
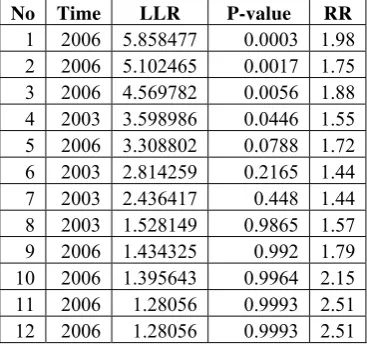
After applying the retrospective space-time permutation scan statistic with ten percent of maximum spatial size window and 9999 Monte Carlo replications, there are twelve measles disease hotspots detected. All of them have the relative risk value greater than one since the objective of the study is to search clusters with the high rates of measles case. Only four of them were significant at five percent significance level. Appendix 4 shows the summary of these hotspot candidates.
Table 3. Description of Detected Hotspots.
No Time LLR P-value RR
Significant Hotspots
From twelve detected hotspots with high rates of measles case, only four of them were significant at five percent significance level. Three of them happened in 2006 time frame.
The first significant hotspot located in Cirebon with radius 11.77 kilometers, and contains 15 districts. The number of observed case in this cluster was 1.98 times higher than the expected. It means that the risk of a case within this cluster is 1.98 times higher than the risk the outside. The cases increase from 8 in 2003 to 30 in 2006, and the correlation was 0.36. The correlation p-value indicates that there was no correlation between 2003 and 2006 measles data within this cluster, on the other words there was no linear relationship between them.
Having highest value of log likelihood ratio among all, this cluster made itself to be the most significant, so called the most likely cluster. This cluster always has the highest test statistic and hence, the smallest p-value. All clusters excluding the most likely cluster considered as the secondary clusters. The summary of the Hotspot 1 can be reviewed on Table 4.
Table 4. Summary of the first significant hotspot.
Coordinates 6.7195 S, 108.4952 E
Radius 11.77 km
# district 15
Time frame 2006/1/1 - 2006/12/31
Number of cases 30
Expected cases 15.13
Observed/expected 1.982
Test statistic 5.858477
Monte Carlo rank 3/10000
P-value 0.0003
Case 2003 8
Case 2006 30
Correlation 0.365962527
Correlation p-value 0.18
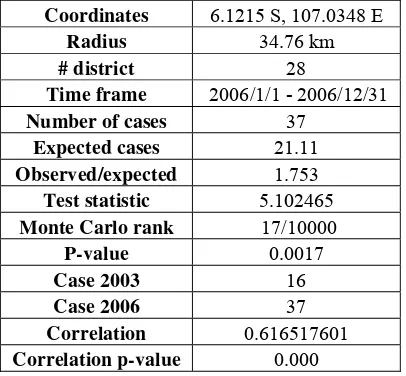
The second significant hotspot located in Bekasi. The observed measles case in 2006 was 37, meanwhile the expected was 21.11. This number shows that in this cluster has the observed case 1.75 times higher than expected. The number of district in this cluster was 28, spread across 34.76 kilometers from the cluster centroid. The relationship between 2003 and 2006 measles case data within this cluster seems to be strong. It can be seen from the
correlation value, this value was significant, rejects the null hypothesis of no correlation. It means the districts inside this cluster might have constant increase or growth of measles case from year to year, since the correlation value was positive. The relationship showed by the correlation value might be interest to be examined in further study. The simple review of hotspot 2 can be found on the Table 5.
Table 5. Summary of the second significant hotspot.
Coordinates 6.1215 S, 107.0348 E
Radius 34.76 km
# district 28
Time frame 2006/1/1 - 2006/12/31
Number of cases 37
Expected cases 21.11
Observed/expected 1.753
Test statistic 5.102465
Monte Carlo rank 17/10000
P-value 0.0017
Case 2003 16
Case 2006 37
Correlation 0.616517601
Correlation p-value 0.000
The third significant hotspot located in Western Bandung, The observed case higher 1.88 times than its expected, constitutes the relative risk of the cluster. This cluster paced in the top 56 from 9999 Monte Carlo replications, make it significant with p-value 56/(9999+1) or 0.0056. In 2006, the case was 27, higher than the case in 2003. It made this cluster occurs in 2006 time frame. The summary of this cluster depicted on the Table 6.
Table 6. Summary of the third significant hotspot.
Coordinates 6.8404 S, 107.2244 E
Radius 31.13 km
# district 30
Time frame 2006/1/1 - 2006/12/31
Number of cases 27
Expected cases 14.34
Observed/expected 1.883
Test statistic 4.569782
Monte Carlo rank 56/10000
P-value 0.0056
Case 2003 9
Case 2006 27
Correlation 0.162724749
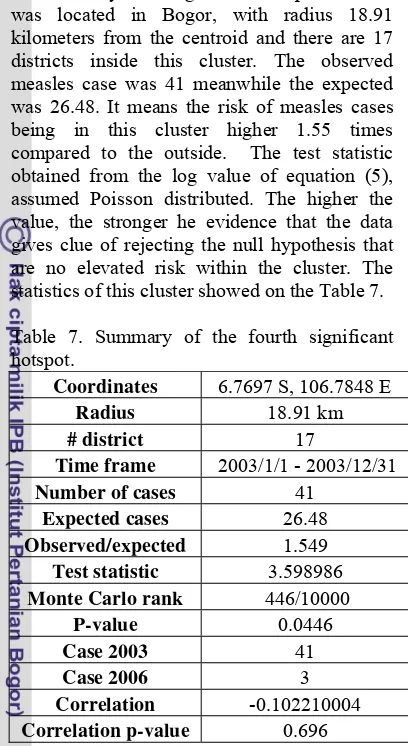
The only 2003 significant hotspot detected was located in Bogor, with radius 18.91 kilometers from the centroid and there are 17 districts inside this cluster. The observed measles case was 41 meanwhile the expected was 26.48. It means the risk of measles cases being in this cluster higher 1.55 times compared to the outside. The test statistic obtained from the log value of equation (5), assumed Poisson distributed. The higher the value, the stronger he evidence that the data gives clue of rejecting the null hypothesis that are no elevated risk within the cluster. The statistics of this cluster showed on the Table 7.
Table 7. Summary of the fourth significant hotspot.
Coordinates 6.7697 S, 106.7848 E
Radius 18.91 km
# district 17
Time frame 2003/1/1 - 2003/12/31
Number of cases 41
Expected cases 26.48
Observed/expected 1.549
Test statistic 3.598986
Monte Carlo rank 446/10000
P-value 0.0446
Case 2003 41
Case 2006 3
Correlation -0.102210004
Correlation p-value 0.696
That’s all significant hotspot obtained by the retrospective space-time permutation scan statistic. The hotspot always happens in the frame time when the cluster has the higher case. This is because the concern of this study is to find hotspot with high rates of measles disease case. And hence, the value of indicator function in equation (5) sets to 1 only if the relative risk value greater than 1. In other words, the observed value is higher than its expected, indicates the excess of case within the cluster.
The map of the significant clusters depicted on Appendix 5. Note that the significant clusters are not perfect circles even though we used a circular window. This is because the data are aggregated to the district level, so that all of a district is considered to be within the window when the centroid is, and vice versa. The only way to obtain perfect circles is to have non-aggregated data.
Besides the circular windows used in scan statistic, there is also an ellipses scan windows, depends on the aim of the study. The
permutation scan statistic did not require the population data, so it is an advantage if this method applied in developing countries where the population data may be difficult to obtain or the quality is poor. If the population data is available, the common scan statistic might be applied, because the added information of the population data could made the hotspot results more reliable.
CONCLUSION
The space-time permutation scan statistic is a method to detects aberration, anomaly, or something unusual in some area comparing with it surroundings. This method not only detects where the cluster occurs, but also when it happens. Since cylinders used as the window scan, the hotspot obtained from this method also approximately circular.
The space-time scan statistic is defined trough a huge number of overlapping cylinders. For each cylinder, a log likelihood ratio (LLR) is calculated, and the test statistic is defined as the maximum LLR over all cylinders. Once the test statistic has been calculated, the next step is to evaluate its statistical significance by generating a large number of random data sets under the null hypothesis of no clustering, and then calculating the value of the test statistic for each of those data sets as well.
After applying space-time permutation scan statistic on West Java measles case data, there are twelve detected hotspot using this method which only four of them were significant at five percent significance level. Three of them happen in 2006, located in Cirebon, Bekasi, and Western Bandung. The fourth hotspot that still significant happens in 2003, located in Bogor.
SUGGESTIONS
REFERENCES
Kulldorff, M., and Nagarwalla, N. (1995). Spatial Disease Clusters: Detection and Inference. Statistic in Medicine 14, 799-810.
Kulldorff, M. (1997). A spatial scan statistic.
Communications in Statistic: A Theory Methods26, 1481–1496.
Kulldorff, M. (1998). Evaluating Cluster Alarms: A Space-Time Scan Statistic and Brain Cancer in Los Alamos, New Mexico. American Journal of Public Health88, 1377-1380.
Kulldorff, M. (1999). Spatial Scan Statistic: Models, Calculations, and Applications.
p.303-322. Birkhauser.
Kulldorff, M. (2006). SaTScanTM User Guide for version 7.0. http://www.satscan.org/
Kulldorff, M., Heffernan, R., Hartman, J., Assunção, R., and Mostashari, F.
(2005). A Space–Time Permutation Scan Statistic for Disease Outbreak Detection.
PLoS Medicine2, 216-224.
Patil, G.P., and Taillie, C. (2004). Upper Level Set Scan Statistic for Detecting Arbitrarily Shaped Hotspots. Environmental and Ecological Statistic 11, 183-197.
Septiani, D. (2006). A Flexibly Shaped Spatial Scan Statistic for Detecting Poverty Hotspots. Department of Statistics, Mathematics and Natural Science Faculty, Bogor Agricultural University. [Thesis]
Song, C., and Kulldorff, M. (2003). Power Evaluation of Disease Clustering Tests.
International Journal of Health Geographics2,9.
Wikipedia. (2007). Measles.
http://en.wikipedia.org/wiki/Measles. [June 24th, 2007]
Appendix 1. A thematic map of West Java measles disease case in 2003
Appendix 3. The output from SaTScan software _____________________________
SaTScan v7.0.3
_____________________________
Program run on: Thu Oct 04 00:27:46 2007
Retrospective Space-Time analysis scanning for clusters with high rates using the Space-Time Permutation model.
________________________________________________________________
SUMMARY OF DATA
Study period...: 2003/1/1 - 2006/12/31 Number of locations...: 442
Total number of cases....: 580
________________________________________________________________
MOST LIKELY CLUSTER
1.Location IDs included.: weru, plumbon, cirebonselatan, klangenan, cirebonutara, kesambi, harjamukti, kejaksan, sumber,
pekalipan, lemahwungkuk, palimanan, mundu, arjawinangun, beber
Coordinates / radius..: (6.719500 S, 108.495200 E) / 11.77 km Time frame...: 2006/1/1 - 2006/12/31
Number of cases...: 30 Expected cases...: 15.13 Observed / expected...: 1.982 Test statistic...: 5.858477 Monte Carlo rank...: 3/10000 P-value...: 0.0003
SECONDARY CLUSTERS
2.Location IDs included.: babelan, tarumajaya, tembelang, bekasiutara, cabangbungin,
bekasibarat, tambun, muaragembong, bekasiselatan, bekasitimur,
sukatanibekasi, cibitung, pakisjaya, cikarang, batujaya, jatiasih, bantargebang, pebayuran, tirtajaya, pondokgede, kedungwaringin, setu, rengasdengklok, serang, gunungputri, kutawaluya, cibuaya, telukjambe
Coordinates / radius..: (6.121500 S, 107.034800 E) / 34.76 km Time frame...: 2006/1/1 - 2006/12/31
3.Location IDs included.: sukaluyu, karangtengah, ciranjang, bojongpicung, cilaku, mande, cianjur, cibeber, cipeundeuybandung,
cikalongkulon, cugenang,
warungkondang, sukaresmi, cipatat, cipongkor, gununghalu, maniis, campakamulya, pacetcianjur, sukarajasukabumi, batujajar, tegalwaru, plered, cikalongwetan, padalarang, gegerbitung, cililin, sukabumi, darangdan, sindangkerta
Coordinates / radius..: (6.840400 S, 107.224400 E) / 31.13 km Time frame...: 2006/1/1 - 2006/12/31
Number of cases...: 27 Expected cases...: 14.34 Observed / expected...: 1.883 Test statistic...: 4.569782 Monte Carlo rank...: 56/10000 P-value...: 0.0056
4.Location IDs included.: cicurug, cidahusukabumi, cijeruk, caringin, nagrak, parungkuda,
parakansalak, ciawibogor, cibadak, ciomas, kalapanunggal, pamijahan, bogorselatan, kadudampit, megamendung, bogortimur, cisaruabogor
Coordinates / radius..: (6.769700 S, 106.784800 E) / 18.91 km Time frame...: 2003/1/1 - 2003/12/31
Number of cases...: 41 Expected cases...: 26.48 Observed / expected...: 1.549 Test statistic...: 3.598986 Monte Carlo rank...: 446/10000 P-value...: 0.0446
5.Location IDs included.: ibun, pasehbandung, samarang, pacetbandung, majalaya, leles,
cikancung, ciparay, kadungora, tarogong, arjasari, rancaekek, kertasari, banyuresmi, cicalengka, bojongsoang, cisurupan, leuwigoong, baleendah, cibiuk
Coordinates / radius..: (7.118200 S, 107.765200 E) / 19.49 km Time frame...: 2006/1/1 - 2006/12/31
Number of cases...: 26 Expected cases...: 15.13 Observed / expected...: 1.718 Test statistic...: 3.308802 Monte Carlo rank...: 788/10000 P-value...: 0.0788
6.Location IDs included.: cikatomas, pancatengah, salopa, cigugurciamis, cikalong,
cibalongtasik, karangnunggal, cimerak, cijulang, sukarajatasikmalaya,
cipatujah, tawang, cimaragas, singaparna, cihideung, bojonggambir, pamarican, cipedes, sidanulih, ciamis, taraju, banjar, cijeungjing,
banjarsari, cikoneng, indihiang, salawu, leuwisari, sadananya, peundeuy, pataruman, pangandaran
Coordinates / radius..: (7.621300 S, 108.273200 E) / 41.84 km Time frame...: 2003/1/1 - 2003/12/31
Number of cases...: 45 Expected cases...: 31.29 Observed / expected...: 1.438 Test statistic...: 2.814259 Monte Carlo rank...: 2165/10000 P-value...: 0.2165
7.Location IDs included.: bantarujeg, lemahsugih, talaga, maja, cikijing, wado, argapura, panjalu,
panumbangan, darma, majalengka, pagerageung, panawangan, cigasong, kadugede, kawali, sukahaji,
cigugurkuningan, malangbong, rajagaluh, panyingkiran, ciawitasik, pasawahankuningan, ciniru, selajambe, kramatmulya, kuningan, sindangwangi, darmaraja, cibugel, tomo, jamanis, jatinagara, cihaurbeuti, mandirancan, jatiwangi, dawuhan, rajapolah, kadipaten, jalaksana, situraja, garawangi, palasah, cilimus, rajadesa, leuwimunding
Coordinates / radius..: (6.990800 S, 108.266500 E) / 29.76 km Time frame...: 2003/1/1 - 2003/12/31
Number of cases...: 39 Expected cases...: 27.08 Observed / expected...: 1.440 Test statistic...: 2.436417 Monte Carlo rank...: 4480/10000 P-value...: 0.4480
8.Location IDs included.: tirtamulya, lemahabangkarawang, cikampek, klari, talagasari, jatisari,
karawang, rawamerta, ciampel, cilamaya, tempuran
Coordinates / radius..: (6.318100 S, 107.443700 E) / 17.47 km Time frame...: 2003/1/1 - 2003/12/31
Number of cases...: 17 Expected cases...: 10.83 Observed / expected...: 1.570 Test statistic...: 1.528149 Monte Carlo rank...: 9865/10000 P-value...: 0.9865
9.Location IDs included.: kertajati, ujungjaya, cikedung, jatitujuh, conggeang
Coordinates / radius..: (6.646300 S, 108.127100 E) / 12.61 km Time frame...: 2006/1/1 - 2006/12/31
Expected cases...: 5.58 Observed / expected...: 1.793 Test statistic...: 1.434325 Monte Carlo rank...: 9920/10000 P-value...: 0.9920
10.Location IDs included.: nanggung, leuwiliang, cigudeg Coordinates / radius..: (6.663600 S, 106.554800 E) / 10.30 km Time frame...: 2006/1/1 - 2006/12/31
Number of cases...: 6 Expected cases...: 2.79 Observed / expected...: 2.152 Test statistic...: 1.395643 Monte Carlo rank...: 9964/10000 P-value...: 0.9964
11.Location IDs included.: banjarwangi
Coordinates / radius..: (7.411100 S, 107.875800 E) / 0.00 km Time frame...: 2006/1/1 - 2006/12/31
Number of cases...: 4 Expected cases...: 1.59 Observed / expected...: 2.511 Test statistic...: 1.280560 Monte Carlo rank...: 9993/10000 P-value...: 0.9993
12.Location IDs included.: tanjungsari, rancakalong, cimanggu, cileungkrang
Coordinates / radius..: (6.868400 S, 107.809800 E) / 10.29 km Time frame...: 2006/1/1 - 2006/12/31
Number of cases...: 4 Expected cases...: 1.59 Observed / expected...: 2.511 Test statistic...: 1.280560 Monte Carlo rank...: 9993/10000 P-value...: 0.9993
________________________________________________________________
PARAMETER SETTINGS
Input ---
Case File : C:\Documents and Settings\dani\Desktop\RUN!!!\campak\kasuscampak.cas Coordinates File : C:\Documents and
Settings\dani\Desktop\RUN!!!\campak\koordinatkecamatan.geo
Time Precision : Year Start Date : 2003/1/1 End Date : 2006/12/31
Coordinates : Latitude/Longitude
Analysis ---
Type of Analysis : Retrospective Space-Time Probability Model : Space-Time Permutation Scan for Areas with : High Rates
Time Aggregation Length : 1
Number of Replications : 9999
Output ---
Results File : C:\Documents and Settings\dani\Desktop\RUN!!!\campak\retro10.txt Cluster File : C:\Documents and Settings\dani\Desktop\RUN!!!\campak\retro10.col.txt Cluster Case File : C:\Documents and Settings\dani\Desktop\RUN!!!\campak\retro10.cci.txt Location File : C:\Documents and Settings\dani\Desktop\RUN!!!\campak\retro10.gis.txt Simulated LLRs File : C:\Documents and Settings\dani\Desktop\RUN!!!\campak\retro10.llr.txt
Data Checking ---
Study Period Check : Check to ensure that cases and controls are within the Study Period. Geographical Coordinates Check : Check to ensure that all locations in the case, control
and population files are present in the coordinates file.
Neighbors File ---
Use Neighbors File : No
Spatial Window ---
Maximum Spatial Cluster Size : 10% of population at risk Window Shape : Circular
Temporal Window ---
Maximum Temporal Cluster Size : 50% of study period
Inference ---
Early Termination : No Report Critical Values : No Iterative Scan : No
Clusters Reported ---
Criteria for Reporting Secondary Clusters : No Geographical Overlap
Run Options ---
Processer Usage : All Available Proccessors Logging Analysis : Yes
Suppress Warnings : No
________________________________________________________________
Appendix 4. Summary of the clusters detected by using space-time permutation scan statistic
No Location Diameter Time Members LLR P-Value Obs Exp RR
1 Weru 11.77 2006 15 5.85848 0.0003 30 15.13 1.98
2 Babelan 34.76 2006 28 5.10247 0.0017 37 21.11 1.75 3 Sukaluyu 31.13 2006 30 4.56978 0.0056 27 14.34 1.88 4 Cicurug 18.91 2003 17 3.59899 0.0446 41 26.48 1.55
5 Ibun 19.49 2006 20 3.30880 0.0788 26 15.13 1.72
6 Cikatomas 41.84 2003 41 2.81426 0.2165 45 31.29 1.44 7 Bantarujeg 29.76 2003 46 2.43642 0.4480 39 27.08 1.44 8 Tirtamulya 17.47 2003 11 1.52815 0.9865 17 10.83 1.57 9 Kertajati 12.61 2006 5 1.43433 0.9920 10 5.58 1.79
10 Nanggung 10.30 2006 3 1.39564 0.9964 6 2.79 2.15
11 Banjarwangi 0.00 2006 1 1.28056 0.9993 4 1.59 2.51 12 Tanjungsari 10.29 2006 4 1.28056 0.9993 4 1.59 2.51
A SPACE-TIME PERMUTATION SCAN STATISTIC
FOR MEASLES DISEASE HOTSPOTS DETECTION IN WEST JAVA
DANI ARDIYANTO
DEPARTMENT OF STATISTICS
FACULTY OF MATHEMATICS AND NATURAL SCIENCES
BOGOR AGRICULTURAL UNIVERSITY
INTRODUCTION
Background
There is a long history of geographical surveillance of disease by publishing disease atlases. If there are areas with exceptionally high rates, they may give the clues to the etiology of the disease, indicating areas where health care needs to be improved, or to be targeted for preventive measures. Implementing scan statistic, we can do the surveillance of particular disease on particular area. This study applied retrospective space-time permutation scan statistic to construct measles disease surveillance in West Java.
According to the World Health Organization (WHO), vaccination rate has been high enough to make measles relatively uncommon in developed countries, but in developing countries it is still common. Globally, measles deaths went down 60 percent, from an estimated 873,000 deaths in 1999 to 345,000 in 2005. Africa has been the most success area, with annual measles deaths falling by 75 percent in just 5 years, from an estimated 506,000 to 126,000 (UNICEF World Press Release in Wikipedia, 2007).
The ability in detecting measles outbreaks early is important in order to minimize morbidity and mortality through timely implementation of measles prevention and control measures. A scan statistic can be used widely in any field to recognize any significant hotspot in terms to find any spatial areas that have elevated risk than their surroundings.
In space-time, the scan statistic can provide early warning of disease outbreaks and can monitor their spatial spread. This study using a retrospective space-time permutation scan statistic for detecting measles disease hotspot in West Java that utilized only case numbers, with no need for population-at-risk data, where these data are very difficult or irrelevant to be obtained.
This method was applied on annual data of measles disease cases in West Java in 2003 and 2006 periods.
Objective
The objective of this study is to detect measles disease hotspots in West Java in order to reveal its outbreaks using historical data of
Podes 2003 and 2006, where the detected hotspots indicated to be taken care due to the condition of health care and preventive measures action must be conducted.
DEFINITIONS
Measles
Measles, also called rubeola, is a highly contagious - but rare - respiratory infection that is caused by a virus. It causes a total-body skin rash and flu-like symptoms, including a fever, cough, and runny nose.
Measles is spread through respiration (contact with fluids from an infected person's nose and mouth, either directly or through aerosol transmission). About 90% of people without immunity sharing a house with an infected person will catch it. Airborne precautions should be taken for all suspected cases of measles. The incubation period usually lasts for 4–12 days (during which there are no symptoms). Infected people remain contagious from the appearance of the first symptoms until 3–5 days after the rash appears (Wikipedia, 2007).
Hotspot
Hotspot is defined as something unusual, anomaly, aberration, outbreak, elevated cluster, critical area, etc (Patil and Taillie, 2004).
Hotspot clusters were generated by setting the relative risk in some counties to be larger than one (Song and Kulldorff, 2003).
Hotspots are locations or regions that have consistently high levels of disease and may have characteristics unlike those of surrounding areas (Haran, Molineros, & Patil, 2006 in Septiani, 2006).
Scan Statistic
First studied by Naus in 1965, the scan statistic is an elegant way to solve problems of multiple testing when there are closely overlapping spatial areas and/or time intervals being evaluated. Temporal, spatial, and space– time scan statistic are now commonly used for disease cluster detection and evaluation, for a wide variety of diseases.
Space-Time Permutation Scan Statistic
The space–time permutation scan statistic utilizes thousands or millions of overlapping cylinders to define the scanning window, each being a possible candidate for an outbreak. The circular base represents the geographical area of the potential outbreak.
A typical approach is to first iterate over a finite number geographical grid points and then gradually increase the circle radius from zero to some maximum value defined by the user, iterating over the areas in the order in which they enter the circle. In this way, both small and large circles are considered, all of which overlap with many other circles.
The height of the cylinder represents the times. For each center and radius of the circular cylinder base, the method iterates over all possible temporal cylinder lengths. This means that we will evaluate cylinders that are geographically large and temporally short, forming a flat disk, those that are geographically small and temporally long, forming a pole, and every other combination in between.
What is new with the space–time permutation scan statistic is the probability model. Since we do not have population-at-risk data, the expected must be calculated using only the cases. Suppose we have annually case counts for z areas, where czd is the observed number of cases in area z during time d. The total number of observed cases (C) is
∑∑
=
z d zdc
C
…(1)For each area and time, we calculate the expected number of cases μzd conditioning on
the observed marginals:
⎟
⎠
⎞
⎜
⎝
⎛
⎟
⎠
⎞
⎜
⎝
⎛
=
∑
∑
d zd z zdzd
c
c
C
1
μ
…(2)In words, this is the proportion of all cases that occurred in area z times the total number of cases during time d. The expected number of cases μA in a particular cylinder A is the
summation of these expectations over all the area-time within that cylinder:
∑
∈=
A d z zd A ) , (μ
μ
…(3)The underlying assumption when calculating these expected numbers is that the probability of a case being in area z, given that it was observed on time d, is the same for all times d.
Let cA be the observed number of cases in the cylinder. Conditioned on the marginals, and
when there is no space–time interaction, cA is distributed according to the hypergeometric distribution with mean μA and probability
function (Kulldorff, 2005):
⎟
⎟
⎠
⎞
⎜
⎜
⎝
⎛
⎟
⎟
⎟
⎠
⎞
⎜
⎜
⎜
⎝
⎛
−
−
⎟
⎟
⎠
⎞
⎜
⎜
⎝
⎛
=
∑
∑
∑
∑
∈ ∈ ∈ ∈ A d zd A d A zd A z zd A A z zd Ac
C
c
c
C
C
c
c
C
P
(
)
…(4)The space-time scan statistic may be used for either a single retrospective analysis or for time-periodic prospective surveillance. In a retrospective analysis, the analysis is done only once for a fixed geographical region and a fixed study period, evaluating both ‘alive’ clusters, lasting until the study period and date, as well as ‘historic clusters’ that ceased to exist before the study period end date. The prospective option is used for the early detection of disease outbreaks, when analyses are repeated every day, week, month or year. Only alive clusters, clusters that reach all the way to current time as defined by the study period end date, are then searched for.
This study using the retrospective space-time scan statistic since the research only done once in West Java Province in 2003 and 2006.
Relative Risk
The relative risk, any non-negative number, representing how much more common event (case) is in this location compared to the baseline. Setting a value of one is equivalent of not doing any adjustments. A value of greater than one is used to adjust for an increased risk and a value of less than one to adjust for lower risk. A relative risk of zero is used to adjust for missing data for that particular location. Relative risk is calculated simply by dividing observed number to its expected (Kulldorff, 2006).
Likelihood Ratio Test
For each location and size of the scanning window, the alternative hypothesis is that there is an elevated risk within the window as compared to outside. When both
∑
and∈A z zd
c
∑
∈A d zdc
are small compared to C, cA isPoisson generalized likelihood ratio (GLR) as a measure of the evidence that cylinder A
contains an outbreak:
( )
( )
I
C
c
C
c
A C cAA A c A A −
⎟⎟
⎠
⎞
⎜⎜
⎝
⎛
−
−
⎟⎟
⎠
⎞
⎜⎜
⎝
⎛
μ
μ
…(5)In words, this is the observed divided by the expected to the power of the observed inside the cylinder, multiplied by the observed divided by the expected to the power of the observed outside the cylinder. I() is an indicator function. When the objective of this study is set to scan only for clusters with high rates, I() is equal to 1 when the window has more cases than expected under the null-hypothesis, and 0 otherwise. The opposite is true when the objective of the study is set to scan only for clusters with low rates. When the study scans for clusters with either high or low rates, then I()=1 for all windows.
The likelihood function is maximized over all window locations and sizes, and the one with the maximum likelihood constitutes the most likely cluster. This is the cluster that is least likely to have occurred by chance. The likelihood ratio for this window constitutes the maximum likelihood ratio test statistic (Kulldorff, 2006).
Monte Carlo Hypothesis Testing
Once the value of test statistic calculated, it is easy to do the inference. We cannot expect to find the distribution of test statistic in closed analytical form. Instead we rely on Monte Carlo hypothesis testing.
With Monte Carlo hypothesis test, the statistical significance of an observed test statistic calculated from a set of data that assessed by comparing it with a distribution obtained by generating alternative set of data from some assumed model. If the assumed model implies that all data orderings are equally likely then this amounts to a randomization test with random sampling of the randomization distribution.
Monte Carlo hypothesis testing using in scan statistic consist of four steps procedure: 1. Calculate the value of the test statistic for
the real data.
2. Create a large number of random data sets under the null hypothesis.
3. Calculate the value of test statistic for each random replication.
4. Sort the value of test statistic in step 3 (simulation data), then compare it with the value of test statistic in step 1 (real data). If
value of test statistic for real data ranked in the highest α percent of value of test statistic for simulation data, then reject the null hypothesis at α percent significance level.
On the other hand, p-value can be denoted by p-value = rank /(1 + number of simulation generated) (Kulldorff, 1999).
MATERIALS AND METHODS
Data Sources
This study used secondary data of measles disease cases in West Java obtained from 2003 and 2006 of Potensi Desa (Podes) surveys by Statistics Indonesia.
Methods
During the completion of this study, several steps were done as mentioned below: 1. Merging the 2003 and 2006 measles case
in West Java districts using SAS 9.1. 2. Generating any possible scan windows
with the maximum spatial cluster size was 10% of population and maximum temporal cluster size was 1 year.
3. Calculating the relative risk of each scanned window mentioned on step 2, and then discarding the window with relative risk less than 1.
4. Calculating the likelihood function value of each scanned window obtained at step 3.
5. Obtaining the statistical significant value for each hotspot candidate using Monte Carlo simulation with 9999 replications. 6. Interpreting the results and presenting the
hotspot area on West Java map using MapInfo Professional 7.8 SCP.
This study use SaTScan 7.0 to perform step 2 to 5.
The size of spatial and temporal window can vary up to 50% of the total study area or time. Subjectively, the value of the spatial window was set up to 10% of the total West Java area and the value of temporal window was set up to 50% of the total two-year period of study, 2003 and 2006. Before the value of the spatial window was set to 10%, this research had tried the different maximum spatial windows, of 5%, 15%, 25%, and 50%. The value of maximum temporal window cannot be changed, because this research only involved two points of time.
INTRODUCTION
Background
There is a long history of geographical surveillance of disease by publishing disease atlases. If there are areas with exceptionally high rates, they may give the clues to the etiology of the disease, indicating areas where health care needs to be improved, or to be targeted for preventive measures. Implementing scan statistic, we can do the surveillance of particular disease on particular area. This study applied retrospective space-time permutation scan statistic to construct measles disease surveillance in West Java.
According to the World Health Organization (WHO), vaccination rate has been high enough to make measles relatively uncommon in developed countries, but in developing countries it is still common. Globally, measles deaths went down 60 percent, from an estimated 873,000 deaths in 1999 to 345,000 in 2005. Africa has been the most success area, with annual measles deaths falling by 75 percent in just 5 years, from an estimated 506,000 to 126,000 (UNICEF World Press Release in Wikipedia, 2007).
The ability in detecting measles outbreaks early is important in order to minimize morbidity and mortality through timely implementation of measles prevention and control measures. A scan statistic can be used widely in any field to recognize any significant hotspot in terms to find any spatial areas that have elevated risk than their surroundings.
In space-time, the scan statistic can provide early warning of disease outbreaks and can monitor their spatial spread. This study using a retrospective space-time permutation scan statistic for detecting measles disease hotspot in West Java that utilized only case numbers, with no need for population-at-risk data, where these data are very difficult or irrelevant to be obtained.
This method was applied on annual data of measles disease cases in West Java in 2003 and 2006 periods.
Objective
The objective of this study is to detect measles disease hotspots in West Java in order to reveal its outbreaks using historical data of
Podes 2003 and 2006, where the detected hotspots indicated to be taken care due to the condition of health care and preventive measures action must be conducted.
DEFINITIONS
Measles
Measles, also called rubeola, is a highly contagious - but rare - respiratory infection that is caused by a virus. It causes a total-body skin rash and flu-like symptoms, including a fever, cough, and runny nose.
Measles is spread through respiration (contact with fluids from an infected person's nose and mouth, either directly or through aerosol transmission). About 90% of people without immunity sharing a house with an infected person will catch it. Airborne precautions should be taken for all suspected cases of measles. The incubation period usually lasts for 4–12 days (during which there are no symptoms). Infected people remain contagious from the appearance of the first symptoms until 3–5 days after the rash appears (Wikipedia, 2007).
Hotspot
Hotspot is defined as something unusual, anomaly, aberration, outbreak, elevated cluster, critical area, etc (Patil and Taillie, 2004).
Hotspot clusters were generated by setting the relative risk in some counties to be larger than one (Song and Kulldorff, 2003).
Hotspots are locations or regions that have consistently high levels of disease and may have characteristics unlike those of surrounding areas (Haran, Molineros, & Patil, 2006 in Septiani, 2006).
Scan Statistic
First studied by Naus in 1965, the scan statistic is an elegant way to solve problems of multiple testing when there are closely overlapping spatial areas and/or time intervals being evaluated. Temporal, spatial, and space– time scan statistic are now commonly used for disease cluster detection and evaluation, for a wide variety of diseases.
Poisson generalized likelihood ratio (GLR) as a measure of the evidence that cylinder A
contains an outbreak:
( )
( )
I
C
c
C
c
A C cAA A c A A −
⎟⎟
⎠
⎞
⎜⎜
⎝
⎛
−
−
⎟⎟
⎠
⎞
⎜⎜
⎝
⎛
μ
μ
…(5)In words, this is the observed divided by the expected to the power of the observed inside the cylinder, multiplied by the observed divided by the expected to the power of the observed outside the cylinder. I() is an indicator function. When the objective of this study is set to scan only for clusters with high rates, I() is equal to 1 when the window has more cases than expected under the null-hypothesis, and 0 otherwise. The opposite is true when the objective of the study is set to scan only for clusters with low rates. When the study scans for clusters with either high or low rates, then I()=1 for all windows.
The likelihood function is maximized over all window locations and sizes, and the one with the maximum likelihood constitutes the most likely cluster. This is the cluster that is least likely to have occurred by chance. The likelihood ratio for this window constitutes the maximum likelihood ratio test statistic (Kulldorff, 2006).
Monte Carlo Hypothesis Testing
Once the value of test statistic calculated, it is easy to do the inference. We cannot expect to find the distribution of test statistic in closed analytical form. Instead we rely on Monte Carlo hypothesis testing.
With Monte Carlo hypothesis test, the statistical significance of an observed test statistic calculated from a set of data that assessed by comparing it with a distribution obtained by generating alternative set of data from some assumed model. If the assumed model implies that all data orderings are equally likely then this amounts to a randomization test with random sampling of the randomization distribution.
Monte Carlo hypothesis testing using in scan statistic consist of four steps procedure: 1. Calculate the value of the test statistic for
the real data.
2. Create a large number of random data sets under the null hypothesis.
3. Calculate the value of test statistic for each random replication.
4. Sort the value of test statistic in step 3 (simulation data), then compare it with the value of test statistic in step 1 (real data). If
value of test statistic for real data ranked in the highest α percent of value of test statistic for simulation data, then reject the null hypothesis at α percent significance level.
On the other hand, p-value can be denoted by p-value = rank /(1 + number of simulation generated) (Kulldorff, 1999).
MATERIALS AND METHODS
Data Sources
This study used secondary data of measles disease cases in West Java obtained from 2003 and 2006 of Potensi Desa (Podes) surveys by Statistics Indonesia.
Methods
During the completion of this study, several steps were done as mentioned below: 1. Merging the 2003 and 2006 measles case
in West Java districts using SAS 9.1. 2. Generating any possible scan windows
with the maximum spatial cluster size was 10% of population and maximum temporal cluster size was 1 year.
3. Calculating the relative risk of each scanned window mentioned on step 2, and then discarding the window with relative risk less than 1.
4. Calculating the likelihood function value of each scanned window obtained at step 3.
5. Obtaining the statistical significant value for each hotspot candidate using Monte Carlo simulation with 9999 replications. 6. Interpreting the results and presenting the
hotspot area on West Java map using MapInfo Professional 7.8 SCP.
This study use SaTScan 7.0 to perform step 2 to 5.
The size of spatial and temporal window can vary up to 50% of the total study area or time. Subjectively, the value of the spatial window was set up to 10% of the total West Java area and the value of temporal window was set up to 50% of the total two-year period of study, 2003 and 2006. Before the value of the spatial window was set to 10%, this research had tried the different maximum spatial windows, of 5%, 15%, 25%, and 50%. The value of maximum temporal window cannot be changed, because this research only involved two points of time.
area study, because when it was allowed to expand more, the likelihood no longer reflects a cluster of increased disease risk inside, but a decreased risk outside.
RESULTS AND DISCUSSION
West Java
According to Podes data from Statistic Indonesia, West Java Province consists of 18 regencies/municipalities, divided into 507 districts in 2003 and 547 districts in 2006. The observed measles cases in this study period was 349 and 231 in 2003 and 2006 respectively, thus the total cases is 580 cases. It means that the case was decreasing between 2003 and 2006, perhaps could be considered as an indicator that West Java Province carried out some improvement on public health service.
The top ten districts on measles case number could be seen on the Table 1. The number in parentheses reflects the case of the corresponding districts. More simultaneously information about the spread of the measles case can be reviewed by thematic map at the Appendix 1 and 2.
Table 1. Top Ten Districts on Measles Case.
No 2003 2006
1 Ciawi Bogor (13) Cikarang (11) 2 Talaga (11) Mundu (11) 3 Megamendung(10) Beber (7) 4 Garutkota (7) Cisurupan (6) 5 Situraja (7) Jatitujuh (6) 6 Cibarusah (6) Bekasi Selatan (5) 7 Cidaun (6) Cidaun (5) 8 Juntinyuat (6) Kadungora (5) 9 Krangkeng (6) Banjarwangi (4) 10 Waled (6) Cibuaya (4)
The relationship degree of measles case during two year period in each region of West Java is shown on the Table 2. This table was obtained after dividing West Java region into 4 non-overlapping areas and calculating the Pearson correlation between 2003 and 2006 measles case in each area.
The correlation values were all significant although the relationship between the 2003 and 2006 measles case data seems too weak, because the Pearson correlation values tend close to zero. This means that if there is an excess measles case in certain area, the chance
[image:33.595.342.486.143.232.2]of the excess still remains in that area is very small because the tendency is weak.
Table 2. Pearson Correlation of Measles Case 2003 and 2006.
Area Correlation P-value
North 0.13 0.050
South 0.17 0.014
West 0.14 0.042
East 0.15 0.028
Overall 0.14 0.003
After doing some adjustment conditioned on the West Java digital map limitation, the number of district in the area of study decrease to only 442 districts. Hence, this study only search cluster within districts registered on existing digital map. Using SaTScan software, the calculations for the retrospective space-time permutation scan statistic on 800 MHz PC with 384 MB of RAM took 11 minutes and 15 seconds. The output of the software can be reviewed at Appendix 3.
Hotspot Candidates
[image:33.595.323.507.556.729.2]After applying the retrospective space-time permutation scan statistic with ten percent of maximum spatial size window and 9999 Monte Carlo replications, there are twelve measles disease hotspots detected. All of them have the relative risk value greater than one since the objective of the study is to search clusters with the high rates of measles case. Only four of them were significant at five percent significance level. Appendix 4 shows the summary of these hotspot candidates.
Table 3. Description of Detected Hotspots.
No Time LLR P-value RR
area study, because when it was allowed to expand more, the likelihood no longer reflects a cluster of increased disease risk inside, but a decreased risk outside.
RESULTS AND DISCUSSION
West Java
According to Podes data from Statistic Indonesia, West Java Province consists of 18 regencies/municipalities, divided into 507 districts in 2003 and 547 districts in 2006. The observed measles cases in this study period was 349 and 231 in 2003 and 2006 respectively, thus the total cases is 580 cases. It means that the case was decreasing between 2003 and 2006, perhaps could be considered as an indicator that West Java Province carried out some improvement on public health service.
The top ten districts on measles case number could be seen on the Table 1. The number in parentheses reflects the case of the corresponding districts. More simultaneously information about the spread of the measles case can be reviewed by thematic map at the Appendix 1 and 2.
Table 1. Top Ten Districts on Measles Case.
No 2003 2006
1 Ciawi Bogor (13) Cikarang (11) 2 Talaga (11) Mundu (11) 3 Megamendung(10) Beber (7) 4 Garutkota (7) Cisurupan (6) 5 Situraja (7) Jatitujuh (6) 6 Cibarusah (6) Bekasi Selatan (5) 7 Cidaun (6) Cidaun (5) 8 Juntinyuat (6) Kadungora (5) 9 Krangkeng (6) Banjarwangi (4) 10 Waled (6) Cibuaya (4)
The relationship degree of measles case during two year period in each region of West Java is shown on the Table 2. This table was obtained after dividing West Java region into 4 non-overlapping areas and calculating the Pearson correlation between 2003 and 2006 measles case in each area.
The correlation values were all significant although the relationship between the 2003 and 2006 measles case data seems too weak, because the Pearson correlation values tend close to zero. This means that if there is an excess measles case in certain area, the chance
[image:34.595.342.486.143.232.2]of the excess still remains in that area is very small because the tendency is weak.
Table 2. Pearson Correlation of Measles Case 2003 and 2006.
Area Correlation P-value
North 0.13 0.050
South 0.17 0.014
West 0.14 0.042
East 0.15 0.028
Overall 0.14 0.003
After doing some adjustment conditioned on the West Java digital map limitation, the number of district in the