Effect of Column to Beam Strength Ratio on Performance
of Reinforced Concrete Frames
I Ketut Sudarsana
*, Ida Ayu Made Budiwati
*, Putu Wiyta Aditya
* *Department of Civil Engineering Udayana University, Badung, Bali, Indonesia [email protected]; [email protected]
Abstract
—
A ductile reinforced concrete structure shall be designed to ensure that plastic hinges occur as many as possible before collapse. This paper investigates the effect of column to beam strength ratio on performance of ductile reinforced concrete buildings. Fourteen interior frame models of two building categories which are five and ten stories buildings were modeled and analyzed. The main parameter among those models is column to beam strength ratio of 1.0 to 2.0 which are 1.0, 1.2, 1.4, 1.6, 1.8, and 2.0. The values are the ratio between column nominal strength (∑Mnc) and beam nominal strength (∑Mnb). Inthis study, the ratio between column strength to beam probable
strength (∑Mprb) of 1.2 is also investigated. A static nonlinear
pushover analysis was used to evaluate the performances of all models. Analysis results show that all models have a life safety performance level. A collapse mechanism of beam sway mechanism was achieved for strength ratios of 1.4 to 2.0 for five story frame models and 1.6 to 2.0 for ten story frames. The increase in the strength ratio up to 1.4 can increase ductility factor significantly, however, beyond that the strength ratio does not affect the ductility both for five and ten story frame models. Considering the ratio between column strength to beam probable strength of 1.2, the ductility factor increases by 16% and 25% respectively for five and ten stories, however, both frames still have performance level of life safety and collapse mechanism of column sway mechanism.
Key words – Performance level, colum-to-beam strength ratio, reinforced concrete, ductility.
I. INTRODUCTION
A. Background
Many researches have been done to investigate the behavior of reinforced concrete structure due to earthquake load. Ref. [1] in clause 21.6.2.2 suggests that for ductile moment frames, the sum of nominal flexural strength of the column at beam-column joint shall be at least 1.2 times the sum of nominal flexural strength of beams framing into the joint. This clause is intended to guarantee the behavior of strong column-weak beam of reinforced concrete frames. However, a study by [2] on the frames of five and ten stories buildings shows that the strength ratio of 1.2 cannot guarantee a strong column-weak beam criteria occurred especially in the buildings located at high seismic regions. Code of other countries such as New Zealand and Mexico suggests a higher ratio which is in a range of 1.5 to 2.0 [3].
A study by [3] on two buildings (3 and 6 stories) in which
mechanism occurred in a building. In term of seismic performance, the strength ratio obtained by changing the column reinforcement was more effective rather than changing the member dimension. Ref. [3] calculated the story drift by a technique to push the story in question, while the story below was restrained from lateral displacement. This technique was questioned by [4] being inconsistent with typical behaviors of frame subjected to earthquake excitation.
An in-elastic behavior of beams to response the seismic design loads is expected in order to distribute seismic energy. During this behavior, the reinforcement in beams may have reached strain hardening conditions so that the moment capacity of the beams may also increase from a nominal flexural moment (Mnb) to a probable flexural capacity (Mprb).
This condition may affect the sum of nominal column moment at the joint (∑Mnc), therefore, a study of this effect is needed.
B. Research Objective
This research investigates the effect of column to beam strength ratios of 1.0 to 2.0 which are 1.0, 1.2, 1.4, 1.6, 1.8, and 2.0 on the performance of reinforced concrete frames using a static nonlinear pushover analysis. Two model structures are studied which are five and ten stories buildings. This study also investigates the effect of considering probable flexural strength (Mprb) of beams in calculating the nominal
flexural strength of the column at the joint, instead of using the nominal flexural strength (Mnb) of beams.
II. RESEARCH METHOD
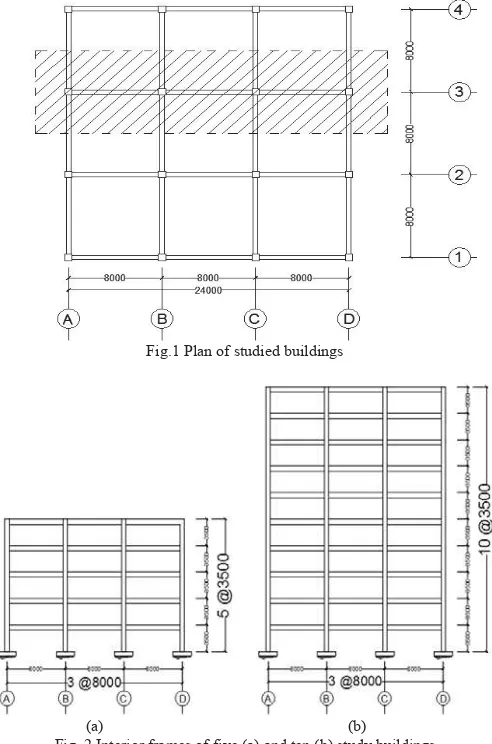
A. Study Building Descriptions
Fig.1 Plan of studied buildings
(a) (b)
Fig. 2 Interior frames of five (a) and ten (b) study buildings
Only the interior frames of each studied buildings as shown in Figure 2, were modeled and analyzed in accordance to [1]by varying the strength ratio of 1.0, 1.2, 1.4, 1.6, 1.8 and 2.0. The interior frame was considered due to supporting the largest gravity loads. In addition to those frame models, another model was also created for each story building in order to study the effect of using probable flexural strength (Mprb) instead of nominal flexural strength (Mnb) of beams to
calculate the nominal flexural strength of column at the joint (ΣMnc). Therefore, total frames to be studied in this research
were fourteen frames as shown in Table I.
The frames were analyzed and designed to obtain beam dimension and reinforcement conforming [1] for a special moment frame. Once the beam reinforcement was obtained, then the nominal moment of the columns were calculated by considering the variation of column to beam strength ratio. Table II shows dimensions of all structural elements that satisfying all column to beam strength ratios to be studied. The slab thickness of 200 mm was applied for all models.
TABLE I TOTAL STUDY MODELS
B. Numerical Modelling and Analysis
Evaluation of the structural performance of all frames was carried out using static nonlinear pushover analysis provided by software SAP2000 v.15 after design results of all members were obtained. Plastic hinges behavior of the beams and columns were defined according to [5]. The flexural stiffness of columns and beams was reduced by considering crack inertia moment of 0.7 and 0.5 of the gross inertia moment. The structural performance was evaluated based on displacement target (GT) according to [5] as follows:
GT = C0C1C2C3Sa(Te/2S)2g (1)
where:
δT = Displacement target.
Te = Effective fundamental period of the building in the
direction under consideration, sec
C0 = Modification factor to relate spectral displacement of an
equivalent SDOF system to the roof displacement of the building MDOF system
C1= Modification factor to relate expected maximum
inelastic displacements to displacements calculated for linear elastic response.
C2 = Modification factor to represent the effect of pinched
hysteretic shape, stiffness degradation and strength deterioration on maximum displacement response C3 = Modification factor to represent increased
displacements due to dynamic P-D effects. Sa = Response spectrum acceleration, at the effective
fundamental period and damping ratio of the building in the direction under consideration
g = Acceleration of gravity 9,81 m/s²
Structural performance levels can be categorized according to [6] namely Operational (O), Immediate Occupancy (IO), Life Safety (LS), and Collapse Prevention (CP). The performance level of the models is determined base on the condition of which the ultimate plastic hinge occurred.
No Model No. of Story
Strength Ratio
∑Mnc/∑Mnb
Strength Ratio
∑Mnc/∑Mpr,b
1 M11 5 1,0 -
2 M12 5 1,2 -
3 M13 5 1,4 -
4 M14 5 1,6 -
5 M15 5 1,8 -
6 M16 5 2,0 -
7 M21 10 1,0 -
8 M22 10 1,2 -
9 M23 10 1,4 -
10 M24 10 1,6 -
11 M25 10 1,8 -
12 M26 10 2,0 -
13 M3 5 - 1,2
TABLE II
DIMENSION OF STRUCTURAL ELEMENTS Story
Columns grid B,C (mm)
Beams (mm)
Columns grid A,D (mm)
Columns grid B,C (mm)
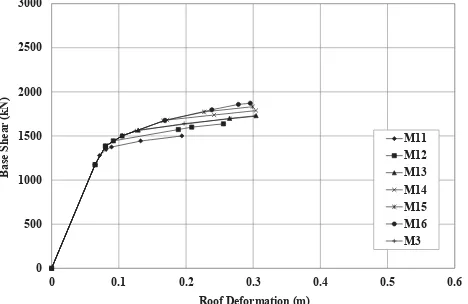
The capacity curves obtained from static nonlinear pushover analysis for five and ten story frame are shown in Fig. 3 and 4, respectively. It shows that the increase in column-to-beam strength ratio, resulted in the increase of the
maximum lateral load and roof lateral deformation. The maximum base shear and lateral roof displacement is obtained for strength ratio of 2.0. Fig. 3 and 4 also show that the capacity curves are the same for all models in each category before yielding occurs. The curves start to deviate after yielding of reinforcement occurs in the structural members.
0
Roof Deformation (m)
M11
Roof Displacement (m)
M21
Considering the probable flexural strength (Mprb) instead
of the nominal flexural strength (Mnb) of the beams to obtain
the nominal flexural column at joint (Mnc) as in M3 and M4
for five and ten story frames, respectively, both models increase their base shear and lateral roof displacement compare to Model M12 and M22, respectively.
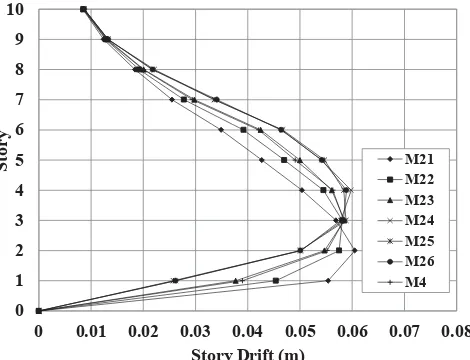
Fig. 5 and 6 show lateral story displacement for each model at condition where the target displacement was reached.
The story drifts as shown in Fig. 7 and 8 for each model were calculated from the data presented in Fig. 5 and 6. Comparing to drift limitation given in [7] where the maximum story drift calculated using Δα = 0,02 hsx = 0.02 x 3.5 m = 0,070 m, all
0
Lateral Displacement (m)
M11
Lateral Deformations (m)
M21
B. Collapse Mechanism
The five story frames M11 and M12 with strength ratio of 1.0 and 1.2, respectively, reach collapse or ultimate plastic hinges at the column base. However, the frame Model M11 reaches first yielding at column before all beams yield. This indicates a column sway mechanism (CSM) occurred. However, for frames with strength ratio of 1.4 to 2.0 and 1.2Mprb, the ultimate plastic hinges occur in beams first,
therefore, a beam sway mechanism (CSM) prevailed. In strength ratio range from 1.4 to 2.0 and 1.2 Mprb, the
strong-column weak-beam design concept can be achieved.
Collapse mechanism behaviour of 10 story frame is the same as that of 5 story frames, except for frame Model M4 in which the strength ratio was calculated using 1.2Mprb. This
frame shows the collapse plastic hinge occurred at column end. Figures in Table III and IV show collapse mechanism of all studied models. Ultimate hinges or collapse hinges in the models are indicated by “x” sign.
TABLE III
Collapse Mechanism for strength ratio (
∑
M
nc/
∑
M
nb) = 1.0, 1.2, 1.4, 1.6
Story Strength Ratio ( ∑Mnc/∑Mnb)
1.0 1.2 1.4 1.6
5
10
: Plastic hinges reach ultimate point or collapse
TABLE IV
Collapse Mechanism for strength ratio (∑Mnc/∑Mnb) =1.8, 2.0 and strength ratio (∑Mnc/∑Mprb) = 1.2
Story Strength Ratio (∑Mnc/∑Mnb) Strength Ratio (∑Mnc/∑Mprb)
1.8 2.0 1.2
5
10
: Plastic hinges reach ultimate point or collapse
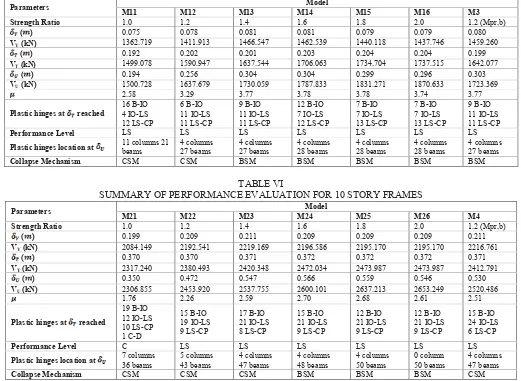
C. Performance Evaluation
Evaluation of the building performance follows [5] and also [8] as given in (1). Summary of the calculation is given in Table V and VI. Both five and ten story frames for
column-to-safety. Only Model M21 of 10 story frame with a strength ratio of 1.0 show performance level of collapse prevention.
The largest base shear at reinforcement yields occurs in Model M13 and M23 for 5 and 10 story frames, respectively. The lowest one is in Model M11 and M12. Increasing the strength ratio is not automatically increase the yield base shear. This is due to the first yield hinges occurred as indication of yielding; do not happen in the same location. The base shear at frame reaching displacement target increases with the increase in the strength ratio, however, the values is slightly lower than the ultimate base shear.
The total number of plastic hinges at ultimate condition for 5 and 10 story frames are shown in Table V and VI, respectively. Distribution of hinges to the beams at collapse condition is much better as the strength ratio increase. Comparing the performances of Model M3 with M12 and Model M4 with M22, it shows that by considering probable flexural beams strength to calculate the strength ratio at joint gives better performances.
The changes in the strength ratio are also affects the displacement ductility factor of the frames. The ductility
factor is obtained by dividing ultimate displacement with displacement at yielding as shown in Table V and VI. The ductility factor increases significantly for strength ratio increase from 1.0 to 1.4 for both five and ten story frames. The strength ratio increase from 1.0 to 1.2 and from 1.2 to 1.4, the ductility increase about 28% and 14.5%. After these ranges, the strength ratio does not affect the ductility factor significantly. The highest value of ductility factor is still lower than that of expected value for ductile frame which is 5
Comparing the effect of using 1.2 times beam probable moments to calculate column nominal moments as in the Model M3 and M4, results in the ductility factor of Model M3 and M4 increases by 16% and 25% from ductility of M12 and M22, respectively.
TABLE V
SUMMARY OF PERFORMANCE EVALUATION FOR 5 STORY FRAMES
Parameters Model
M11 M12 M13 M14 M15 M16 M3
Plastic hinges at reached
16 B-IO Plastic hinges location at 11 columns 21
beams
SUMMARY OF PERFORMANCE EVALUATION FOR 10 STORY FRAMES
Parameters Model
M21 M22 M23 M24 M25 M26 M4
Plastic hinges at reached
19 B-IO Plastic hinges location at 7 columns
IV.CONCLUSIONS
Based on analysis and discussions have been done, the following conclusions can be drawn:
a. The performance level of all studied frames is life safety except that the ten story frame with the strength ratio of 1.0 has performance level of collapse.
b. A collapse mechanism of beam sway mechanism was achieved for strength ratio of 1.4 to 2.0 for 5 story frame Model and 1.6 to 2.0 for ten story frame.
c. The increase in the strength ratio up to 1.4 can increase ductility factor significantly, however, beyond that the strength ratio does not affect the frame ductility both for five and ten story frame models.
d. Considering probable flexural strength (Mprb) instead of
nominal flexural strength (Mnb) of beam to calculate the
nominal column strength for strength ratio of 1.2 results in better frame performances. The ductility factor increase by 16% and 25% respectively for five and ten story structure.
ACKNOWLEDGMENT
This research has been possible with financial supports from Department of Civil Engineering at University of Udayana. Special thanks to colleagues at the department for their input and comments during various stages of the research program.
REFERENCES
[1] SNI 2847:2013, Persyaratan Beton Struktural untuk Bangunan Gedung.
Badan Standardisasi Nasional, Jakarta, 2013.
[2] P. Pudjisuryadi and B. Lumantarna, “Evaluation of Columns Flexural Strength of Special Moment Resisting Frame in Accordance to the Indonesian Concrete and Earthquake Codes”,Proceeding International Conference on Earthquake Engineering and Disaster Mitigation
(ICEEDM08), Jakarta, 2008.
[3] J.M. Bracci and K.L. Dooley, “Seismic evaluation of column-to-beam strength ratio in reinforced concrete frames”, ACI Structural Journal,
Vol. 98, No. 6, November-Desember 2001, pp 843-851
[4] K.J. Elwood and J.P. Moehle, “Seismic evaluation of column-to-beam strength ratio in reinforced concrete frames-Discussion”, ACI Structural
Journal, September-October 2002, pp 710-711.
[5] FEMA 356, Prestandard And Commentary For The Seismic
Rehabilitation Of Buildings. Federal Emergency Management Agency,
Washington D.C., 2000.
[6] FEMA 273, NEHRP guidelines for the seismic rehabilitation of
buildings, Federal Emergency Management Agency, Washington D.C.
1997.
[7] SNI 1726:2012, Tata Cara Perencanaan Ketahanan Gempa Untuk
Struktur Bangunan Gedung dan Non Gedung, Badan Standardisasi
Nasional, Jakarta, 2012.
[8] FEMA 440, Improvement of Nonlinear Static Seismic Analysis
Procedures, Federal Emergency Management Agency. Washington D.C