16S Ribosomal RNA-Based Analysis of Thermophilic Bacteria
in Gedongsongo Hot Spring
AGUSTINA LULUSTYANINGATI NURUL AMININ1, FIDA MADAYANTI1, PINGKAN ADITIAWATI2, AND AKHMALOKA1∗
1Biochemistry Research Division, Faculty of Mathematics and Natural Sciences, 2School of Life Sciences and Technology, Institut Teknologi Bandung,
Jalan Ganesha 10, Bandung 40132, Indonesia
Denaturing gradient gel electrophoresis was used to identify the bacterial community at the Gedongsongo (WGS-2) hot spring. The bacterial samples were obtained from both culture dependent and independent strategies. Partial 16S rRNA genes were amplified by a set of primers to produce at around 400 bp fragments, including the highly variable V9 region of the 16S rRNA genes. The DGGE profiles showed that there were a few distinct bands, namely G1-G3, and G8-G12, which represent the predominant bacteria in natural habitat and the medium. Further analysis of these bands showed that most of them, except for G7, have a high homology to the 16S rRNA gene sequences of Thermus sp. As for G7, the highest homology was shown to unculturable bacteria. In addition to the distinct bands in DGGE, there were other three thin bands, namely G4, G5, and G6, which possibly represent non dominant microorganisms in the natural habitat, but could grow on GS-A medium. Further analysis of these bands showed that G6 has 80% similarity to the 16S rRNA of Burkholderia sp., while G4 and G5 have a high homology to each other but only contained 10-15% homology to the sequences of 16S rRNA from unculturable microorganisms. The phylogenetic analyses of the last organisms showed that there was branching from Burkholderia. From all the data obtained it was suggested that the WGS-2 hot spring was predominantly occupied by the genus Thermus. In addition, there were a few novel microorganisms found in the hot spring.
Key words: thermophiles, 16S rRNA, DGGE
_____________________________________________
_________________
∗Corresponding author, Phone:+62-22-2502103,
Fax: +62-22-2504154, E-mail: [email protected]
One of the challenges in modern microbial ecology is how to effectively and accurately assess microbial diversity. A common thread described in numerous published studies concerning microbial diversity is that, in most environments, only 0.1 to 1.0% of bacteria detected by direct microscopic enumeration can be recovered on even the most general laboratory media (Staley and Konopka 1985). As a result, microbial ecologists generally are of the opinion that the vast majority of microbial diversity remains uncharacterized due to this gap between cultivable and direct estimation of microbial biomass and diversity. This concern has spurred on the development of molecular approaches for studying microbial communities, usually based on analysis of nucleic acids directly extracted from environmental samples (Pace et al. 1986). The application of molecular phylogenetic to study natural microbial ecosystems without the traditional requirement for cultivation has resulted in the discovery of many unexpected evolutionary lineages; members of some of these lineages are only distantly related to known organisms but are sufficiently abundant that likely to have impact on the chemistry of biosphere (Pace 1997).
The classical approach to determine the microbial diversity in a natural or artificial ecosystems starts with culturing of the microorganisms in a sample. Culture-based approaches to isolate microorganisms from any natural environment do not provide comprehensive information on the composition of microbial communities (Bull and Hardman 1991). This technique also fails to determine the majority of microorganisms in nature, which typically not cultivated using standard techniques (Amann et al. 1995). It has been
realized that only a minor fraction of the microorganisms (1-5%) are amenable to standard culturing techniques (Schmidt et al. 1991; Liesack and Stackebrandt 1992; Fuhrman et al. 1993). Due to this difference between cultivable and in situ diversity, it is often difficult to assess the significance of cultured members in resident microbial communities. In order to overcome the limitations associated with cultural approaches, a molecular alternative has been developed. The development of techniques for the analysis of 16S rRNA sequences in natural samples has enhanced our ability to detect and identify bacteria in nature (Pace et al. 1986). This involves DNA extraction of community directly from water, soil or sediments followed by PCR amplification and then sequencing of 16S rRNA genes, which are known to be one of the established phylogenetic markers (Woese 1987). Such approaches have been successfully applied for hot spring (Ferris et al. 2003), compost (Ueda et al. 2001), marine bacteria-plankton (Fuhrman et al. 1993), soil (Nakatsu et al. 2000) and as well as hydrothermal environment (Moyer et al. 1995) samples.
and sequence analysis (Kowalchuk et al. 1997; McCaig et al. 1999), and with culturing methods (Watanabe et al. 1998). In this report we will describe the bacterial community inhabiting a hot spring at Gedongsongo, Ungaran, Central Java.
MATERIALS AND METHODS
Sampling. Sampling was carried out on one of the hot spring, namely WGS-2, at Gedongsongo that located along the southern flank of Ungaran volcano, Central Java (110o20’23.4"E; 07o12’08.5"S; and the altitude 1400 m). This hot spring has temperature at 70.2 oC and a pH 5.85.
For the filtration procedure, the water sample was kept in a sterile plastic container and brought to the laboratory immediately within 2 hours. Afterwards, cells were harvested by filtration of 1 L volumes of spring water gently through 0.2 µm Millipore filters. Filtrates containing bacterial communities were stored at -20 oC until DNA was extracted. The cultivation procedure was carried out using two minimal media. The GS-A medium contains 0.15% (w/v) tryptone and 0.15% (w/v) yeast extract, while the GS-B medium contains 0.5% (w/v) peptone, 0.25% (w/v) yeast extract, and 0.5% (w/v) NaCl. Both media, which used natural hot spring water, were incubated at 60 oC without shaking for 24 hours.
DNA Extraction. Cells from spring water that had been collected on a membrane filter were harvested by putting the filter in a sterile Erlenmeyer that contained 10 ml sterile distilled water. The Erlenmeyer was then shaked gently and the membrane surface was scrubbed aseptically using Ose needle for a couple times until almost all of the cells were suspended in water. Each microbial sample was pelleted by centrifugation at 8000 x g for 15 min. DNA was extracted
using slight modification of the Klijn et al. (1991) method. The pellet was suspended in 200 ìl of 10 mM Tris HCl buffer (pH 8.0) containing 8 mg ml-1 of lysozyme and incubated at 37 oC for 1 h. The cells were lysed by adding 200 ìl lysis buffer containing 2% (w/v) SDS, 0.8 mg ml-1 proteinase K and 200 mM EDTA pH 8.0. The lysis process was carried out at 50 oC for 30 min. The purification step was performed by adding 200 µl of chloroform:isoamyl-alcohol (24:1), vortexed and then centrifugated at 12,000 xg, for 30 sec. The upper solution was moved to a clean tube. This step was done 3x. Subsequently, the DNA was precipitated by adding 60 ìl of 3 M sodium acetate and 1 ml of 96% (v/v) ethanol (stored at -20 oC). After centrifugation at 12,000
xg for 15 min, the DNA pellet was washed with 70% (v/v) ethanol and finally dissolved in 50 ìl of TE buffer (10 mM Tris HCl [pH 8.0], 1 mM EDTA).
Amplification of 16S rRNA Gene Fragments. Partial 16S rRNA genes was amplified as described previously by Ferris et al. (1996). A set primer (P1 and P2) was used to amplify the gene. One primer (P1: 5’ ATGGCTGTCGTCAGCT 3’) complements on the conserved region among the Bacteria domain of Escherichia coli 16S rRNA at positions 1055 to 1070. The other primer (P2: 5’ CGCCCGCCGC GCCCCGCGCC CGGCCCGCCG CCCCCGCCCC ACGGGCGGTGTGTAC 3’) is based on a universal conserved region of the E. coli 16S rRNA at positions 1392 to 1406, with the addition of 40-bases of GC clamp. The specificity of this primers is imparted by
the underlined regions. PCRs were performed by using cloned Pfu DNA polymerase according to the instructions provided by the manufacturer (Promega). The temperature cycle for the PCR was 1 min of denaturation at 94 oC, 1 min of annealing, and 1 min of primer extension at 72 oC. During an initial touchdown cycle, the annealing temperature was continually decreased from 53 to 43 oC in intervals of 1 oC per cycle; 20 additional annealing cycles were done at 43 oC. The final extension at 72 oC was performed for 10 min.
Denaturing Gradient Gel Electrophoresis. All reagents and techniques were performed as described by Ferris et al. (1996) with small modification. Acrylamide gels (8%) were prepared and run with 0.5x TAE buffer (0.04 M Tris base, 0.02 M sodium acetate, and 1.0 mM EDTA; pH adjusted to 7.4). An Ingeny Phor U gel electrophoresis unit was used with glass plates (16 by 18 cm), 1.0-mm spacers, and 1-cm-wide loading wells. A 15 liter aquarium served as the lower buffer chamber. DGGE gels contained a 35 to 60% (w/v) gradient of urea and formamide (UF) solution increasing in the direction of electrophoresis. A 100% UF solution is defined as 40% (v/v) formamide plus 7.0 M urea. DGGE was conducted at 60 oC, firstly at 20V for 10 min and then at a constant voltage of 200 V for 3 hours. The gel was stained using a silver staining (Bassam et al. 1991).
Re-PCR of DGGE Bands. The bands (from the fresh gel) were cut and added 50 ìl sterile deionized water and allowed DNA to passively diffuse into the water at 4 oC overnight and then 5 ìl of eluted fraction was used as template DNA in a PCR (Ferris et al. 1996; Nakatsu et al. 2000). For the gels that keeps in dry form and storage for a couple months, these dry gels were placed in vial, added water and heated at boiling water for 5 minute. After that, the gels were punched using the end of tips and allowed to passively diffuse into the water at 37 oC overnight.
Sequence Analysis. All confirmed DGGE bands were subjected to double-stranded DNA sequencing. Sequencing were carried out in an ABI PrismR 3100 Genetic Analyzer (Applied Biosystem) by the Macrogen Sequencing Service (Korea). The sequencing reaction was performed with the BigDye Terminator Cycle Sequencing Ready Reaction Kit (Applied Biosystem) using forward primer (P1). The sequencing results were subjected to analyzing and comparing to the GenBank (NCBI) using the BLAST N program (Atschul et al. 1997). The phylogenetic tree was constructed by ClustalW methods from MegAlign program of DNA STAR.
RESULTS
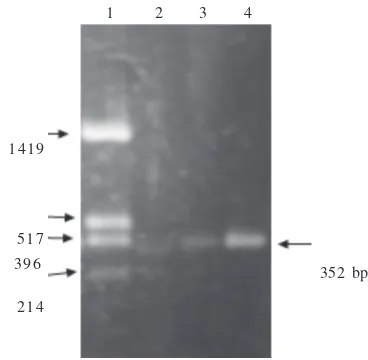
bromide-stained agarose gel, and the results showed a single band of the expected size as expected (Figure 1).
Profiles of 16S rRNA Gene Fragments. The profiles of the bacterial community of the WGS-2 hot spring from filtration and cultivation were shown in Figure 2. In order to get the finest profile of the bands, it has been carried out several electrophoresis procedures using different range of gradients. The best DGGE profile that is showed in this report was obtained using gels containing a 35 to 60% (w/v) gradient of urea and formamide. The DGGE patterns showed that there were three distinct bands that appear in each well (GS-F, GS-A, and GS-B). The other three weak bands (G4, G5, and G6) appeared in the GS-A well (Figure 2). The fragment DNA from G1-G12 bands was recovered from the DGGE gel and reamplified using primers P1 and P3. The sequence of P3 is similar to that of P2 but without the GC clamp (5’ CACGGGCGGTGTGTAC 3’). The re-PCR amplicons appeared as single bands with the size as expected (data not shown). DNA fragments on DGGE could be stored as dry gels and were stable until a few months for reamplification (Figure 3).
DNA Sequences and Homology of 16S rRNA Gene Fragments. All of the re-PCR results (G1 to G12) have been sequenced and analyzed. Those sequences have been compared with another 16S rRNA gene sequence of domain Bacteria using the program BLASTN program at NCBI website. Most of the bands (G1, G2, G3, G8, G9, G10, G11, and G12) except for G7, showed high homology to each other and were closely related to 16S rRNA gene of Thermus species (Figure 4). However, homological study of the last four bands (G4, G5, G6, and G7) revealed some unique sequences that closely related to uncultured bacteria (Table 1, 2, 3, and 4). The nucleotide sequences of G4 and G5 are very similar to each other. Of 300 bp that has been compared around 15% of these sequence have match with 138 and 109 sequences of 16S rRNA gene to G4 and G5 respectively, at the downstream of the gene fragment. The sequence of G6 has 80% similarity to that of Burkholderia sp. CCBAU23014 (Table 3). The 300 bp of G7 sequence has only a 10% match
Figure 1 Electrophoregram of PCR product. Lane 1 shows plasmid DNA pUC19 digested with HinfI; lane 2, 3, and 4 show PCR products from GS-A, GS-B and GS-F DNA respectively.
1 2 3 4
392 bp 1419
517 396
214
G7 G11 G12 G2
G1 G3 G4 G5 G6
GS-B GS-A GS-F
Figure 2 DGGE patterns of PCR-amplified 16S rDNA fragments. Well 1, 2, and 3 are 16S rDNA fragment from GS-B, GS-A, and GS-F respectively, while G1-G12 are bands position on DGGE.
G8 G9 G10
Figure 4 Comparison analysis of the sequence of G1, G2, G3, G8, G9, G10, G11, and G12 with some Thermus sp. using MegAlign Program. The difference are shown by dashed line box. a. The upstream part of 300 nucleotides. There are some deletion of G1, G2, and G3 that differ to other sequences. b. The downstream part of 300 nucleotides. There are some substitution of G8, G9, and G10 that differ to other sequences.
a
b
1419
517 396
214
352 bp
Figure 3 Electrophoregram of re-amplified DGGE bands (without GC clamp) using modified method of different age of dry gel. Lane 1 shows plasmid DNA pUC19 digested with HinfI; lane 2 from gel age 3 months that stored in water and keep in -20 oC until 10 months,
lane 3 from gel age 10 months and lane 4 showed fragment DNA from gel age 3 months.
with some 16S rRNA gene sequences from uncultured bacteria (101 related sequences), all of them showed a consistent match to upstream portion of the G7 sequence.
DISCUSSION
The microbial community was performed using dependent and independent methods. The culture-dependent method used enrichment media GS-A and GS-B. Both of them are not specific media. The use of these media was design to pick various kinds of microbes.
The DGGE profile shown in Figure 2 revealed that three distinct bands from each well are aligning to each other and possibly mean that these bands represent the same and predominant bacteria that survive in this spring. However, the other three bands (G4, G5, and G6) in the GS-A well do not appear in GS-F, possibly due to fact that these bands represent microorganism that is not dominant in the spring but has high grown rate on GS-A medium.
From the results of BLASTN program analysis on 300 bp of each band, three distinct DGGE bands from each well, except for G7, are closely related to Thermus sp., the highest similarity of these sequences belongs to Thermus RH 0401 (accession number: AY731822). The analysis showed that
Figure 5 Phylogenetic tree of DGGE bands. The bands of G1, G2, G3, G8, G9, G10, G11, and G12 are closely related to Thermus sp. while G4, G5, G6, and G7 making some new branch.
G8-P1_DGGE band.seq
Thermus sp. RH-0401.SEQ
Thermus sp. Y55-12.seq
Thermusigniterrae.SEQ
Thermusaquaticus YT-1.seq
Thermusoshirnai.SEQ
Kartchner caverns bac HI-04.SEQ
Escherichia coli.SEQ
Uncult Alteromonadaceae cl 150-0348.seq Uncl gamma Proteobacterium B2M60.SEQ
Burkholderia sp. CCBAU23014.SEQ
Burkholderiacepacia.SEQ
Table 1 The comparison study of G4 sequence. About 15% of 300 bp at downstream position of G4 sequence have a consistency match with about 138 sequences of 16S rRNA gene of mostly uncul-tured bacteria. This table only shows ten of the highest homology sequence
Uncultured gamma Proteobacterium B2M60 16S ribosomal RNA gene, partial sequence
Uncultured gamma Proteobacterium clone ST9-55D 16S ribosomal RNA gene, partial sequence
Acinetobacter sp. c61 gene for 16S rRNA, partial sequence
Uncultured Desulfohalobiaceae bacterium clone 2.88M_24B 16S ribosomal RNA gene, partial sequence
Clostridium sp. SP3 16S ribosomal RNA gene, partial sequence
Uncultured bacterium clone DX49 16S ribosomal RNA gene, partial sequence Uncultured bacterium clone DX63 16S
ribosomal RNA gene, partial sequence Uncultured bacterium clone DX53 16S
ribosomal RNA gene, partial sequence Uncultured thermal soil bacterium clone YNPFFP50 16S ribosomal RNA gene, partial sequence
Uncultured bacterium clone GC113.16 16S ribosomal RNA gene, partial sequence
95.6
Table 2 The comparison study of G5 sequence. About 15% of 300 bp at downstream position of G5 sequence have a consistency match with about 109 sequences of 16S rRNA gene of mostly uncul-tured bacteria. This table only shows ten of the highest homology sequence
Uncultured gamma ProteobacteriumB2M60 16S ribosomal RNA gene, partial sequence Clostridium sp. SP3 16S ribosomal RNA
gene, partial sequence
Uncultured bacterium clone DX49 16S ribosomal RNA gene, partial sequence Uncultured bacterium clone DX63 16S
ribosomal RNA gene, partial sequence Uncultured bacterium clone DX53 16S
ribosomal RNA gene, partial sequence Uncultured bacterium clone tls3-13 16S
ribosomal RNA gene, partial sequence Uncultured bacterium clone tls1-5 16S
ribosomal RNA gene, partial sequence Uncultured gamma Proteobacterium clone
ST9-55D 16S ribosomal RNA gene, partial sequence
Acinetobacter sp. c61 gene for 16S rRNA, partial sequence
uncultivable bacteria. This sequence has the highest similarity (80%) to Burkholderia sp. CCBAU23014 16S ribosomal RNA gene (accession number: AY839565.1) (Table 3). Actually, Burkholderia is a diverse genus with diverse species that live in diverse ecological niches. The molecular and physiological baackground of this diversity and adaptability are largely unknown. Multiple biotechnologically interesting strains belong to as yet uncharacterized taxa (Coenye and Vandamme 2003).
The other bands (G4, G5, G7) have a low similarity (about 10-15%) to some 16S rRNA gene sequences of unculturable bacteria. However, these sequences showed at consistent position with some 16S rRNA genes (Table 1, 2, and 4). Even though the similarity of these bands is only at around 10-15%, but all of them are similar to 16S rRNA genes and none of them represent another gene sequences (138 sequences for G4, 109 sequences for G5, and 101 sequences for G7). This data suggests that the G4, G5, and G7 sequences are part of the16S rRNA gene.
From the result of the phylogenetic tree (Figure 5), the G4, G5, G6, and G7 made separate branch in the tree. The reason for the forming separated branch might due to some unique bases that unreaveld in in other 16S rRNA gene that compiled in BLAST. These unique bases include some substitutions along the sequence and the glaring difference of the insertion and deletion of the bases at the middle position of the sequences (the relative position of the E. coli at position 1250-1280). Surprisingly, although G6 has the highest similarity with the Burkholderia sp. CCBAU23014, this sequence did not share the same branch as some Burkholderia sp. in the tree. It suggested that G6
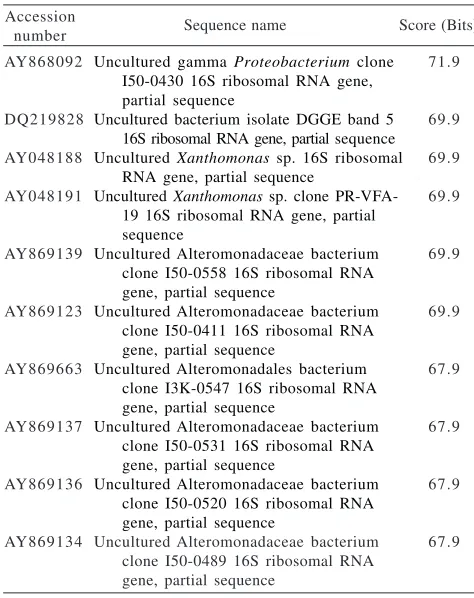
Table 4 The comparison study of G7 sequence. About 10% of 300 bp at upstream position of G7 sequence have a consistency match with about 101 sequences of 16S rRNA gene of mostly uncultured bacteria. This table only shows ten of the highest homology sequence
AY868092
Uncultured gamma Proteobacterium clone I50-0430 16S ribosomal RNA gene, partial sequence
Uncultured bacterium isolate DGGE band 5 16S ribosomal RNA gene, partial sequence Uncultured Xanthomonas sp. 16S ribosomal
RNA gene, partial sequence
Uncultured Xanthomonas sp. clone PR-VFA-19 16S ribosomal RNA gene, partial sequence
Uncultured Alteromonadaceae bacterium clone I50-0558 16S ribosomal RNA gene, partial sequence
Uncultured Alteromonadaceae bacterium clone I50-0411 16S ribosomal RNA gene, partial sequence
Uncultured Alteromonadales bacterium clone I3K-0547 16S ribosomal RNA gene, partial sequence
Uncultured Alteromonadaceae bacterium clone I50-0531 16S ribosomal RNA gene, partial sequence
Uncultured Alteromonadaceae bacterium clone I50-0520 16S ribosomal RNA gene, partial sequence
Uncultured Alteromonadaceae bacterium clone I50-0489 16S ribosomal RNA gene, partial sequence Table 3 The comparison study of G6 sequence. This sequence
has matches to 163 sequences of 16S rRNA gene. The 300 bp of G6 sequence has the highest similarity (at around 80%) to the
Burkholderia sp. CCBAU23014 Accession
Burkholderia sp. CCBAU23014 16S ribosomal RNA gene, partial sequence Uncultured bacterium clone PB 357-359/
17 16S ribosomal RNA gene, partial sequence
Uncultured gamma proteobacterium B2M60 16S ribosomal RNA gene, partial sequence
Clostridium sp. SP3 16S ribosomal RNA gene, partial sequence
Uncultured bacterium clone BG.d4 16S ribosomal RNA gene, partial sequence Endophyte bacterium SS14 16S ribosomal
RNA gene, partial sequence
Uncultured bacterium clone PB 357-359/ 25 16S ribosomal RNA gene, partial sequence
Pseudomonas aurantiaca strain YC4963 16S ribosomal RNA gene, partial sequence P. aurantiaca VKM B-816T 16S
ribosomal RNA gene, partial sequence Pseudomonas sp. Eur1 9.41 16S ribosomal RNA
gene, partial sequence
these bands have high similarity (97-99%) to at least 100 sequences of 16S rRNA genes of both culturable and unculturable of Thermus sp.
The comparison of G1-G3 and G8-G12 sequences toward some Thermus sp. sequences using MegAlign Program revealed some differences from each sequences (Figure 4). In spite of different position at the DGGE and there are some different nucleotides (substitution), the three bands from each well i.e.: G1-G2-G3, G8-G9-10, and G11-G12 seemed to represent the same species. A possible reason for the formation of more than one band from one species is that the universal primers amplified more than one operon (Schmalenberger et al. 2001). It is well known that several bacterial species contain more than one 16S rRNA gene in their genomes (Klappenbach et al. 2001). The heterogeneity of 16S rRNA gene between multiple copies within one species hampers pattern analysis (McCaig et al. 2001), and can confuse the interpretation of diversity from sequences retrieved from banding patterns.
Although there is single or more differences on base sequence of these DGGE bands to each other, all of them showed the same highest similarity with Thermus RH 0401. This evidence could not bring into the conclusion whether these DGGE bands sequence lead to the same species or not, but it could not be opposed that these bands represent Thermus species. The phylogenetic study that constructed using ClustalW method revealed that the sequence of eight distinct bands are close to Thermus group. This evidence could be seen in phylogenetic tree (Figure 5).These data suggested that this hot spring was possibly occupied by Thermus predominantly. In addition, data from both culture media are also dominated by these species.
did not belong to 16S rRNA of Burkholderia species. This is supported by the analysis result which only showed similarity to Burkholderia sp. CCBAU23014 and not to another Burkholderia. In fact, the BLAST analysis of G6, as shown in Table 3 was moderately similar to Pseudomonas sp. Based on the phylogenetic tree and comparison study profile, the last four bands (G4, G5, G6, and G7) are highly recommended as 16S rRNA genes sequence from novel species. The far branch at phylogenetic tree for these four bands suggest that these bands representing not only a new species but possibly a new genus or family. These sequence analyses of rRNA genes from natural microbial communities have identified a broad diversity of previously unknown microorganisms. Currently, about half of the >70,000 rRNA sequences in the public databases represent uncultured microorganisms (Cole et al. 2003). More than one-third of the 40 to 50 main relatedness group, natural divisions, of the domain Bacteria are known only from detection of rRNA gene sequences and have no described cultivated representatives. These division-level clades with no cultured representatives, typically known from only limited numbers of rRNA sequences, have been termed candidate divisions to reflect the limited documentation that describes them (Hugenholtz et al. 1998).
ACKNOWLEDGEMENT
This study was funded by “Proyek Peningkatan Penelitian Pendidikan Tinggi (P4T)”, Department of National Education, Indonesia (Contract No. 321/P4T/DPPM/HPTP/IV/2004) and BPPS scholarship to ALNA.
REFERENCES
Altschul SF. 1997. Gapped BLAST and Psi BLAST: a new generation of protein protein database search programs. Nucleic Acid Res
25:3384-3402.
Amann RI, Ludwig W, Schleifer KH. 1995. Phylogenetic identification and in situ detection of individual microbial cells without cultivation. Microbiol Rev 59:143-169.
Bassam BJ, Anolles CG, Greshoff PM. 1991. Fast and sensitive staining of DNA in polyacrylamide gels. Anal Biochem 196:80-83. Bull AT, Hardman DJ. 1991. Microbial diversity. Curr Opin Biotechnol
2:421-428.
Coenye T, Vandamme P. 2003. Diversity and significancy of
Burkholderia species occupying diverse ecological niches. Env Microbiol 5:719-729.
Cole JR et al. 2003. The ribosomal database project (RDP-II): previewing a new auto aligner that allows regular updates and the new prokaryotic taxonomy. Nucleic Acids Res 31:442-443. Ferris MJ, Kühl M, Wieland A, Ward DM. 2003. Cyanobacterial
ecotypes in different optical microenvironments of a 68°C hot spring mat community revealed by 16S-23S rRNA internal transcribed spacer region variation. Appl Environ Microbiol
69:2893-2898.
Ferris MJ, Muyzer G, Ward DM. 1996. Denaturing gradient gel electrophoresis profiles of 16S rRNA-defined populations inhabiting a hot spring microbial mat community. Appl Environ Microbiol 62:340-346.
Fuhrman JA, McCallum K, Davis AA. 1993. Phylogenetic diversity of subsurface marine microbial communities from the Atlantic and Pacific Oceans. Appl Environ Microbiol 59:1294-1302. Heuer H, Krsek M, Baker P, Smalla K, Wellington EM. 1997. Analysis
of actinomycete communities by specific amplification of genes encoding 16S rRNA and gel-electrophoretic separation in denaturing gradients. Appl Environ Microbiol 63:3233-3241.
Hugenholtz P, Pitulle C, Hershberger KL, Pace NR. 1998. Novel division level bacterial diversity in a Yellowstone hot spring. J Bacteriol 180:366-376.
Klappenbach JA, Saxman PR, Cole JR, Schmidt TM. 2001. The ribosomal RNA operon copy number database. Nucleic Acid Res
29:181-184.
Klijn N, Weerkamp AH, de Vos WM. 1991. Identification of mesophilic lactic acid bacteria by using polymerase chain reaction-amplified variable regions of 16S rRNA and specific DNA probes.
Appl Environ Microbiol 57:3390-3393.
Kowalchuk GA et al. 1997. Analysis of ammonia-oxidizing bacteria of the beta subdivision of the class Proteobacteria in coastal sand dunes using denaturing gradient gel electrophoresis and sequencing of PCR amplified 16S rDNA fragments. Appl Environ Microbiol
63:1489-1497.
Liesack W, Stackebrandt E. 1992. Occurrence of novel groups of the domain Bacteria as revealed by analysis of genetic material isolated from an Australian terrestrial environment. J Bacteriol
174:5072-5078.
McCaig AE et al. 1999. Nitrogen cycling and community structure of proteobacterial â-subgroup ammonia-oxidizing bacteria within polluted marine fish farm sediments. Appl Environ Microbiol
65:213-220.
McCaig AE, Glover LA, Prosser JL. 2001. Numerical analysis of grassland bacterial community structure under different land management regimens by using 16S ribosomal DNA sequences data and denaturing gradient gel electrophoresis banding patterns.
Appl Environ Microbiol 67:4554-4559.
Moyer CL, Dobbs FC, Karl DM. 1995. Phylogenetic diversity of the bacterial community from a microbial mat at an active, hydrothermal vent system, Loihi Seamount, Hawaii. Appl Environ Microbiol 61:1555-1562.
Muyzer G. 1999. DGGE/TGGE a method for identifying genes from natural ecosystems. Curr Opin Microbiol 2:317-322.
Muyzer G, De Wall EC, Uitterlinden AG. 1993. Profiling of complex microbial population by denaturing gradient gel electrophoresis analysis of polymerase chain reaction-amplified genes coding for 16S rRNA. Appl Environ Microbiol 59:695-700.
Myers RM, Fischer SG, Lermani LS, Maniatis T. 1985. Nearly all single base substitutions In DNA fragments joined to a GC-clamp can be detected by denaturing gradient gel electrophoresis. Nucleic Acid Res 13:3131-3145.
Nakatsu CH, Torsvik V, Øvrea’s V. 2000. Soil community analysis using DGGE of 16S rDNA polymerase chain reaction products.
Soil Sci Soc Am J 64:1382-1388.
Pace NR. 1997. A molecular view of microbial diversity and the biosphere. Science 276:734-740.
Pace NR, Stahl DA, Lane DJ, Olsen GJ. 1986. The analysis of natural microbial populations by ribosomal RNA sequences. Adv Microb Ecol 9:1-55.
Schmalenberger A, Schwieger F, Tebbe C. 2001. Effect of primers hybridizing to different evolutionarily conserved regions of the small-subunit rRNA gene in PCR-based microbial community analyses and genetic profiling. Appl Environ Microbiol 67:3557-3563.
Schmidt TM, DeLong EF, Pace NR. 1991. Analysis of marine picoplankton community by 16S rRNA gene cloning and sequencing. J Bacteriol 173:4371-4378.
Staley JT, Konopka A. 1985. Measurement of in situ activities of non-photosynthetic microorganisms in aquatic and terrestrial habitats. Ann Rev Microbiol 39:321-346.
Stephen JR et al. 1998. Analysis of â-subgroup proteobacterial ammonia oxidizer populations in soil by denaturing gradient gel electrophoresis analysis and hierarchical phylogenetic probing.
Appl Environ Microbiol 64:2958-2965.
Ueda K et al. 2001. Distribution and diversity of symbiotic thermophiles, Symbiobacterium thermophilum and related bacteria, in natural environments. Appl Environ Microbiol
67:3779-3784.
Watanabe K, Teramoto M, Futamata H, Harayama S. 1998. Molecular detection, isolation, and physiological characterization of functionally dominant phenol-degrading bacteria in activated sludge. Appl Environ Microbiol 64:4396-4402.
Woese CR. 1987. The universal ancestor. Proc Natl Acad Sci USA