Abstract—This paper presents a method that jointly performs stereo matching and inter-view interpolation to obtain the depth map and virtual view image. A novel view synthesis method based on depth map layers representation of the stereo image pairs is proposed. The main idea of this approach is to separate the depth map into several layers of depth based on the disparity distance of the corresponding points. The novel view synthesis can be interpolated independently to each layer of depth by masking the particular depth layer. The final novel view synthesis obtained with the entire layers flattens into a single layer. Since the image view synthesis is performed in separate layers, the extracted new virtual object can be superimposed onto another 3D scene. The method is useful to imply free viewpoint video application with a small number of camera configurations. Based on the experimental results, it shows that the algorithm improve the efficiency of finding the depth map and to synthesis the new virtual view images.
Index Terms—Depth map, free viewpoint video, stereo camera, stereo matching algorithms, view synthesis.
I. INTRODUCTION
With the new development in the display and camera technology, 3D video systems are getting a wide attention. However depending on the system, the number of cameras is limited and it can only describe 3D scene from specific visual angle. The looking around effect based on free visual angle obtained from the composition of intermediate view. The intermediate view synthesis composes the image that locates in the virtual viewpoint between source image viewpoints [1]. Most existing intermediate view synthesis algorithms emphasize in disparity estimation [2]. Many methods for the stereo matching algorithms have been proposed with the taxonomy presented by Scharstein and Szeliski [3]. The latest trends in the field mainly pursue real-time execution speeds, as well as decent accuracy.
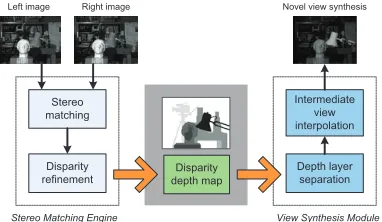
This paper proposes a novel intermediate view synthesis method based on disparity estimation depth map layers. It contains two stages: stereo matching engine and view synthesis module. In the first stage, disparity estimation through area-based stereo matching algorithm is adopted to obtain the disparity depth map. It will undergo the stereo matching computation and disparity refinement process. In the second
stage, a new strategy of view synthesis is presented. It will separate the depth layer of the disparity depth map based on the disparity range. The layers divided into three main regions: foreground, background and occluded regions using image histogram distribution. The foreground regions contain with several layers depending on the complexity of the disparity depth map. The linear interpolation is used to the regions in different modes according to the characteristic of each region. After each of the layers has been interpolated, the layers flatten into a single novel view images.
Left image Right image
Stereo matching
Disparity refinement
Stereo Matching Engine
Disparity depth map
Intermediate view interpolation
Depth layer separation
View Synthesis Module
Novel view synthesis
Figure 1: System design of novel view synthesis based on depth map layers representation
The overall proposed system design for matching and novel view synthesis is shown in Figure 1. Generally, it consists of acquisition, rectification, calibration, stereo matching engine and view synthesis module. The system requires a stereo pair using two synchronized cameras to acquire image and video. The algorithm requires pairs of rectified images, so that corresponding epipolar lines are horizontal and on the same height. The system has been adopted for smart video surveillance system, which connected to a pan-tilt-zoom camera [4].
The background necessary to understand the stereo matching is first presented in Section II. In Section III, the novel view synthesis with stereo matching data for 3D video and virtual view images is developed. In Section IV, results obtained from testing and comparing with the sample of data from Tsukuba [5] and Szelinski [6] presented and discussed, followed by a conclusion in Section V.
Nurulfajar Abd Manap
1, John J. Soraghan
21Faculty of Electronic and Computer Engineering, Universiti Teknikal Malaysia Melaka, Malaysia
2Centre of Excellence in Signal and Image Processing (CeSIP), University of Strathclyde, UK
II.STEREO MATCHING ALGORITHM
The main aim of stereo matching algorithms is to find homologous points in the stereo pair [7]. In stereo correspondence matching, the two images of the same scene are taken from slightly different viewpoints using two cameras that placed in the same lateral plane. Therefore, for most pixels in the left image, there is a corresponding pixel in the right image in the same horizontal line. The matching points reside on corresponding horizontal lines upon on calibrated stereo setup. The difference in the coordinates of the corresponding pixels is known as disparity, which is inversely proportional to the distance of the objects from the camera.
The disparity is calculated as the distance of these points when one of the two images is projected onto the other. The disparity values for all the image points produce a disparity map. A disparity map is typically represented with a grayscale image, where the closer points are brighter, as shown in Figure 2. Once the stereo correspondence problem is solved, the depth of the scenery can be estimated. Based on the computational stereo, the 3D geometry of a scene from two or more views can be reconstructed.
XR XT
Reference Target Disparity depth map
Figure 2: The disparity depth map
The matching pixels can be found by searching the element in the right image, which is the most similar (according to similarity metric) to a given element in the left image (a point, region or generic feature). Disparity is conventionally determined based on matching windows of pixels by using some of familiar similarity metric such as, sum of absolute differences (SAD), sum of square differences (SSD) or normalized correlation techniques. In order to determine the correspondence of a pixel in the left image using SSD, SAD or normalized correlation techniques, the window costs are computed for all candidate pixels in the right image within the search range. The pixel in the right image that gives the best window cost is the corresponding pixel of the left image. In this research, the SAD metric is selected for faster execution and low consumption.
Area-based (or correlation-based) algorithms match small image windows centered at a given pixel, assuming that the grey levels are similar [8]. It yields dense depth maps, but not performed very well within occluded areas and poorly textured regions. Feature-based algorithms match local cues (edges, lines, corners) and can provide robust, but sparse disparity maps requiring interpolation. These approaches rely on feature extraction.
Several factors make the correspondence problem difficult including inherent ambiguity that requires the introduction of physical and geometrical constraints. Other common problems in correspondence [x] are the occlusions, which points in one image with no corresponding point in the other; photometric
distortions when the pixels projection of a world point on the two images, have different intensities; and projective distortion that makes the projected shapes different in two images.
Disparity information plays a crucial role in synthesizing intermediate views from stereoscopic images. The synthesized view quality depends mainly on the accuracy of disparity estimation [9]. This paper also presents a robust area-based algorithm, addressing the problems in the correspondence matching while obtaining accurate disparities map. Robust disparity estimates in the presence of occlusions are achieved with the left-right consistency check [7]. The area-based method is selected because the disparity information for every pixel is required to synthesize the new virtual view. The block matching is applied where correspondence analysis is carried out on squared blocks of pixels. The disparity estimation process based on SAD correlation, left-right consistency check and the disparity refinement is described in the next section.
A. Stereo Disparity Estimation
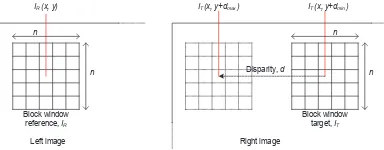
Assuming the stereo pair in the same epipolar line, the disparity estimation is performed by using the fixed-size window. The SAD function is defined as follows
∑
reference (left) and target (right) image respectively, window size of nxn, and dis the disparity. The best disparity value is determined using the minimum SAD value. The conventional way to calculate the matching correspondence point is to fix a point and vary d in the disparity range to calculate the matching costs. Then simply picks d with the smallest matching cost as the final disparity at this point. This method is also known as winner-take-all (WTA). As illustrated in Figure 3, the algorithm firstly sets one particular fixed value for dfor all the points, and the matching costs are calculated for each image row. Then by varying the d, the process is repeated until the value of dhas iterated through the complete disparity range. Consequently a two-dimensional matrix containing the SAD values for each image row is obtained. The width of the matrix is the same as the length of image row, and the height of the matrix is the disparity range.Block window
Figure 3: Matching costs computation based on window size, nxn
and disparity range, dwith left image as reference and right as target
To ensure the consistency and accuracy of the disparity map, the matching process is performed in both directions. At the first stage, the left image is selected as the reference image and the right image as the target. The disparity map for this matching referred to as left to right disparity map, dLR. A similar process is performed by having the right as reference and left as the target to obtain the disparity map, dRL. The result from both matching will be used for the next stage in the left-right consistency check.
B. Stereo Depth Map Refinement
A typical method to deal with occlusion is bidirectional matching [10]. In the paper presented by Fua [11], two disparity maps are created related to each image: one for left to right (dLR) and another for right to left (dRL), as described in the previous section. Matches which are consistent between the two disparity maps are kept. This technique also known as left-right consistency (LRC) check, performed to eliminate the half-occluded pixels in the final disparity map. It is executed by taking the computed disparity value in one image and re-projecting it in the other image. If the difference in the value is less than a given threshold, then the pixels are half-occluded.
When searching for conjugate pairs, only the visible points in on image are matched. If the role of left and right images is reversed, new conjugate pairs are found. The left-right consistency check states that feasible conjugate pairs are those found with both direct and reverse matching. In reverse matching, the conjugate pairs are equivalent to the uniqueness constraint, which states that each point on one image can match at most one point on the other image. Consider for instance an occluded point in B, in the left image of Figure 4 [9]. Although it has no corresponding point in the right image, the matching cost minimization matches it to some point C’. With reverse matching, it corresponds to a different point in the left image. However, this information is available only searching from right to left.
Left image (Reference),IR Right image (Target),IT
x
xx
x
x
A A’
BC C’
Figure 4: Occlusions in the left and right image
In a stereo pair occlusions can create points that do not belong to any corresponding pixels. In many cases occlusions occur at depth discontinuities, where the occlusions on one image correspond to disparity jumps on the other. In the human visual system occlusions can help to detect object boundaries. However in computational stereo processing it is a major source of errors. Left-right consistency check is performed to reduce the half-occluded pixels in the final disparity map. This can be performed by taking the computed disparity value in one image and re-projecting it in the other image. In this approach, occlusions are detected by the left-right consistency check while suppressing unfeasible matches.
If the disparity is computed following (2) with threshold τ=1, then the new disparity map keeps its computed left disparity and defined as dLRC=dLR(x), otherwise it is marked as occluded [6]. The value of τ set to 1 to ensure that there are exact pixel similarities between the left-right and right-left disparity depth maps.
τ
x d x d x
dLR( )− RL( + LR())< (2)
The disparity maps are refined by using image filtering techniques without explicitly enforcing any constraint about the underlining disparity maps. A common image filtering operator used is the median filter due to the fact that it preserves edges whilst removing noise [12]. The filtering of the disparity map can improve the results in weakly textured regions, where the signal to noise ratio is low and often some pixels are rejected although the disparity can correctly be estimated in the neighbourhood. Figure 5(a) shows the disparity depth map without the filtering process. As indicated in Fig 5(b) the depth map after the filtering process significantly reduces the noise while smoothen out the depth map. The filtering of the disparity map can improve the results in weakly textured regions, where the signal to noise ratio is low. The final disparity depth map after the stereo refinement known as the dLRC,used to obtain the novel view synthesis that will be discussed in the next section.
(a) (b)
Figure 5: Stereo camera configuration
III. NOVEL VIEW SYNTHESIS
Baseline,
Figure 6: Stereo camera configuration
Referring to Figure 6, OL=(UL,VL)is the reference camera centre point (or the left camera), while OR=(UR,VR) is the target camera centre point. The implementation of this system is based on parallel cameras, which are shifted along the same horizontal line or x-coordinate, known as the epipolar line whereVL=VR. The symbol fis the focal length of cameras’ lens (the distance from camera centre point to the image plane) and
B is the baseline distance (distance between two optical centers, OL and OR). The disparity of the stereo images is obtained as difference between the two corresponding points,
ULand UR:
The location of correct projections of the same point Pon the two image planes can determine the exact depth of Pin the real world. From (3), the depth zis defined as
d Bf
z=( )/ (4)
From (4), the equations used to calculate the exact 3D location of P=(x,y,z) with respect to the stereo cameras are:
d
The disparity is higher for points closer to the cameras. The disparity will vary for different depth and distance of the object. The range field of the system is constrained by the disparity range [dmin, dmax]. The depth measured discretized into parallel planes (one for each disparity value). The range field for different disparity and depth is shown in Figure 7. Based on the different layers of depth, the layers can be separated to focus on particular points or objects on the scene. The layers of disparity for Map image through the disparity range can be shown in the example in Figure 8.
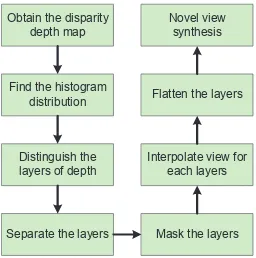
The process of novel view synthesis based of different layers of depth disparity can be simplified in the block diagram shown in Figure 9. It consists of steps to create novel view synthesis based on the disparity depth map starting by obtaining the disparity depth map through stereo matching algorithm and estimate the number of elements of the disparity depth map with the histogram distribution. The resultant of the distribution can be used to determine the layers of the depth. The layers separated based on the disparity range and with
some constraints defined in the proposed algorithm. Each layers interpolated to obtain the view synthesis in the mask region from the reference and target images. At the end, all of the layers will be blend and flatten into a full single novel view synthesis. The detailed description of the block will be discussed in the next section.
(Bf)/dmin
(Bf)/dmax
Range field (horopter)
Stereo camera
Figure 7: Disparity levels on range field. Disparity is higher for points closer to camera
Layer 1
Layer 2
Layer 3
Disparity depth map
Figure 8: Different disparity levels for Mapstereo pair
Obtain the disparity
Separate the layers Mask the layers Interpolate view for
each layers Flatten the layers
Novel view synthesis
Figure 9: Block diagram of intermediate novel view synthesis
A. Stereo Disparity Estimation
layer. The separation process of the layers can be done after identifying on how many depths or layers on the disparity depth map. By having the result in the image form, the subject can be easily known through different tone of grey scale or colors. The disparity distribution can be obtained with the histogram plot. The histogram hof the disparity depth map,
dLRCis defined by
{
}
∑
== rcd rc m
m
h( ) ( , ) LRC( , ) (6)
where mspans each disparity level value and h(m)counts the number of elements in a set.
Consider the ground truth of the Map image, with the maximum disparity at 30 (Figure 10). Subjectively, there are two levels of disparity, which are the foreground and the background. The two layers of depth supported with the histogram distribution of the ground truth obtained in Figure 11. The selection of depth layers defined by
) (
0
) ;
( , 1
otherwise
k d r k d T d if
layerrange LRC r r
=
+ < < − > =
(7)
where ris the disparity depth range, kis the step size and T
is the threshold of the number of elements in each set of the disparity depth map range, dr.
Figure 10: Ground truth of Mapstereo pair
Figure 11: Histogram distribution of elements for Mapstereo pair
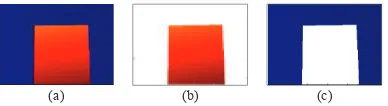
From the histogram distribution, the disparity depth range can be divided into two layers, which are in between 20-30 for the foreground (layer 1) and at 5 for the background (layer 2). In the layers separation process, the number of elements in each set must be higher than threshold, T. This can eliminate
non-significant layers for the intermediate view synthesis. As a result, each layer will have the particular area of depth as shown in Figure 12. The disparity depth layers can be treated independently to obtain the virtual view synthesis of the layer that will be explained in the next section.
(a) (b) (c)
Figure 12: Different layers of depth for Mapstereo pair. (a) Original
disparity depth map; (b) Depth layer 1; (c) Depth layer 2
B. Disparity Depth Layers Separation
In this section, a new virtual view Iv(x,y)is synthesized from two reference views IR(x,y) (reference image) and IT(x,y) (target image) with the support of the disparity depth layers. In this case, the view interpolation refers to an approximation of the correct synthetic view. The novel view synthesis interpolated independently to each layer of depth from the reference and target image pair. The pixel interpolation performed by masking the particular depth of layer. The final novel view synthesis obtained with the entire image interpolated layers blend into a single layer. Consider the image stereo pair, with the disparity depth map illustrated in
Figure 13, where the disparity value in layer 1 is
max
max k r d
d − < ≤ (ris the disparity depth range).
Image reference (left), IR Image target (right), IT
Disparity depth map
Layer 2
Layer 1 Layer 1
Layer 2
dlayer_1 dlayer_2 Disparity range
No.
of elements
Histogram distribution
Figure 13: Sample of stereo image pair (IRand IT) with its disparity depth map and the histogram distribution
The image IRand ITwill be masked with layer 1 through the mask layer (mlr) by,
range R
r r I layer
For the right image, ITtranslated to rbefore masking the layer to ensure the consistency and region of interest within the selected area. Therefore, the mask layer for the target image (right) is same with (8), with pixel translation of r.
range T
r t I translater layer
ml ()= * ()* (9)
The intermediate view synthesis of layer 1 can be obtained with (10), where tis the threshold (in this case, set to 2).
) / )) ( (( ) / )) (
((ml r t ml t t
Iview−mask−layer= r + r (10)
Each disparity depth layers undergo the same process to obtain the mask image layers. After each of the view-mask layers has been determined, the new virtual view Iv is synthesized by blending and flattening the layers into the single image. The advantage of this approach is that, since the image view synthesis performed in separate layers, the extracted new virtual object can be superimposed onto another 3D scene. The method is useful to reconstruct arbitrary viewpoints and optical flow view between two input images that close by each other.
IV. RESULTS AND DISCUSSION
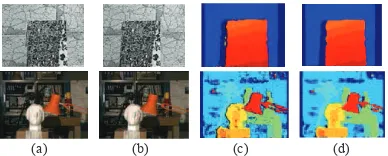
In this paper, Map and Tsukuba image pairs are used for the experimental study. The monochromatic Map data set introduced by Szelinski and Zabih [6], which was taken with a Point Grey Research trinocular stereo camera with the ground truth disparity map was computed using the piecewise planar technique [3]. The ‘head and lamp’ data set from University of Tsukuba [5] also used in this experimental. The original images are shown in Figure 14(a) and 14(b), for the left and right image respectively. The disparity depth map obtained under area-based stereo matching algorithm with left-right consistency check is shown in Figure 14(c). Median filtering use to eliminate noise and improve the disparity depth map as shown in Figure 14(d).
g g
(a) (b) (c) (d)
Figure 14: Original stereo and disparity depth map. (a) Left image; (b) Right image; (c) Depth map with LRC; (d) Filter depth map
The depth layers identified with the disparity histogram distribution plot with the maximum disparity is set to 30 for Map image and 16 for Tsukuba image. Based on subjective evaluation of the disparity depth map and the histogram distribution in Figure 13, the layers of the image can be separated into several layers. With the disparity depth layers identified and separated; the intermediate view synthesis of
each layer processed by masking the depth. For each layers, the disparity depth map will be set to 1 for each particular disparity levels, otherwise 0 as stated in (6). The novel view synthesis interpolated independently to each layer of depth based on reference and target image pair. The pixel interpolation performed by masking the particular depth of layer.
o e e o aye novel view of layer 2
(a) (b) (c) (d)
Figure 15: View synthesis on Map and Tsukuba image. (a) Mask layer 1; (b) Mask layer 2; (c) Novel view synthesis without
occlusion; (d) Final novel view synthesis
Figure 15(a) shows the intermediate view mask of layer 1, which synthesizes the foreground object from the stereo pair. The dark regions illustrated in Figure 15(a) and 15(b) evaluated as object and textures from different layers. After all layers have been interpolated, the novel synthesis of the image can be obtained by blending the layers into a single image. This process can be viewed as a decomposition disparity depth of layers. The novel view synthesis of the stereo pair is shown in Figure 15(c), where the layers flatten into a single image layer. Figure 15(d) shows the final novel synthesis, which includes the occlusion layer of the stereo pair.
V.CONCLUSION
A new method for novel view synthesis from real images using stereo matching and inter-view interpolation has been proposed. An efficient area-based stereo matching algorithm is presented that addresses robust disparity estimation in the presence of occlusions through left-right consistency to compute disparity and its associated uncertainty to eliminate false matches. A novel view synthesis method based on depth map layers representation of the stereo image pairs is proposed. The main idea of this approach is to separate the depth map into several layers of depth based on the disparity distance of the corresponding points. In the experiments, it was demonstrated that it is possible to efficiently synthesize realistic new views even from inaccurate and incomplete depth information.
REFERENCES
[1] C. Wang, et al., "A Novel Intermediate View Synthesis Method Based on Disparity Estimation," Proceeding of the first IEEE International Conference on Information Sceince and Engineering (ICISE 09), pp. 1079-1082, 2009.
[3] D. Scharstein and R. Szeliski, "A Taxonomy and Evaluation of Dense Two-Frame Stereo Correspondence Algorithms," International Journal of Computer Vision, vol. 47, pp. 7-42, 2002.
[4] N. A. Manap, et al., "Smart Surveillance System Based on Stereo Matching Algorithms with IP and PTZ Cameras," 3DTV Conference: The True Vision - Capture, Transmission and Display of 3D Video, 2010, pp. 1-4, 2010.
[5] Y. Nakamura, et al., "Occlusion Detectable Stereo - Occlusion Patterns in Camera Matrix," Conference on Computer Vision and Pattern Recognition, pp. 371-378, 1996.
[6] R. Szeliski and R. Zabih, "An Experimental Comparison of Stereo Algorithms," Vision Algorithms: Theory and Practice, number 1883 in LNCS, pp. 1-19, 1999.
[7] A. Bovik, Handbook of Image and Video Processing, Second ed.: Elsevier Academic Press, 2005.
[8] T. Kanade and M. Okutomi, "A Stereo Matching Algorithm with an Adaptive Window: Theory and Experiment," IEEE International
Conference on Robotics and Automation, vol. 2, pp. 1088-1095, April 1991 1991.
[9] A. Fusiello, et al., "Efficient Stereo with Multiple Windowing,"
Conference on Computer Vision and Pattern Recognition, pp. 858-863, 1997.
[10] L. Zitnick and T. Kanade, "A Cooperative Algorithm for Stereo Matching and Occlusion Detection," IEEE Trans. Pattern Analysis and Machine Intelligence, vol. 22, pp. 675--684, 2000.
[11] P. Fua, "Combining Stereo and Monocular Information to Compute Dense Depth Maps that Preserve Depth Discontinuities," International Joint Conference on Artificial Intelligence, pp. 1292-1298, August 1991 1991.
[12] K. Muhlmann, et al., "Calculating Dense Disparity Maps from Color Stereo Images, an Efficient Implementation," International Journal of Computer Vision, vol. 47, pp. 79-88, 2002.