IN VITRO SCREENING ASSAY OF THE ACTIVITY OF
VARIOUS TROPICAL PLANTS FOR LOWERING
METHANE PRODUCTION AND ENHANCING
RUMINAL FERMENTATION PROFILE
DIMAR SARI WAHYUNI
GRADUATE SCHOOL
BOGOR AGRICULTURAL UNIVERSITY BOGOR
DECLARATION OF THESIS AND SOURCES OF
INFORMATION AND PATENT
I, Dimar Sari Wahyuni, hereby stated that this thesis entitled in Vitro Screening Assay of The Activity of Various Tropical Plants for Lowering Methane Production and Enhancing Ruminal Fermentation Profile is real, evident and true of my own work under the guidance and direction of the supervising comittee and it has not been submitted before in any form to any colleges or universities. The content of this thesis has been examined by the advising advisory board and external examiner. Sources of information which are derived or cited either from published or unpublished scientific papers from other writers have been mentioned in the script and listed in the References at the end part of this thesis.
Along with this, I delegated the copyright of my thesis to Bogor Agricultural University.
Bogor, August 2016
Dimar Sari Wahyuni
RINGKASAN
DIMAR SARI WAHYUNI. Kajian Seleksi in vitro Aktivitas beberapa Tanaman Tropis untuk Mengurangi Produksi Metan dan Meningkatkan Profil Fermentasi Rumen. Dibimbing oleh SURYAHADI, KOMANG GEDE WIRYAWAN dan ANURAGA JAYANEGARA.
Emisi metan enterik ruminansia merupakan salah satu kontributor pemanasan global. Metan merupakan salah satu produk gas fermentasi bahan pakan yang dilakukan oleh mikroba rumen secara anaerob. Pola peternakan rakyat yang umumnya memanfaatkan hijauan kualitas rendah mengakibatkan hilangnya energi bruto pakan yang dikonsumsi ternak dan terjadi peningkatan produksi gas metan enterik akibat fermentasi pakan yang tidak optimal pada rumen. Bakteri metanogen yang menempel hidupnya dengan protozoa (host) menggunakan gas H2 yang diproduksi protozoa dan mengkonversinya menjadi CH4 (metan). Agen defaunasi yang berasal dari tanaman tropis mengandung senyawa metabolit sekunder. Penekanan populasi protozoa akan mengurangi bakteri metanogen (sifat simbiosis) juga dimungkinkan dapat mengurangi produksi gas metan dan memperbaiki karakteristik fermentasi rumen. Identifikasi dan screening tanaman tropis Indonesia yang berpotensi sebagai methane inhibitor merupakan tahap awal yang penting untuk dikaji sebagai suplemen pakan ramah lingkungan.
Kajian in vitro yang dilakukan tiga tahap (seleksi, konfirmasi dan perbandingan dosis). Kajian seleksi in vitro beberapa spesies tanaman tropis dilakukan untuk mengidentifikasi potensi 32 tanaman dan mendapatkan tiga kandidat tanaman terbaik sebagai methane inhibitor. Kajian konfirmasi dilakukan untuk membuktikan bahwa ketiga kandidat tersebut sebagai tiga kandidat terbaik sebagai agen penghambat metan. Kajian perbandingan dosis dilakukan untuk mendapatkan dosis terbaik dari kandidat terbaik terhadap pengurangan produksi gas metan enterik dan perbaikan profil fermentasi rumen. Ransum percobaan yang digunakan terdiri dari ransum kontrol (85% jerami padi, 10% bungkil kedelai dan 5% dedak gandum) dan ransum perlakuan (5% aditif tanaman mensubstitusi dedak gandum dalam ransum kontrol). Substrat diinkubasi secara anaerob bersama 50 ml campuran cairan rumen dua domba fistula dan media buffer (rasio 1:2) di dalam botol serum pada suhu 39◦C selama 24 jam dengan metode in vitro. Rancangan Acak Kelompok dengan 33 perlakuan dan 5 ulangan digunakan dalam kajian seleksi, 4 perlakuan (triplo) dan 4 ulangan digunakan dalam kajian konfirmasi dan juga kajian perbandingan dosis. Peubah yang diamati dalam kajian seleksi adalah produksi metan dan gas total, konsentrasi total Short Chain Fatty Acid (SCFA), konsentrasi Short Chain Fatty Acid (asetat, propionat, butirat), rasio asetat:propionat, nilai pH rumen, partitioning factor (efisiensi sintesis protein mikroba), degradabilitas bahan kering dan bahan organik. Peubah yang diamati dalam kajian konfirmasi dan perbandingan dosis adalah produksi metan dan gas total, nilai pH rumen, partitioning factor (efisiensi sintesis protein mikroba), rasio CH4:CO2, degradabilitas bahan kering dan bahan organik. Data dianalisis
menggunakan Analysis of Variance (ANOVA) dan uji lanjut Duncan.
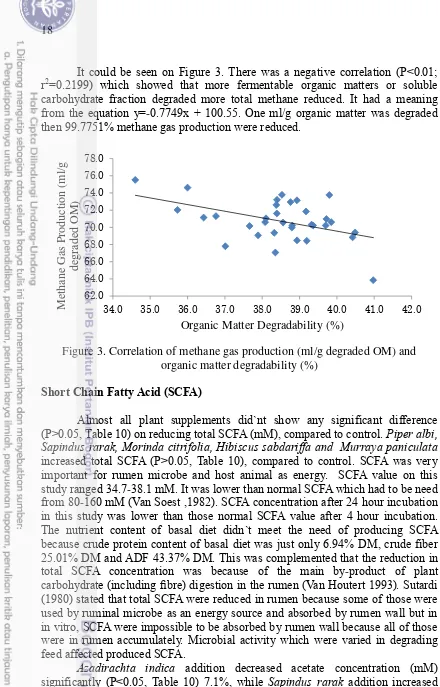
Pada tahap screening, hasil menunjukkan bahwa beberapa kandidat yang efektif yaitu Sapindus rarak, Gnetum gnemon dan Azadirachta indica. Sapindus
sangat signifikan (P<0.01) terhadap produksi gas metan estimasi (ml/g bahan organik terdegradasi), secara berurut dari 71 ml/g bahan organik terdegradasi pada kontrol. Sapindus rarak dan Gnetum gnemon meningkat secara signifikan 4.4% dan 6.3% (P<0.05) produksi gas total (ml/g bahan organik terinkubasi), secara berurut dari 107.8 ml/g bahan organik terinkubasi pada kontrol. Sapindus rarak
menurunkan total SCFA secara tidak signifikan (P>0.05) dari kontrol sebesar 0.6%. Sapindus rarak menurunkan sangat signifikan 10.28% (P<0.01) rasio asetat:propionat dari kontrol. Sapindus rarak meningkatkan secara tidak signifikan (P>0.05) degradabilitas bahan kering (%) sebesar 2.2% dari kontrol.
Sapindus rarak meningkatkan secara signifikan 3.2% (P<0.05) degradabilitas bahan organik (%) dari 39.7% degradabilitas bahan organik pada kontrol tetapi
Gnetum gnemon dan Azadirachta indica menurunkan signifikan (P<0.05)
degradabilitas bahan organik (%). Sapindus rarak, Azadirachta indica dan
Gnetum gnemon tidak menunjukkan perbedaan yang nyata signifikan (P>0.05) pada nilai pH rumen. Gnetum gnemon meningkatkan secara signifikan 10% (P<0.05) efisiensi sintesis protein mikroba, jika dibandingkan dengan kontrol (3.21 mg bahan organik terdegradasi/ml produksi gas total). Pada kajian konfirmasi, Sapindus rarak stabil dalam menurunkan produksi gas metan sangat signifikan (P<0.01) sebesar 7.39% dari kontrol dan juga menurunkan rasio CH4:CO2 sangat signifikan (P<0.01) dari kontrol. Sapindus rarak juga tidak signifikan (P>0.05) meningkatkan degradabilitas bahan kering (%) tetapi menurunkan signifikan (P<0.05) degradabilitas bahan organik (%). Pada kajian perbandingan dosis terlihat bahwa Sapindus rarak 5% merupakan dosis optimum sebagai methane inhibitor. Hal ini dapat disimpulkan bahwa ketiga kandidat tersebut terutama Sapindus rarak mengandung senyawa metabolit sekunder sebagai agen antimetanogenik (saponin).
SUMMARY
DIMAR SARI WAHYUNI. in Vitro Screening Assay of The Activity of Various Tropical Plants for Lowering Methane Production and Enhancing Ruminal Fermentation Profile. Supervised by SURYAHADI, KOMANG GEDE WIRYAWAN and ANURAGA JAYANEGARA.
Enteric methane emission of ruminant is one of global warming contributor. Methane is one of gas product of feed fermentation which is conducted by ruminal microbe in anaerob condition. The utilization of low-quality roughage in farming system affects the loss of feed gross energy into methane. The increase of enteric methane gas emission is caused by non-optimal ruminal fermentation. Methanogenic bacteria attaching to ciliate protozoa (host) uses H2 gas which are produced by protozoa and converted to CH4 (methane). Defaunating agents which are derived from tropical plants contain secondary metabolites. Reducing protozoa population decreases methanogenic bacteria (symbiotic) and methane gas production and also improves ruminal fermentation characteristics. Identifying and screening the activity of Indonesian tropical plants which have a potency as methane inhibitor are the early stages to be conducted in order to make an eco-friendly supplement.
and total gas production, ruminal pH value, partitioning factor (microbe protein syhthesis efficiency), CH4:CO2ratio, dry and organic matter degradability (DMD and OMD).
In screening assay, the results showed that some effective candidates were
Sapindus rarak, Gnetum gnemon and Azadirachta indica. Sapindus rarak,
Gnetum gnemon and Azadirachta indica decreased 10%, 5.5% and 4.5% highly
significantly (P<0.01) estimated methane gas production (ml/g degraded organic matter), respectively from 71 ml/g DOM in the control. Sapindus rarak and Gnetum gnemon increased significantly 4.4% and 6.3% (P<0.05) total gas production (ml/g incubated organic matter), respectively from 107.8 ml/g incubated organic matter in the control. Sapindus rarak decreased total of short chain fatty acid 0.6% (P>0.05), compared to control. Sapindus rarak decreased highly significantly 10.28% (P<0.01) acetate:propionate ratio in the control.
Sapindus rarak increased 2.2% (P>0.05) dry matter degradability (%) from control. Sapindus rarak increased significantly 3.2% (P<0.05) organic matter degradability (%) from 39.7% OMD in the control but Gnetum gnemon and Azadirachta indica decreased significantly (P<0.05) organic matter degradability (%). Sapindus rarak, Azadirachta indica and Gnetum gnemon did not show any significant difference (P>0.05) on ruminal pH value. Gnetum gnemon increased significantly 10% (P<0.05) microbe protein synthesis efficiency, compared to control (3.21 mg OMD/ml gas production). In confirmation assay, Sapindus rarak
was stable in reducing methane gas production highly significant (P<0.01) 7.39% from control and also decreased ratio of CH4:CO2 highly significant (P<0.01) from control. Sapindus rarak didn`t significantly (P>0.05) increased DMD (%) but it decreased significantly (P<0.05) organic matter degradability (%). In dose comparison assay, Sapindus rarak 5% was the best optimum dose which could be used as methane inhibitor. It was concluded that these candidates especially
Sapindus rarak may contain secondary compounds as an antimethanogenic agent
(saponin).
© Copyright of Bogor Agricultural University, 2016
Protected by the laws
It is prohibited to cite all or part of this thesis without referring to and mentioning the source. Any unauthorized quotation of all contents or any part thereof is strictly prohibited. Citation only permitted for educational purpose, research, scientific writing, reports writing, critique and problem analysis. Citation does not inflict the name and honour of Bogor Agricultural University.
Thesis
as one requisite to obtain a degree Master of Science
in
Animal Nutrition and Feed Science
IN VITRO
SCREENING ASSAY OF THE ACTIVITY OF
VARIOUS TROPICAL PLANTS FOR LOWERING
METHANE PRODUCTION AND ENHANCING
RUMINAL FERMENTATION PROFILE
GRADUATE SCHOOL
BOGOR AGRICULTURAL UNIVERSITY BOGOR
2016
FOREWORD
First and foremost, There are no words higher than the noblest benediction of gratitude for all things that I have received and I would humbly distinguish the Most Gracious Allah SWT, all praises to Allah for the gifts and blessing in finishing this thesis entitled “in vitro Screening Assay of The Activity of Various Tropical Plants for Lowering Methane Production and Enhancing Ruminal Fermentation Profile”. This thesis was written and submitted for my Master degree in Animal Nutrition and Feed Science at the Bogor Agricultural University. The research was executed as an internship (sandwich program) at Mie University, Japan. The results of research has been published in Proceeding of 37th Malaysian Society of Animal Production Annual Conference 2016 with the quite same title with my thesis.
I would like to sincerely express my deepest gratitude to my advisory comittee: Dr Ir Suryahadi, DEA as my main supervisor, Prof Dr Ir Komang G. Wiryawan, and Dr Anuraga Jayanegara, SPt MSc as my co-supervisor who gave me a lot of their thoughts about the subject, advanced support, guidance, advice, expertness, time, energy and encouragement throughout the research. I would also like to deliver my sincere thanks to Dr Hiroki Matsui and Dr Makoto Kondo (Graduate School of Bioresources, Mie University, Japan) who initiated this project for providing a research grant (sandwich program) and knowledge. I would also express my gratitude to Prof Dr Ir Yuli Retnani, MSc as head of study program and Dr Ir Lilis Khotijah, MS as vice-chairman of Animal Nutrition and Feed Science Study Program. I would like to say my thanks to Dr Ir Dwierra Evvyernie, MS MSc as an examiner of close exam who gave a lots of constructive criticism and useful suggestion during my close exam. I would like to thank to Mr Supriadi and Mrs Ade as the administrators in Animal Nutrition and Feed Science Study Program who have been very kindly taking care of the paper work concerning the process of study at this department.
I would also like to extend my greatest appreciation to LPDP (Institutions of Educational Fund Management), Ministry of Finance, Republic of Indonesia for granting scholarship during the study and experiment in Mie University, Japan This master thesis would not have been possible unless the funding of LPDP.
I also addressed my gratitude to all my office team in BPPT (The Agency for The Assessment and Application of Technology) for giving me the opportunity to continue my degree, class matesof 2014 Animal Nutrition and Feed Science (special to Santi, AA win, Pa Rudi), Indonesian Student Association in Japan (special to Fittrie and Gita) and also my laboratory mate in Japan (Phobe). And I would like to take this moment to deeply express my thankful feeling and infinite gratitude to my beloved parents Mr Bambang Wahyudi and Mrs Nunik Guniarti, my lovely husband Mr Arie Wibowo Nugroho, My cutest daughter Miss Nadhifa Qonita Zhafira, my younger brother Mr Guntur Yudha Hindarto who have been giving the everlasting positive energy and motivation, praying, loving and supporting as always. Constructive (suggestion and critictism) from the reader are gladly accepted. Hopefully this thesis can be useful for all of us and for development of animal nutrition and feed science.
Bogor, August 2016
TABLE OF CONTENT
LIST OF TABLES xii
LIST OF PICTURES xii
LIST OF APPENDIXES xii
1 INTRODUCTION 1
Background 1
Objective 2
2 MATERIALS AND METHODS 3
Time and place of research 3
Materials 3
Equipment and chemicals 3
Animal and feed 3
Methods 4
Proximate analysis 4
Chemical compound content analysis 4
Flow chart of experiment 6
In vitro incubation 6
Total gas production measurement 6
Methane gas production measurement 7
Short chain fatty acid (SCFA) concentration analysis 8 Dry and organic matter degradability (DMD and OMD)
analysis 8
Ruminal pH value 8
Partitioning factor (microbe protein synthesis efficiency) 8 Experimental design for stage 1 (screening assay) 9 Experimental design for stage 2 (confirmation assay) 9 Experimental design for stage 3 (dose comparison assay) 9
3 RESULT AND DISCUSSION 11
Chemical composition of treatment diets 11
First stage (in vitro screening assay) 13
Total gas production 13
Estimated methane gas production 16
Short chain fatty acid (SCFA) 18
Dry matter and organic matter degradability 22 Partitioning factor (microbe protein synthesis efficiency)
and ruminal pH value 23
Second stage (confirmation assay) 24
Third stage (dose comparison assay) 27
Correlation matrix of ration chemical composition and ruminal
4 CONCLUSION 29
5 RECOMMENDATION 30
6 REFERENCES 30
7 APPENDIXES 34
8 BIOGRAPHY 72
LIST OF TABLE
1 Nutrient content of feed ingredients (in % dry matter) 4 2 Tannin and saponin content of Sapindus rarak, Gnetum gnemon and
Azadirachta indica 5
3 Chemical compound content of Sapindus rarak, Gnetum gnemon
and Azadirachta indica (Qualitative analyses) 5
4 Experimental tropical plants were used in screening assay 10 5 Nutrient content of basal diet in % dry matter (85% rice straw: 10%
soya bean meal: 5% wheat bran) in screening assay 11 6 Chemical composition of basal and treatment diet in % dry matter in
confirmation assay 12
7 Chemical composition of basal and treatment diet in % dry matter in
dose comparison assay 13
8 Total gas production of treatments after 24 h incubation in screening
asay 14
9 Methane gas production of treatments after 24 h incubation in
screening assay 17
10 Short chain fatty acid (SCFA) of treatments after 24 h incubation in
screening assay 19
11 Dry matter and organic matter degradability of treatments after 24 h
incubation in screening assay 22
12 Partitioning factor (microbe protein synthesis efficiency) and pH
value of treatments after 24 h incubation in screening assay 23 13 Total gas production of treatments after 24 h incubation in
confirmation assay 25
14 Methane gas production of treatments after 24 h incubation in
confirmation assay 25
15 Dry and organic matter degradability of treatments after 24 h
incubation in confirmation assay 26
16 Partitioning factor (microbe protein synthesis efficiency), ruminal pH value, CH4:CO2 ratio of treatments after 24 h incubation in
confirmation asay 26
17 Total gas production of treatments after 24 h incubation in dose
comparison assay 27
18 Methane gas production of treatments after 24 h incubation in dose
comparison assay 27
19 Dry and organic matter degradability of treatments after 24 h
20 Partitioning factor (microbe protein synthesis efficiency), ruminal pH value, CH4:CO2 ratio of treatments after 24 h incubation in dose
comparison assay 28
21 Correlation matrix of ration chemical composition and ruminal
fermentation profile 29
LIST OF FIGURE
1 Flow chart of experiment 6
2 Correlation of total gas production (ml) and organic matter
degradability (%) 15
3 Correlation of methane gas production (ml/g degraded OM) and
organic matter degradability (%) 18
4 Relative changes (increase or decrease as % of the corresponding average control value) in methane production (CH4/g degraded
organic matter) and in total gas production (ml/g incubated DM) in
response to the addition of the plant additives. 21 5 Relative changes (increase or decrease as % of the corresponding
average control value) in methane production (CH4/g degraded
organic matter) and in organic matter degradability (%) in response
to the addition of the plant additives. 21
LIST OF APPENDIXES
1 ANOVA of total gas production (ml) of treatments after 24 h
incubation in screening assay 34
2 Duncan test of total gas production (ml) of treatments after 24 h
incubation in screening assay 34
3 ANOVA of total gas production (ml/g incubated DM) of treatments
after 24 h incubation in screening assay 35
4 Duncan test of total gas production (ml/g incubated DM) of
treatments after 24 h incubation in screening assay 36 5 ANOVA of methane gas production (ml) of treatments after 24 h
incubation in screening assay 37
6 Duncan test of methane gas production (ml) of treatments after 24 h
incubation in screening assay 37
7 ANOVA of methane gas production (ml/g degraded OM) of
treatments after 24 h incubation in screening assay 38 8 Duncan test of methane gas production (ml/g degraded OM) of
treatments after 24 h incubation in screening assay 39 9 ANOVA of methane gas production (ml/l total gas) of treatments
after 24 h incubation in screening assay 40
after 24 h incubation in screening assay 40 11 ANOVA of total Short Chain Fatty Acid (mM) of treatments after
24 h incubation in screening assay 41
12 Duncan test of total Short Chain Fatty Acid (mM) of treatments after
24 h incubation in screening assay 42
13 ANOVA of acetate concentration (mM) of treatments after 24 h
incubation in screening assay 43
14 Duncan test of acetate concentration (mM) of treatments after 24 h
incubation in screening assay 43
15 ANOVA of propionate concentration (mM) of treatments after 24 h
incubation in screening assay 45
16 Duncan test of propionate concentration (mM) of treatments after 24
h incubation in screening assay 45
17 ANOVA of butyrate concentration (mM) of treatments after 24 h
incubation in screening assay 46
18 Duncan test of butyrate concentration (mM) of treatments after 24 h
incubation in screening assay 47
19 ANOVA of C2:C3 ratio of treatments after 24 h incubation in
screening assay 48
20 Duncan test of C2:C3 ratio of treatments after 24 h incubation in
screening assay 48
21 ANOVA of Dry matter degradability (%) of treatments after 24 h
incubation in screening assay 49
22 Duncan test of Dry matter degradability (%) of treatments after 24 h
incubation in screening assay 50
23 ANOVA of Organic matter degradability (%) of treatments after 24
h incubation in screening assay 51
24 Duncan test of Organic matter degradability (%) of treatments after
24 h incubation in screening assay 51
25 ANOVA of Partitioning factor (microbe protein synthesis efficiency) mg DOM/ml total gas of treatments after 24 h incubation
in screening assay 52
26 Duncan test of Partitioning factor (microbe protein synthesis efficiency) mg DOM/ml total gas of treatments after 24 h incubation
in screening assay 53
27 ANOVA of ruminal pH value of treatments after 24 h incubation in
screening assay 54
28 Duncan test of ruminal pH value of treatments after 24 h incubation
in screening assay 54
29 ANOVA of total gas production (ml) of treatments after 24 h
incubation in confirmation assay 55
30 Duncan test of total gas production (ml) of treatments after 24 h
incubation in confirmation assay 56
31 ANOVA of total gas production (ml/g incubated DM) of treatments
after 24 h incubation in confirmation assay 56
32 Duncan test of total gas production (ml/g incubated DM) of
incubation in confirmation assay
34 Duncan test of methane gas production (ml) of treatments after 24 h
incubation in confirmation assay 57
35 ANOVA of methane gas production (ml/g degraded OM) of
treatments after 24 h incubation in confirmation assay 57 36 Duncan test of methane gas production (ml/g degraded OM) of
treatments after 24 h incubation in confirmation assay 58 37 ANOVA of methane gas production (ml/l total gas) of treatments
after 24 h incubation in confirmation assay 58
38 Duncan test of methane gas production (ml/l total gas) of treatments
after 24 h incubation in confirmation assay 58
39 ANOVA of Dry matter degradability (%) of treatments after 24 h
incubation in confirmation assay 59
40 Duncan test of Dry matter degradability (%) of treatments after 24 h
incubation in confirmation assay 59
41 ANOVA of Organic matter degradability (%) of treatments after 24
h incubation in confirmation assay 59
42 Duncan test of Organic matter degradability (%) of treatments after
24 h incubation in confirmation assay 60
43 ANOVA of Partitioning factor (microbe protein synthesis efficiency) mg DOM/ml total gas of treatments after 24 h incubation
in confirmation assay 60
44 Duncan test of Partitioning factor (microbe protein synthesis efficiency) mg DOM/ml total gas of treatments after 24 h incubation
in confirmation assay 60
45 ANOVA of ruminal pH value of treatments after 24 h incubation in
confirmation assay 61
46 Duncan test of ruminal pH value of treatments after 24 h incubation
in confirmation assay 61
47 ANOVA of CH4:CO2 ratio of treatments after 24 h incubation in
confirmation assay 61
48 Duncan test of CH4:CO2 ratio of treatments after 24 h incubation in
confirmation assay 62
49 ANOVA of total gas production (ml) of treatments after 24 h
incubation in dose comparison assay 62
50 Duncan test of total gas production (ml) of treatments after 24 h
incubation in dose comparison assay 62
51 ANOVA of total gas production (ml/g incubated DM) of treatments
after 24 h incubation in dose comparison assay 63 52 Duncan test of total gas production (ml/g incubated DM) of
treatments after 24 h incubation in dose comparison assay 63 53 ANOVA of methane gas production (ml) of treatments after 24 h
incubation in dose comparison assay 63
54 Duncan test of methane gas production (ml) of treatments after 24 h
incubation in dose comparison assay 64
55 ANOVA of methane gas production (ml/g degraded OM) of
treatments after 24 h incubation in dose comparison assay 64 57 ANOVA of methane gas production (ml/l total gas) of treatments
after 24 h incubation in dose comparison assay 65 58 Duncan test of methane gas production (ml/l total gas) of treatments
after 24 h incubation in dose comparison assay 65 59 ANOVA of Dry matter degradability (%) of treatments after 24 h
incubation in dose comparison assay 65
60 Duncan test of Dry matter degradability (%) of treatments after 24 h
incubation in dose comparison assay 66
61 ANOVA of Organic matter degradability (%) of treatments after 24
h incubation in dose comparison assay 66
62 Duncan test of Organic matter degradability (%) of treatments after
24 h incubation in dose comparison assay 66
63 ANOVA of Partitioning factor (microbe protein synthesis efficiency) mg DOM/ml total gas of treatments after 24 h incubation
in dose comparison assay 67
64 Duncan test of Partitioning factor (microbe protein synthesis efficiency) mg DOM/ml total gas of treatments after 24 h incubation
in dose comparison assay 67
65 ANOVA of ruminal pH value of treatments after 24 h incubation in
dose comparison assay 67
66 Duncan test of ruminal pH value of treatments after 24 h incubation
in dose comparison assay 68
67 ANOVA of CH4:CO2 ratio of treatments after 24 h incubation in
dose comparison assay 68
68 Duncan test of CH4:CO2 ratio of treatments after 24 h incubation in
dose comparison assay 68
69 ANOVA of Correlation of total gas production (ml/g degraded OM)
andorganic matter degradability (%) 69
70 ANOVA of Correlation of methane gas production (ml/g degraded
OM) and organic matter degradability (%) 69
71 ANOVA of Correlation Matrix of Methane gas production (ml/g
degraded OM) and Ration Chemical Composition 70 72 ANOVA of Correlation Matrix of total gas production (ml) and
Ration Chemical Composition 70
73 ANOVA of Correlation Matrix of degradability of organic matter
1 INTRODUCTION
Background
Global warming, world`s trending topic, has already widely been threatening life. In ruminants, methane is a product of structural or non-structural carbohydrate fermentation which is conducted by methanogens (methane -producing bacteria) anaerobically in the rumen and will be released primarily by eructation process (Bhatta et al. 2007). Methane gas production of ruminant is approximately 95% of total methane emissions of livestock and humans, and is about 18% of total greenhouse gases in the atmosphere (Kreuzer and Soliva 2008). Enteric methane is produced mainly in the rumen (87% - 90%) and about 10-13% comes from large intestine (Torrent and Johnson 1994). Methane gas total emissions in Japan of dairy cattle are 446.5 l/head/day, beef cattle 201.9 l/head/day, and sheep/goats 15.9 l / head /day (Takahashi 2006).
In farm application, most of livestock farmers give feed low quality roughages to their ruminants. Rice straw, a main feed for ruminants, is about 90% of the world`s production in developing countries and has high fiber and lignin contents, but low protein contents, cause low digestibility and feeding values for ruminants (Alborés et al. 2006). The utilization of low-quality roughage affects the loss of feed gross energy 6-7% (Johnson and Johnson 1995) and indicates low efficiency of feed utilization, so it will increase methane gas emissions and affect the environment inefficiently, because of not optimal feed fermentation in the rumen. This condition will make disadvantages for farmers, because most of food energy that should be used for the growth is converted into methane. Roughage is the feed which needs to be met on a ruminant livestock production system, because it is used for stabilizing rumen condition. The most rumen fermentation product from utilizing high proportion of roughage in ration is acetic acid. As we know that roughages have high content of cellulose which can contribute to produce high enteric methane. Methane gas production is closely related with the production of CO2 and two types of vollatile fatty acids (acetic acid and butyric acid). Methanogens play an important role in converting organic matter to methane because it use intensively H2 gas which are obtained from acetic acid and butyric acid production (Ososanya and Faniyi 2015).
2
improves energy efficiency in ruminant (Hess et al. 2004) because 25% of bacteria live in the attachment and symbiosis with the methanogenic rumen protozoa (Newbold et al. 1997). A decrease in the number of protozoa as much as 28% is expected to cause a 42% decrease in methane (Finlay et al. 1994).
Indonesia has abundant local forage feed resources which can be used as methane inhibitor with plant secondary metabolites or phytochemicals. Nowadays, the utilization of natural feed additives are considered better as an agent for inhibiting methane than chemical feed additives. It can be applied to local farmers because it is easily produced and has inexpensive manufacturing costs. The process of extracting secondary metabolites will be expensive so that it should be considered in feeding to animal. Some agents else suppressing methane emissions have been tried out in other countries. Many previous studies of feed manipulations can be conducted by utilizing methane inhibitor or rumen modifiers in ruminant feed such as tannins (Makkar et al. 1995; Jayanegara et al. 2008; Guglielmelli et al. 2011) and saponins (Kamra 2005; Wanapat et al. 2014). Condensed tannins and crude saponins have an ability to inhibit protozoa so that methanogens are reduced by lowering the activity of protozoa associated methanogens (Guo et al. 2008). Tannins or polyphenols is a natural bioactive compound found in plants and is very useful as methane inhibitor for reducing ruminant enteric methane gas production. Legume forages can better reduce ruminal methane emissionsthan grass forages (Archimedea et al. 2011). Plant secondary metabolites (saponin) acts as a feed additive for ruminant which can inhibit rumen protozoa (the defaunating agent) (Wallace et al. 1994; Benchaar et al. 2007).
Screening of Indonesian tropical plants that have potential as a defaunating agent/methane inhibitor is an early stage and it is important to be conducted as a feed supplement for ruminant feed. In this study, another new bioactive compound might be detected. Production of environmentally friendly feed supplement is important to be developed.
Objective
The objectives of this research were as follows :
1. to screen and investigate the activity of a large number of tropical plant species containing secondary compounds as feed supplement on reducing methane production and improving ruminal fermentation profile in screening assay.
2. To confirm some potential candidates on lowering enteric methane emission and enhancing ruminal fermentation characteristics in vitro in confirmation assay.
3
2 MATERIALS AND METHODS
Time and Place of Research
This research was carried out from November 2015 to March 2016 at Laboratory of Grassland and Animal Feed Production in the Graduate School of Bioresources, Mie University, Japan. Sample preparation was conducted at Laboratory of Dairy Nutrition, Department of Nutrition and Feed Technology, Faculty of Animal Science, Bogor Agricultural University.
Materials
Equipments and Chemicals
Equipments which were used in this research were digital scale, oven, small size discmill, serum bottle, butyl rubberstopper and aluminum cap, water bath, CO2 gas tube, freeze centrifuge, glass syringe 100 ml, Gas Chromatography 8A, Shimadzu Crop., Kyoto, Japan, pH meter, micropipette, furnace, desiccator, thermostat, freezer, hot plate magnetic stirrer, autoclave, high-performance liquid chromatography (HPLC) equipped with anion exclusion chromatography and a post-column (Shimadzu SCR-102H, 8 mm × 30 cm, Shimadzu Kyoto, Japan) and HPLC vial. Chemical materials were McDougal buffer solution (NaHCO3 9.8 g, Na2HPO4.12H2O 9.3 g, NaCl 0.47 g, KCl 0.57 g, CaCl.2H2O 0.05 g, MgSO4.7H2O 0.12 g), aquadest, ethanol, HClO4 6%, Toluensulfonic Acid Monohydrate, Na EDTA and Bis Tris.
Animal and Feed
A source of mixed rumen fluid was collected from two fistulated Japanese sheeps fed ration ± 2.7% of body weight (600 g Italian ryegrass straw and 200 g commercial concentrate of Soyokaze no Kaori; Nippon Formula Feed Manufacturing, Yokohama, Japan) that were offered in equal proportions twice a day. The animals were housed individually in pen equipped with ad libitum clean fresh water according to the Mie University guidelines for animal handling. Rumen fluid was collected before the morning feeding through the rumen fistula and kept at 39°C in CO2 atmosphere then immediately transported to the laboratory. Fistulated sheeps which were used were 5 years old and ±30 kg weight.
4
Methods
Procedure
Proximate analysis
Nutrient composition of basal diet and three best candidates were analyzed by proximate analysis (AOAC 2002) at Centre of Inter-University of Bogor Agricultural University; while Neutral Detergent Fiber (NDF) and Acid Detergent Fiber (ADF) of basal diet and three best candidates were analyzed by Van Soest (Van Soest & Robertson 1991) at Livestock Research Institute, Ministry of Agriculture, Ciawi, Bogor.
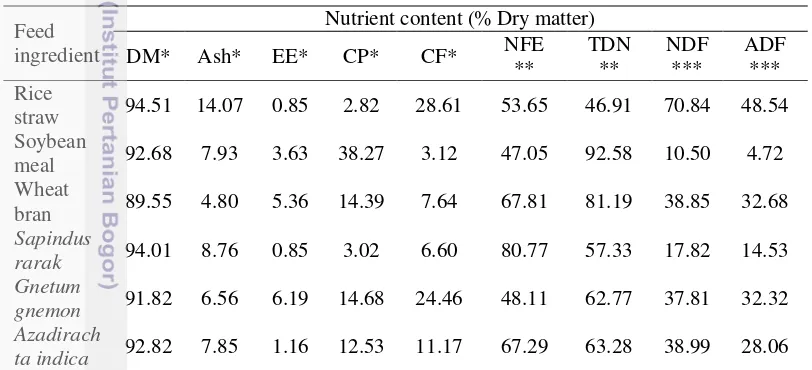
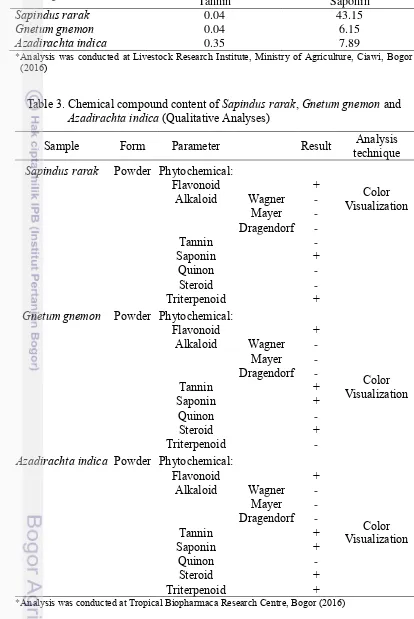
Nutrient content of feed ingredients were shown in Table 1. Tannin and saponin content of Sapindus rarak, Gnetum gnemon andAzadirachta indica
(Quantitative Analyses) were shown in Table 2. Chemical compound content of
Sapindus rarak, Gnetum gnemon and Azadirachta indica (Qualitative Analyses) were shown in Table 3.
Table 1. Nutrient content of feed ingredients (in % dry matter)
Feed ingredient
Nutrient content (% Dry matter)
DM* Ash* EE* CP* CF* NFE
**
TDN **
NDF ***
ADF *** Rice
straw 94.51 14.07 0.85 2.82 28.61 53.65 46.91 70.84 48.54 Soybean
meal 92.68 7.93 3.63 38.27 3.12 47.05 92.58 10.50 4.72 Wheat
bran 89.55 4.80 5.36 14.39 7.64 67.81 81.19 38.85 32.68
Sapindus
rarak 94.01 8.76 0.85 3.02 6.60 80.77 57.33 17.82 14.53 Gnetum
gnemon 91.82 6.56 6.19 14.68 24.46 48.11 62.77 37.81 32.32 Azadirach
ta indica 92.82 7.85 1.16 12.53 11.17 67.29 63.28 38.99 28.06
*Analysis was conducted at Centre of Inter-University of Bogor Agricultural University (2016)
**NFE was calculated using 100-%ash -%CF-%EE-%CP and TDN was calculated using %*TDN = 37.937
-1.018 (CF) -4.886 (EE)+ 0.173 (NFE) + 1.042 (Pr) + 0.015(CF)2-0.068 (EE)2 + 0.008 (CF)(NFE) + 0.119
(EE) (NFE) + 0.038(EE) (Pr) + 0.003 (EE)2(Pr) (Hartadi et al., 2005)
***Analysis was conducted at Livestock Research Institute, Ministry of Agriculture, Ciawi, Bogor (2016); DM: Dry Matter, EE: Ether Extract, CP: Crude Protein, CF: Crude Fiber, NFE: Nitrogen Free Extract, TDN: Total Digestible Nutrient, NDF: Neutral Detergent Fiber, ADF: Acid Detergent Fiber
Chemical compound content analysis
5
Table 2. Tannin and saponin content of Sapindus rarak, Gnetum gnemon and
Azadirachta indica (Quantitative Analyses)
Feed ingredient Secondary compound (g/100 g)
Tannin Saponin
Sapindus rarak 0.04 43.15
Gnetum gnemon 0.04 6.15
Azadirachta indica 0.35 7.89
*Analysis was conducted at Livestock Research Institute, Ministry of Agriculture, Ciawi, Bogor (2016)
Table 3. Chemical compound content of Sapindus rarak, Gnetum gnemon and
Azadirachta indica (Qualitative Analyses)
Sample Form Parameter Result techniqueAnalysis
Sapindus rarak Powder Phytochemical:
Flavonoid + Color
Visualization
Alkaloid Wagner -
Mayer -
Dragendorf -
Tannin -
Saponin +
Quinon -
Steroid -
Triterpenoid +
Gnetum gnemon Powder Phytochemical:
Flavonoid +
Color Visualization
Alkaloid Wagner -
Mayer -
Dragendorf -
Tannin +
Saponin +
Quinon -
Steroid +
Triterpenoid -
Azadirachta indica Powder Phytochemical:
Flavonoid +
Color Visualization
Alkaloid Wagner -
Mayer -
Dragendorf -
Tannin +
Saponin +
Quinon -
Steroid +
Triterpenoid +
6
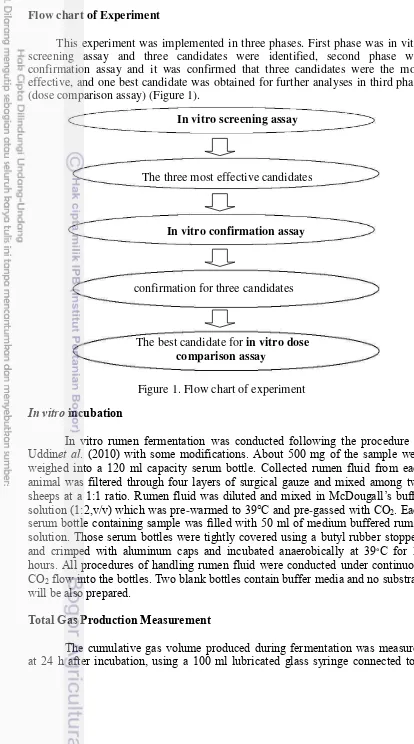
Flow chart of Experiment
This experiment was implemented in three phases. First phase was in vitro screening assay and three candidates were identified, second phase was confirmation assay and it was confirmed that three candidates were the most effective, and one best candidate was obtained for further analyses in third phase (dose comparison assay) (Figure 1).
In vitro screening assay
The three most effective candidates
In vitro confirmation assay
confirmation for three candidates
The best candidate for in vitro dose comparison assay
In vitro incubation
In vitro rumen fermentation was conducted following the procedure of Uddinet al. (2010) with some modifications. About 500 mg of the sample were weighed into a 120 ml capacity serum bottle. Collected rumen fluid from each animal was filtered through four layers of surgical gauze and mixed among two sheeps at a 1:1 ratio. Rumen fluid was diluted and mixed in McDougall’s buffer solution (1:2,v/v) which was pre-warmed to 39°C and pre-gassed with CO2. Each serum bottle containing sample was filled with 50 ml of medium buffered rumen solution. Those serum bottles were tightly covered using a butyl rubber stoppers and crimped with aluminum caps and incubated anaerobically at 39∘C for 24
hours. All procedures of handling rumen fluid were conducted under continuous CO2 flow into the bottles. Two blank bottles contain buffer media and no substrats will be also prepared.
Total Gas Production Measurement
The cumulative gas volume produced during fermentation was measured at 24 h after incubation, using a 100 ml lubricated glass syringe connected to a
7
needle that was inserted through the septum of the stopper into the headspace. The gas which was collected in the syringe could then be recorded after the plunger displacement and discarded, or a sample was taken if required. It was assumed that gas composition was the same in the released gas as that remaining in the headspace. Total Gas Production was measured with the equation :
(V24– V0– Gb0)
W
Note:
GP = gas production
V24 = gas volume (ml) 24 hours incubation
V0 = gas volume (ml) 0 hour incubation
Gb0 = gas volume (ml) of blank 24 hours incubation
W = weight of incubated sample (gram incubated Dry Matter)
Methane Gas Production Measurement
In screening assay, CH4 gas production was stoichiometrically calculated from the respective Short Chain Fatty Acid (SCFA). Stoichiometrical model used for estimating CH4 from SCFA composition was as follow:
Moss et al. (2000), considering the hydrogen recovery of 90% (default):
CH4 = 0.45 C2 – 0.275 C3 + 0.40 C4
Where: C2 = acetate C3 = propionate C4 = butyrate
In confirmation and dose comparison assay, methane gas sample in the headspace gas of each serum bottle was withdrawn with 0.5 ml needle spoitor gas production of 24 h fermentation process was collected in vacuum tube by a gas -tight syringe. Fermented gas which was analyzed to determine CH4, H2 and CO2 gas concentration was measured by Gas Chromatography. Total of methane gas which was determined through multiplication between concentration and production of fermented gas total (Soliva and Hess 2007). Methane Gas Production was measured with the equation :
(GP24H + HS) x (V24)
W24
Note:
MP = methane production
GP24H = total gas production 24 hours incubation (ml) (already was substracted
by blank gas volume 24 hours incubation) HS = headspace (73.5 ml)
V24 = methanegas volume (ml) 24 hours incubation by Gas Chromatography
W24 = weight of degraded sample 24 hours incubation (gram degraded dry
matter)
GP (ml/g incubated DM 24 H) =
8
Short Chain Fatty Acid (SCFA) Concentration Analysis
SCFAs total and partial were analyzed by High-Performance Liquid Chromatography (HPLC) equipped with an ion exclusion chromatography and a post-column (Shimadzu SCR-102H, 8 mm × 30 cm, Shimadzu Kyoto, Japan) pH -buffered electroconductivity detection method, over a temperature range of 45°C. Preparation of VFA analysis included 1 part of ruminal fluid and 3 parts of 6% perchloric acid (Uddin et al., 2010).
SCFA concentration were measured with the equation:
SCFA Concentration (mM) =
Sample SCFA area x Standard SCFA concentration
Standard SCFA area
Dry and Organic Matter Degradability (DMD and OMD) Analysis
At the end of 24 h incubation, the bottle was immediately placed on ice to stop the fermentation process. The residual contents in the bottles were collected by centrifuging at 1000 G, for 5 minutes, at 4°C and stored at -30°C for determination of in vitro dry matter (DM) and organic matter (OM) degradability in vitro.
Dry matter (DM) and Organic matter (OM) degradability were measured with the equation:
DM Sample (g) – DMResidue (g) – DM Blank(g) DM sample (g)
OM Sample (g) – OM Residue (g) – OM Blank (g) OM sample (g)
Note :
DM = Dry Matter OM = Organic Matter
Ruminal pH Value
Ruminal pH value measurement of samples were measured by pH meter. pH value which were measured were consistently as it were shown in pH meter.
Partitioning Factor (Microbe Protein Synthesis Efficiency)
The partitioning factor (PF), which is mg of truly degraded organic matter (TDOM) divided by the ml of gas produced in vitro (Blümmel et al. 1997) as an index of partitioning of TDOM between microbial biomass and fermentation
x 100%
x 100% DMD%) =
9
gases during fermentation. Thus a higher PF means that a higher proportion of TDOM is used for synthesis of microbial biomass. Partitioning factor (microbe protein synthesis efficiency) were measured with the equation:
Truly degraded organic matter (mg) Gas production (ml)
Experimental Design:
Stage 1 (screening assay)
A randomized complete block design with 33 treatments and 5 replications was carried out in screening assay. The experimental diets were 500 mg of substrate (425 mg of rice straw, 50 mg of soya bean meal and 25 mg of wheat bran) as a control and 25 mg of each plant supplement substituting wheat bran on control as a tested feed (Table 4.)
Treatments which were used in this experiment were:
R1 : 85% rice straw: 10% soya bean meal: 5% wheat bran R2-R33: 85% rice straw: 10% soya bean meal: 5% plant supplement
Stage 2 (confirmation assay)
A randomized complete block design with 4 treatments (triplo) and 4 replications was carried out in confirmation assay. Three best candidates from confirmation assay were conducted in dose comparison assay.
Treatments which were used in this experiment were: R1: 85% rice straw: 10% soya bean meal: 5% wheat bran R2: 85% rice straw: 10% soya bean meal: 5% Sapindus rarak
R3: 85% rice straw: 10% soya bean meal: 5% Gnetum gnemon
R4: 85% rice straw: 10% soya bean meal: 5% Azadirachta indica
Stage 3 (dose comparison assay)
A randomized complete block design with 4 treatments (triplo) and 4 replications was carried out in dose comparison assay. The best candidate which was from confirmation assay were analyzed in dose comparison assay.
Treatments which were used in this experiment were: R1: 85% rice straw: 10% soya bean meal: 5% wheat bran R2: 85% rice straw: 10% soya bean meal: 5% Sapindus rarak
R2: 85% rice straw: 10% soya bean meal: 9.5% Sapindus rarak
R2: 85% rice straw: 10% soya bean meal: 13.6% Sapindus rarak
Variables measured after 24h of incubation in screening assay were: 1. Estimated methane gas production
2. Total gas production
3. Total Short Chain Fatty Acid (SCFA) concentration
4. Short Chain Fatty Acid (acetate, propionate and butyrate) concentration 5. Acetate:propionate ratio
10
6. Ruminal pH value
7. Partitioning factor (microbe protein synthesis efficiency) 8. Dry and organic matter degradability (DMD and OMD).
Variables measured after 24h of incubation in confirmation and dose comparison assay were:
1. Actual methane gas production 2. Total gas production
3. Ruminal pH value
4. Partitioning factor (microbe protein synthesis efficiency) 5. Dry and organic matter degradability (DMD and OMD). 6. Ratio of CH4:CO2
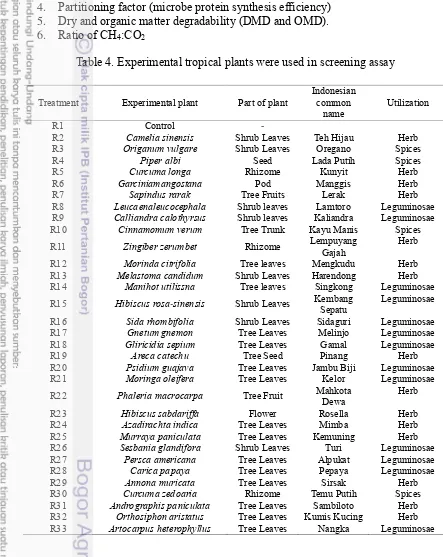
Table 4. Experimental tropical plants were used in screening assay
Treatment Experimental plant Part of plant Indonesian common
name Utilization
R1 Control -
R2 Camelia sinensis Shrub Leaves Teh Hijau Herb
R3 Origanum vulgare Shrub Leaves Oregano Spices
R4 Piper albi Seed Lada Putih Spices
R5 Curcuma longa Rhizome Kunyit Herb
R6 Garciniamangostana Pod Manggis Herb
R7 Sapindus rarak Tree Fruits Lerak Herb
R8 Leucaenaleucocephala Shrub leaves Lamtoro Leguminosae
R9 Calliandra calothyrsus Shrub leaves Kaliandra Leguminosae
R10 Cinnamomum verum Tree Trunk Kayu Manis Spices
R11 Zingiber zerumbet Rhizome Lempuyang Gajah Herb
R12 Morinda citrifolia Tree leaves Mengkudu Herb
R13 Melastoma candidum Shrub Leaves Harendong Herb
R14 Manihot utilissna Tree leaves Singkong Leguminosae
R15 Hibiscus rosa-sinensis Shrub Leaves Kembang Sepatu Leguminosae
R16 Sida rhombifolia Shrub Leaves Sidaguri Leguminosae
R17 Gnetum gnemon Tree Leaves Melinjo Leguminosae
R18 Gliricidia sepium Tree Leaves Gamal Leguminosae
R19 Areca catechu Tree Seed Pinang Herb
R20 Psidium guajava Tree Leaves Jambu Biji Leguminosae
R21 Moringa oleifera Tree Leaves Kelor Leguminosae
R22 Phaleria macrocarpa Tree Fruit Mahkota Dewa Herb
R23 Hibiscus sabdariffa Flower Rosella Herb
R24 Azadirachta indica Tree Leaves Mimba Herb
R25 Murraya paniculata Tree Leaves Kemuning Herb
R26 Sesbania glandifora Shrub Leaves Turi Leguminosae
R27 Persca americana Tree Leaves Alpukat Leguminosae
R28 Carica papaya Tree Leaves Pepaya Leguminosae
R29 Annona muricata Tree Leaves Sirsak Herb
R30 Curcuma zedoaria Rhizome Temu Putih Spices
R31 Andrographis paniculata Tree Leaves Sambiloto Herb
R32 Orthosiphon aristatus Tree Leaves Kumis Kucing Herb
11
Data were analyzed by Analysis of Variance (ANOVA) and if the results were significantly different between control then continued with the Duncan test (Steel and Torrie 1993). All the statistical analyses were performed by using SPSS statistical software version 17.0.
Mathematic model for a randomized complete block design:
Yij = μ + τi + βj + εij
Note :
Yij = observed value from treatment-i in group-j μ = median value of population
τi = effect of treatment-i βj = effect of group-j
εij = effect of galat error from treatment-i in group-j
3 RESULT AND DISCUSSION
Chemical Compositionof Treatment Diets
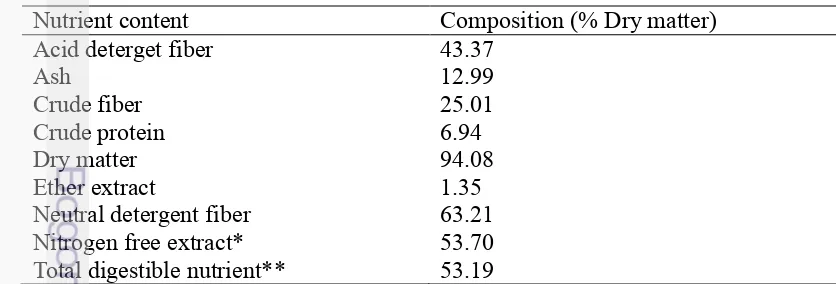
Roughage, a main ruminant feed, is used for stabilizing rumen condition. Rice straw which is one of roughage is abundant in Indonesia so that many livestock farmers use it for their animal. Real condition is usually faced by farmers in livestock. High fiber of rice straw is one of obstacles that make reduction of ruminal degradability and increase of methane production so that rice straw should be supplemented by concentrate or feed supplement. Rice straw is unique relative to other cereal straws with low in lignin and high in silica. Silica (130g/kg) and lignin (52 g/kg) in that order are the primary limiting factors in rice straw quality (Van Soest, 2006). In this study, utilization of rice straw was quite high which was about 85% so that this fiber content of ration (25.01%) and ADF (43.37%) was quite high and protein content (6.94%) was quite low (Table 5). Methane production could be influenced by the carbohydrate digested, such as cellulose, hemicelluloses and soluble residue (Takahashi 2001).
Table 5. Nutrient content of basal diet (R1) in % dry matter (85% rice straw: 10% soya bean meal: 5% wheat bran) in screening assay
Nutrient content Composition (% Dry matter)
Acid deterget fiber 43.37
Ash 12.99
Crude fiber 25.01
Crude protein 6.94
Dry matter 94.08
Ether extract 1.35
Neutral detergent fiber 63.21
Nitrogen free extract* 53.70
Total digestible nutrient** 53.19
*NFE was calculated using 100-%ash -%CF-%EE-%CP and **TDN was calculated using %TDN
= 37.937 - 1.018 (CF) -4.886 (EE)+ 0.173 (NFE) + 1.042 (Pr) + 0.015(CF)2-0.068 (EE)2 + 0.008
12
In confirmation assay, there were four treatments of three best candidates. Crude fiber and ADF content of Sapindus rarak were lower than crude fiber and ADF content of Gnetum gnemon and Azadirachta indica (Table 1) so that crude fiber and ADF of R2 diet also were lower than crude fiber and ADF of R3 and R4 diet (Table 6). This condition could affect lower methane production of R2 diet than R3 and R4 diet. In addition, Sapindus rarak contained the highest saponin content (43.15 g/100 g) among the other methane inhibitors (Table 2).
Plant feed (roughages), rich in cell content and low in cell wall on fermentation,were expected to produce low CH4 emission on reduction of molar
proportion of acetate (60%) and increased molar proportion of propionate (30%) (Dougherty, 1984).
Table 6. Chemical composition of basal and treatment diet in % dry matter in confirmation assay
Nutrient content Composition (% Dry matter)
R1 R2 R3 R4
Acid deterget fiber 43.37 42.46 43.35 43.13
Ash 12.99 13.19 13.08 13.15
Crude fiber 25.01 24.96 25.85 25.19
Crude protein 6.94 6.38 6.96 6.85
Dry matter 94.08 94.30 94.19 94.24
Ether extract 1.35 1.13 1.40 1.14
Neutral detergent fiber 63.21 62.16 63.15 63.21
Nitrogen free extract 53.70 54.35 52.71 53.67
Total digestible nutrient 53.19 52.00 52.27 52.30
Tannin 0.00 0.00 0.00 0.02
Saponin 0.00 2.16 0.31 0.39
*Nutrient content of basal and treatment diet were total of nutrient content of each feed ingredient
(rice straw, soya bean meal and wheat bran/plant feed supplements). R1: 85% rice straw: 10% soya bean meal: 5% wheat bran; R2: 85% rice straw: 10% soya bean meal: 5% Sapindus rarak R3: 85% rice straw: 10% soya bean meal: 5%Gnetum gnemon; R4:85% rice straw: 10% soya bean meal: 5% Azadirachta indica
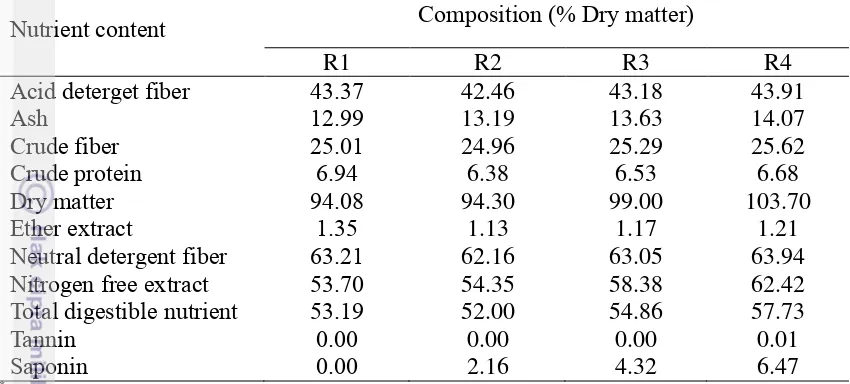
In dose comparison assay, Sapindus rarak was the best candidate. The higher Sapindus rarak dose was the higher crude fiber, ADF (Table 7) and saponin content was (Table 7), could affect the lowest methane gas production on R4 diet (13.6% dose). Also, dry matter and organic matter increased with the increase of dose of Sapindus rarak. It also could affect total gas production, degradability and Short Chain Fatty Acid. Digestible acid detergent fibre (ADF), cellulose and hemicelluloses are important fibre fractions which influence CH4 emission in the
13
Table 7. Chemical composition of basal and treatment diet in % dry matter in dose comparison assay
Nutrient content Composition (% Dry matter)
R1 R2 R3 R4
Acid deterget fiber 43.37 42.46 43.18 43.91
Ash 12.99 13.19 13.63 14.07
Crude fiber 25.01 24.96 25.29 25.62
Crude protein 6.94 6.38 6.53 6.68
Dry matter 94.08 94.30 99.00 103.70
Ether extract 1.35 1.13 1.17 1.21
Neutral detergent fiber 63.21 62.16 63.05 63.94
Nitrogen free extract 53.70 54.35 58.38 62.42
Total digestible nutrient 53.19 52.00 54.86 57.73
Tannin 0.00 0.00 0.00 0.01
Saponin 0.00 2.16 4.32 6.47
*Nutrient content of basal and treatment diet were total of nutrient content of each feed ingredient
(rice straw, soya bean meal and wheat bran/plant feed supplements). R1: 85% rice straw: 10% soya bean meal: 5% wheat bran; R2: 85% rice straw: 10% soya bean meal: 5% Sapindus rarak; R3: 85% rice straw: 10% soya bean meal: 9.5% Sapindus rarak; R485% rice straw: 10% soya bean meal: 13.6% Sapindus rarak
First Stage (in vitro Screening Assay)
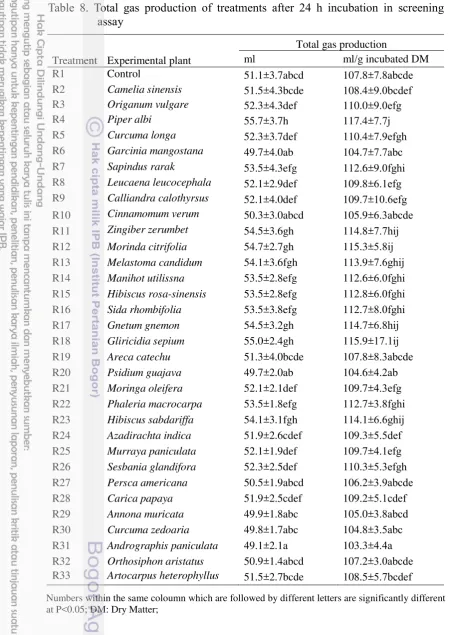
Total Gas Production
14
Table 8. Total gas production of treatments after 24 h incubation in screening assay
Treatment Experimental plant
Total gas production
ml ml/g incubated DM
R1 Control 51.1±3.7abcd 107.8±7.8abcde
R2 Camelia sinensis 51.5±4.3bcde 108.4±9.0bcdef R3 Origanum vulgare 52.3±4.3def 110.0±9.0efg
R4 Piper albi 55.7±3.7h 117.4±7.7j
R5 Curcuma longa 52.3±3.7def 110.4±7.9efgh
R6 Garcinia mangostana 49.7±4.0ab 104.7±7.7abc
R7 Sapindus rarak 53.5±4.3efg 112.6±9.0fghi R8 Leucaena leucocephala 52.1±2.9def 109.8±6.1efg R9 Calliandra calothyrsus 52.1±4.0def 109.7±10.6efg
R10 Cinnamomum verum 50.3±3.0abcd 105.9±6.3abcde R11 Zingiber zerumbet 54.5±3.6gh 114.8±7.7hij R12 Morinda citrifolia 54.7±2.7gh 115.3±5.8ij R13 Melastoma candidum 54.1±3.6fgh 113.9±7.6ghij R14 Manihot utilissna 53.5±2.8efg 112.6±6.0fghi R15 Hibiscus rosa-sinensis 53.5±2.8efg 112.8±6.0fghi R16 Sida rhombifolia 53.5±3.8efg 112.7±8.0fghi
R17 Gnetum gnemon 54.5±3.2gh 114.7±6.8hij
R18 Gliricidia sepium 55.0±2.4gh 115.9±17.1ij R19 Areca catechu 51.3±4.0bcde 107.8±8.3abcde R20 Psidium guajava 49.7±2.0ab 104.6±4.2ab R21 Moringa oleifera 52.1±2.1def 109.7±4.3efg R22 Phaleria macrocarpa 53.5±1.8efg 112.7±3.8fghi R23 Hibiscus sabdariffa 54.1±3.1fgh 114.1±6.6ghij R24 Azadirachta indica 51.9±2.6cdef 109.3±5.5def R25 Murraya paniculata 52.1±1.9def 109.7±4.1efg R26 Sesbania glandifora 52.3±2.5def 110.3±5.3efgh R27 Persca americana 50.5±1.9abcd 106.2±3.9abcde R28 Carica papaya 51.9±2.5cdef 109.2±5.1cdef R29 Annona muricata 49.9±1.8abc 105.0±3.8abcd R30 Curcuma zedoaria 49.8±1.7abc 104.8±3.5abc R31 Andrographis paniculata 49.1±2.1a 103.3±4.4a R32 Orthosiphon aristatus 50.9±1.4abcd 107.2±3.0abcde R33 Artocarpus heterophyllus 51.5±2.7bcde 108.5±5.7bcdef
Numbers within the same coloumn which are followed by different letters are significantly different at P<0.05; DM: Dry Matter;
15
Sofyan et al. (2016) stated that the utilization of 100% rice straw produced lowest 20 ml of total gas, 24,38% of DMD and 21.85% of OMD. Their diet contained 6.56% of crude protein, 79.29% of NDF and 72.26% of ADF. The proximate analysis result of rice straw showed that its protein content was 2.82% of crude protein, its NDF was 70.84% and its ADF was 48.54% (Table 1). The difference of protein content obtained could be caused by the difference in harvesting age of the rice straw. The young plant has a higher protein content. In addition, the different location of harvesting and environmental condition of places where plant grows are the other factors (Jayanegara et al. 2009).
Piper albi increased total gas production significantly (P<0.05, Table 8) from the control and produced the highest total gas in this study. The increase of total gas production (ml) was 9% (Table 8). Chao et al. (2000) stated that most secondary compound of Piper nigrum L. were Sabinene 19.4%, Limonene 17.5% and ß-Caryophyllene 14.7%. Their potential to manipulate ruminal fermentation were as means of improving feed efficiency and nutrient utilization by ruminants. Different chemical nature, concentration and secondary metabolites activity within plants affect differences in the activity of the secondary compounds of the plants (Garcia-Gonzales et al. 2008). Unfortunately, Piper albi was also increased methane gas production so it was not one candidate of methane inhibitor in this study. Its secondary compound concentration and activity was not higher than
Sapindus rarak. The total gas production increase of Sapindus rarak was not higher than Piper albi 4,7% from control, but it decresed methane gas production highly significantly (P<0.01) 10% from control (Table 9). Saponin concentration
of Sapindus rarak affected more effectively than secondary compound
concentration of Piper albi.
Total gas production, one parameter, indicates rumen fermentation and degradability process of organic matter and dry matter. Total gas products were low so the other ruminal fermentation profile were also low. It could be seen on Figure 2. There was a positive correlation (P<0.01; r2=0.4083) which showed that more fermentable organic matters or soluble carbohydrate fraction digested more total gas produced and increased. It had a meaning from the equation y = 0.7927x + 21.761. One ml organic matter was degraded then 22.5537% total gas were produced.
Figure 2. Correlation of total gas production (ml) and organic matter degradability (%)
34.0 35.0 36.0 37.0 38.0 39.0 40.0 41.0 42.0
16
Estimated Methane Gas Production
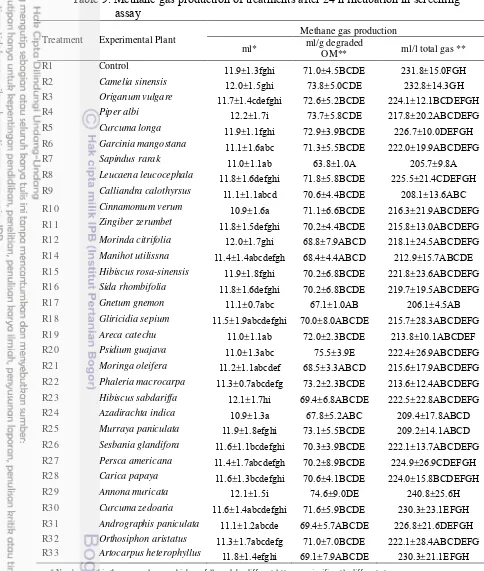
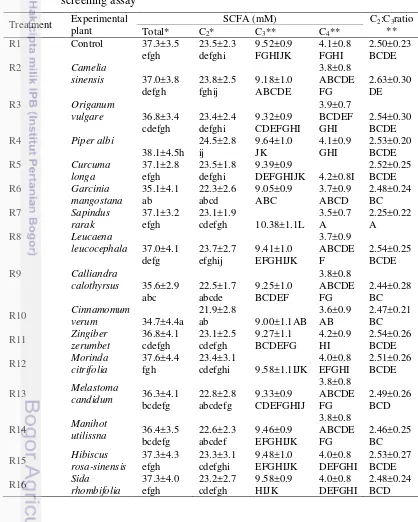
In screening assay, almost tropical plants had tendency to decrease estimated methane gas production highly significantly (P<0.01). The results showed that Sapindus rarak addition decreased highly significantly 10% (P<0.01; Table 9) estimated methane gas production (ml/g DOM) after 24 hour incubation, compared to control. Gnetum gnemon and Azadirachta indica supplementation decreased (P>0.01) 5.5% and 4.5% estimated methane gas production (ml/g DOM), compared to control. The difference of each treatment was because of the rumen fluid, incubation condition, and substrate (Jayanegara 2008).
All of those plants were three best and effective candidates which could decrease estimated methane production that had higher percentage of estimated methane reduction than the other treatments. It was in line with Guo et al. (2008) that supplementation of 0.4 mg/ml tea saponin intobasal substrate reduced methane production by 8% than that of control. The most secondary compound of three best candidates were saponin and tannin (Table 2). The lowest methane gas production in this study was produced from Sapindus rarak. In this study, saponin didn`t inhibit total bacteri growth, it was due to bacteri had prokaryotic cell.
Wina et al. (2005) stated that saponin had an ability to make a bound with eukaryotic cell membrane cholesterol (protozoa) so saponin only affected protozoa population without hampering bacterial growth. Bacterial adaptation to saponin was by developing bacterial ability to degrade saponin in short time. Saponin was called as methane inhibitor (defaunating agent).
Reduction of estimated methane gas production (ml/g degraded OM) of
Sapindus rarak (10%) was followed by increase of propionic acid (9%), reduction of ratio of C2:C3 (10.28%) and decrease of ratio of CH4:CO2 (5.98%) (Table 9; Table 10 and Table 14). Methane gas formation via methanogenesis pathway affected to final product of ruminal fermentation especially to produced ATP mole amount, then ruminal microbial production efficiency will be high (Pinares-Patino
et al. 2001).
17
Table 9. Methane gas production of treatments after 24 h incubation in screening assay
Treatment Experimental Plant Methane gas production
ml* ml/g degraded
OM** ml/l total gas **
R1 Control 11.9±1.3fghi 71.0±4.5BCDE 231.8±15.0FGH
R2 Camelia sinensis 12.0±1.5ghi 73.8±5.0CDE 232.8±14.3GH
R3 Origanum vulgare 11.7±1.4cdefghi 72.6±5.2BCDE 224.1±12.1BCDEFGH
R4 Piper albi 12.2±1.7i 73.7±5.8CDE 217.8±20.2ABCDEFG
R5 Curcuma longa 11.9±1.1fghi 72.9±3.9BCDE 226.7±10.0DEFGH
R6 Garcinia mangostana 11.1±1.6abc 71.3±5.5BCDE 222.0±19.9ABCDEFG
R7 Sapindus rarak 11.0±1.1ab 63.8±1.0A 205.7±9.8A
R8 Leucaena leucocephala 11.8±1.6defghi 71.8±5.8BCDE 225.5±21.4CDEFGH
R9 Calliandra calothyrsus 11.1±1.1abcd 70.6±4.4BCDE 208.1±13.6ABC
R10 Cinnamomum verum 10.9±1.6a 71.1±6.6BCDE 216.3±21.9ABCDEFG
R11 Zingiber zerumbet 11.8±1.5defghi 70.2±4.4BCDE 215.8±13.0ABCDEFG R12 Morinda citrifolia 12.0±1.7ghi 68.8±7.9ABCD 218.1±24.5ABCDEFG
R14 Manihot utilissna 11.4±1.4abcdefgh 68.4±4.4ABCD 212.9±15.7ABCDE
R15 Hibiscus rosa-sinensis 11.9±1.8fghi 70.2±6.8BCDE 221.8±23.6ABCDEFG
R16 Sida rhombifolia 11.8±1.6defghi 70.2±6.8BCDE 219.7±19.5ABCDEFG
R17 Gnetum gnemon 11.1±0.7abc 67.1±1.0AB 206.1±4.5AB
R18 Gliricidia sepium 11.5±1.9abcdefghi 70.0±8.0ABCDE 215.7±28.3ABCDEFG
R19 Areca catechu 11.0±1.1ab 72.0±2.3BCDE 213.8±10.1ABCDEF
R20 Psidium guajava 11.0±1.3abc 75.5±3.9E 222.4±26.9ABCDEFG
R21 Moringa oleifera 11.2±1.1abcdef 68.5±3.3ABCD 215.6±17.9ABCDEFG
R22 Phaleria macrocarpa 11.3±0.7abcdefg 73.2±2.3BCDE 213.6±12.4ABCDEFG
R23 Hibiscus sabdariffa 12.1±1.7hi 69.4±6.8ABCDE 222.5±22.8ABCDEFG
R24 Azadirachta indica 10.9±1.3a 67.8±5.2ABC 209.4±17.8ABCD
R25 Murraya paniculata 11.9±1.8efghi 73.1±5.5BCDE 209.2±14.1ABCD
R26 Sesbania glandifora 11.6±1.1bcdefghi 70.3±3.9BCDE 222.1±13.7ABCDEFG
R27 Persca americana 11.4±1.7abcdefgh 70.2±8.9BCDE 224.9±26.9CDEFGH
R28 Carica papaya 11.6±1.3bcdefghi 70.6±4.1BCDE 224.0±15.8BCDEFGH
R29 Annona muricata 12.1±1.5i 74.6±9.0DE 240.8±25.6H
R30 Curcuma zedoaria 11.6±1.4abcdefghi 71.6±5.9BCDE 230.3±23.1EFGH
R31 Andrographis paniculata 11.1±1.2abcde 69.4±5.7ABCDE 226.8±21.6DEFGH
R32 Orthosiphon aristatus 11.3±1.7abcdefg 71.0±7.0BCDE 222.1±28.4ABCDEFG
R33 Artocarpus heterophyllus 11.8±1.4efghi 69.1±7.9ABCDE 230.3±21.1EFGH
* Numbers within the same coloumn which are followed by different letters are significantly different at