Estimation of regional mass anomalies from Gravity Recovery and Climate Experiment
(GRACE) over Himalayan region
Ritesh Agrawal, S. K. Singh, A. S. Rajawat and Ajai
Space Applications Centre, Indian Space research Organization, Ahmedabad-380015 [email protected]
Keywords: Water Equivalent height (WEH), GRACE, Himalaya
Abstract:
Time-variable gravity changes are caused by a combination of postglacial rebound, redistribution of water and snow/ice on land and as well as in the ocean. The Gravity Recovery and Climate Experiment (GRACE) satellite mission, launched in 2002, provides monthly average of the spherical harmonic co-efficient. These spherical harmonic co-efficient describe earth’s gravity field with a resolution of few hundred kilometers. Time-variability of gravity field represents the change in mass over regional level with accuracies in cm in terms of Water Equivalent Height (WEH). The WEH reflects the changes in the integrated vertically store water including snow cover, surface water, ground water and soil moisture at regional scale. GRACE data are also sensitive towards interior strain variation, surface uplift and surface subsidence cover over a large area.
GRACE data was extracted over the three major Indian River basins, Indus, Ganga and Brahmaputra, in the Himalayas which are perennial source of fresh water throughout the year in Northern Indian Plain. Time series analysis of the GRACE data was carried out from 2003-2012 over the study area. Trends and amplitudes of the regional mass anomalies in the region were estimated using level 3 GRACE data product with a spatial resolution at 10 by 10 grid provided by Center for Space Research (CSR), University of Texas at Austin. Indus basin has shown a subtle decreasing trend from 2003-2012 however it was observed to be statistically insignificant at 95% confidence level. Ganga and Brahmaputra basins have shown a clear decreasing trend in WEH which was also observed to be statistically significant. The trend analysis over Ganga and Brahamputra basins have shown an average annual change of -1.28 cm and -1.06 cm in terms of WEH whereas Indus basin has shown a slight annual change of -0.07 cm. This analysis will be helpful to understand the loss of mass in terms of WEH over Indian Himalayas and will be crucial for hydrological and climate applications at regional scale.
1. INTRODUCTION
The Earth’s global gravity field can be defined by tracking the LEO satellites. When the satellites passing over the mass anomalies, disturbances in the LEO satellite occurs due to attraction of gravity field (Avsar and Ustun, 2012). Keeping this in mind a joint mission, Gravity Recovery And Climate Experiment (GRACE), between National Aeronautics and Space Administration and Deutschen Zentrum f¨ur Luft- und Raumfahrt (NASA/DLR) were launched on March 17, 2002 from the Plesetsk Cosmodrome in Russia under the NASA Earth System Science Pathfinder Program (ESSP). The satellites were equipped with dual-frequency, K-band microwave ranging (KBR) separated by ∼200 km to continuously monitor the variation in distance between the satellites due to varying gravity field of the earth. The satellites also consist with high precision accelerometers (ACC) for measuring the non-gravitational accelerations, highly precise Global Positioning System (GPS) receiver for absolute positioning and star cameras for satellite attitude determination (Tapley et. al, 2005). The primary goal of GRACE mission was to estimate the time varying gravity field mapping for earth science studies, especially monitoring of hydrological mass redistribution through their integrated gravitational effect (Tapley et al., 2004).
The principle of the GRACE satellite system is based on satellite-to-satellite tracking (SST), both in the high–low mode (SST-hl) and low–low mode (SST-ll) (Liu 2008). In SST-hl mode the LEO satellite is monitor through the GPS satellite which are at higher altitude. In this case, LEO satellite orbit is disturbed due to mass anomalies (Figure 1), by which the gravity field can be recovered using the measurements of non-gravitational acceleration through three-axis accelerometer. SST-ll mode will not only provide the static gravity field with
the higher resolution but it will also give the temporal resolution with adequate spatial resolutions. In SST-ll mode two GRACE satellites are tracked with the help of K-band microwave ranging instruments. With the combination of SST-hl and SST-ll mode the accuracy and resolution of the gravity map is enhanced and produce a detail map of the earth gravity field (Liu, 2008). In other words, gravity field changes sensed by the twin GRACE satellites, and GPS networks gives the effect of all mass redistributions and mass variability within the Earth and its fluid envelops (Kusche and Schrama, 2005).
Figure1: A schematic diagram of GRACE-1 Mission Concept
The earth’s gravity field measured at approximately monthly intervals with a spatial resolution of a few hundred kilometers (Klees et. al, 2007). These monthly estimates of the Earth’s gravity field produced by the GRACE give information about the mass variability at and below the surface of the Earth (Wahr et al., 2006). From the gravity field measurements, the accuracy of better than 1 cm of equivalent water thickness is expected (Swenson and Wahr, 2002).
The International Archives of the Photogrammetry, Remote Sensing and Spatial Information Sciences, Volume XL-8, 2014 ISPRS Technical Commission VIII Symposium, 09 – 12 December 2014, Hyderabad, India
This contribution has been peer-reviewed.
Each monthly solution consists of a set of spherical harmonic coefficients complete to degree and order. The seasonal gravity variation can be measured by the differencing of the monthly solution by taking one solution as a reference gravity field. The differences in the seasonal gravity field are caused by post glacial rebound, atmospheric and ocean mass transport and redistribution of water, snow and ice on land. To understand the gravity field behavior on the land, GRACE measurements have already been corrected for the major contribution variation due to ocean and atmosphere. Therefore differences between monthly solutions mainly consists changes in terrestrial water storage (TWS), i.e. groundwater, soil moisture, rivers, lakes, snow, and ice (Klees et. al, 2007). GRACE observations has no vertical resolution ( Wahr et al., 2006 ) and it reflects changes in vertically integrated stored water, which includes variations from snow pack, glaciated areas, surface water, soil moisture, and ground water at different depths (Longuvergne et al., 2010). Due to combination of different storage factor, it is not possible to compute whether the variation in mass is caused due to change in Land surface, subsurface or atmospheric component (Wahr et al., 2006). The extraction of water from any one of the storage component (e.g., snow cover) requires disaggregating the vertically integrated water storage observation, either by making assumptions or by using different models to eliminate other components. For understanding of the hydrological cycle the monitoring of the total water storage as surface and subsurface is essential for understanding of hydrological cycle in climate change environment (Tiwari, V. M. et. al., 2009) to understand seasonal behavior, where climate-driven mass transport of water plays a major role towards gravity (Davis l. J. et.al, 2008). Snow packs and glaciers is a very important component of the Earth’s climate system (Su et al., 2010). In the Himalayan region, regional scales show large variations in terms of snow water equivalent over a season. The accurate estimation of snowpack and its variation is important for various hydrological applications. In this study the GRACE data were analyzed over a decade (2003-2012) to understand the seasonal behavior over Himalaya region, which mainly cover three major basin over India such as Indus basin, Ganga Basin and Brahamputra basin. The components such as the annual variability, and rate of mass change were estimated over the study area.
2. STUDY AREA
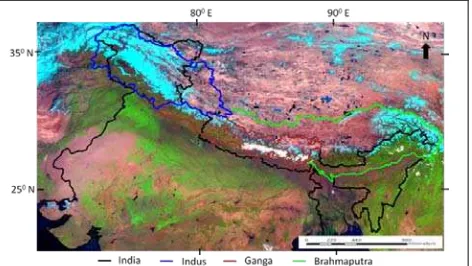
The study area extends in the south-east from latitude 250 39’ N and longitude 970 46’ E (approx.) to north-west up to latitude 370 05’ N and longitude 720 14’ E (approx.) in the Himalayas, Trans-Himalaya and Karakoram regions across four countries viz. India, Nepal, Bhutan and China (Tibet). In the present study, it has been broadly categorized into Indus, Ganga and Brahmaputra basins. The three mighty rivers originate from the glacierized Himalayan region where they are fed by seasonal snow and glacier melt water. This also coincides with the source of moisture in the form of snow/rainfall precipitation. The geographical classification of region broadly coincides with the source of moisture because Southeastern monsoon is more active in eastern Himalayas (decreases westwards) whereas northwestern disturbance is more active in western Himalayas (decreases eastwards). Indus, Ganga and Brahmaputra basins have a total geographic area of 1.9 ×10⁵ sq km, 0.6 ×10⁵ sq km and 1.2 ×10⁵ sq km respectively, with 0.95 million km2 area mapped under glacier inventory (Sharma et al., 2013). Figure 2 depicts the location map of the study area.
Figure 2: Location of study area consisting three major river basins Indus, Ganga and Brahmaputra in the Himalayas (background image is INSAT 3A-CCD).
3. DATA USED
The GRACE data are collected at GRACE science data system, which is shared between Jet Propulsion Laboratory (JPL), University of Texas Center for Space Research (CSR) and Deutsches GeoForschungs Zentrum (GFZ) and available online at official data processing repository http://podaac.jpl.nasa.gov/grace/ (CSR, GFZ, JPL). The different components contributed in the GRACE measurement were analyzed with the help of models such as diurnal and semidiurnal tides (FES 2004), Solid Earth tidal contribution to geo-potential and solid Earth pole tide (IERS 2003) and Ocean pole tide defined based on satellite altimetry data (Liu, 2008). Similarly dataset are also corrected with variable atmospheric conditions by AOD1B products. The remaining gravity changes are interpreted as monthly vertically integrated stored water of snow packs, ground water and soil moisture in terms of water equivalent Height (WEH).
The data is further enhanced with the help of two filtering techniques to reduce the presence of the measurement errors. First filter is designed for removing of correlated errors between spherical harmonic coefficients, which is manifested as stripes oriented towards North-South in GRACE maps (Swenson and Wahr, 2006). Second filter is a Gaussian averaging filter with a half width of 300 Km which reduces random errors in higher degree co-efficient (Wahr et.al, 2006). After filtering to reduce the presence of the measurement errors, data translates into global sets of localized surface mass concentrations termed as “mascons”, which omits the direct use of the spherical harmonics coefficient. The mascons datasets are available with a spatial resolution of 10x 10
4 METHODOLOGY
resolution cell. In this study the monthly mascons data from the CSR processing agency were download from a period of ten years (2003-2012).
Observations of secular WEH are relevant for the indicator of climate change and mass variations within the Earth. Quantitative analyses of secular and seasonal mass anomaly were conducted. The inter-annual and seasonal mass anomaly gravity field changes are also estimated. A weighted least-squares fit was used to estimate the annual cosine (winter-summer) component, the annual sine (spring-fall) component, and a linear trend for over a decade of the GRACE gravity fields as given in equation 1.
The International Archives of the Photogrammetry, Remote Sensing and Spatial Information Sciences, Volume XL-8, 2014 ISPRS Technical Commission VIII Symposium, 09 – 12 December 2014, Hyderabad, India
This contribution has been peer-reviewed.
(1)
time in month
and ω= angular frequency of periodic variations.
The model component a1
Figure 3. Spatial secular changes in the Himalaya region gives the secular mass changes as shown in Figure 3. The observations from the models clearly shows the large negative secular trends in the Ganga and the Brahmaputra glaciated basin, while Indus Basin clearly indicates mixed changes i.e, the positive and negative secular trends.
The magnitude of the annual mass variability can be computed as
(2) where
Aam
Figure 4: Annual mass variability in Himalaya Region. It is observed there is large spatial variation in the Himalayan basin in terms of the mass variability.
is annual variability.
The Figure 4 indicates the magnitude of mass variability over Himalaya region.
The annual variability shows the mass variation in a year due to the seasonal behavior due to precipitation, snowfall, evaporation, surface/subsurface movement of water and groundwater extraction.
5 RESULTS AND DISCUSSION
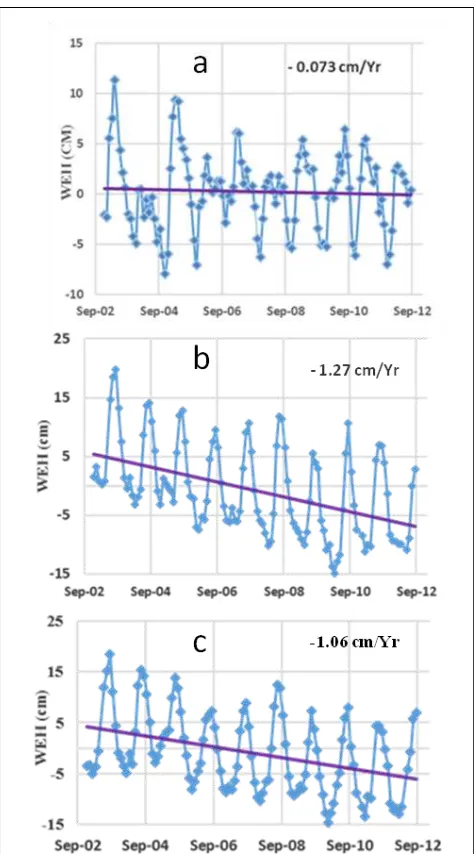
The gridded data of Water Equivalent Height (WEH) for the Himalayan region were used for statistical analysis and estimation for the secular trends over the Indus, Ganga and Brahmaputra Basins. The temporal profile of spatial averaging of WEH over Indus, Ganga and Brahmaputra basins are shown in Figure 5.
The trend analysis over Ganga and Brahmaputra basins have shown an average annual change of -1.28 cm and -1.06 cm in terms of WEH whereas Indus basin has shown a slight annual change of -0.07 cm. Indus basin has shown a subtle decreasing trend from 2003-2012 however it was observed to be statistically insignificant at 95% confidence level. Ganga and
Figure 5. Annual variability plots and trend line over a) Indus, b) Ganga and c) Brahmaputra basins respectively
The International Archives of the Photogrammetry, Remote Sensing and Spatial Information Sciences, Volume XL-8, 2014 ISPRS Technical Commission VIII Symposium, 09 – 12 December 2014, Hyderabad, India
This contribution has been peer-reviewed.
Brahmaputra basins have shown a clear decreasing trend in WEH which was also observed to be statistically significant.
6 CONCLUSION
The GRACE gravity field gives information about the mass variability and it is useful to understand the behavior of the climate change. However this analysis does not extract the effect of the groundwater extraction and the trends over the basin includes the effect of groundwater extraction, soil moisture and snow packs. To quantify the effect of the changes due to snowpack the effect of the groundwater and soil moisture has to be subtracted. The analysis over a decade from 2003-2012 over Indian Himalaya gives indication of the deceasing of the mass in terms of the WEH. Such information will be useful for hydrological and climate applications at regional scale. The next mission GRACE-2 with increased resolution is also demanding for scientific community to better understand of the climate dynamics over the earth.
7 ACKNOWLEDGEMENT
Authors express their sincere gratitude to Shri. A. S. Kiran Kumar, Director, Space Applications Centre, Ahmedabad for his keen interest and guidance. Authors are thankful to Dr. P. K. Pal, Deputy Director EPSA, and Dr. Manab Chakraborty, Group Director GSAG Space Applications Centre for their valuable suggestions during the study.
8 REFERENCES
1. Avsar N B and Ustun A, 2012. Analysis of Regional Time-Variable Gravity Using GRACE’s 10-day Solutions FIG Working Week 2012 Knowing to manage the territory, protect the environment, evaluate the cultural heritage Rome, Italy, 6-10 May.
2. Davis j L, Tamisiea M E, Elo´segui P, Mitrovica J X and Hill E M, 2008. A statistical filtering approach for Gravity Recovery and Climate Experiment (GRACE) gravity data, Journal Of Geophysical Research, Vol. 113, B04410, doi:10.1029/2007JB005043.
3. Klees R, Zapreeva E A, Winsemius H C, and Savenije H H G, 2007. The bias in GRACE estimates of continental water storage Variations, Hydrol. Earth Syst. Sci., 11, pp 1227–1241.
4. Kusche J and Schrama E J O, 2005. Surface mass redistribution inversion from global GPS deformation and Gravity.
5. Liu X, 2008. Global gravity field recovery from satellite-to-satellite tracking data with the acceleration approach, PhD thesis, Netherlands Geodetic Commission, Publications on Geodesy, 68, Delft, The Netherlands.
6. Longuevergne L, Scanlon B R and Wilson C R, 2010. GRACE Hydrological estimates for small basins: Evaluating processing approaches on the High Plains Aquifer, USA, Water Resources Research, Vol. 46, W11517, doi:10.1029/2009WR008564.
7. Sharma, A.K., Singh, S.K., Kulkarni A. V. and Ajai, 2013, Glacier Inventory in Indus, Ganga and Brahmaputra Basins of the Himalaya, National Academy Science Letters, DOI 10.1007/s40009-013-0167-6, pp 1-9.
8. Su H, Yang Z L, Dickinson R E, Wilson C R and Niu G Y, 2010. Multisensor snow data assimilation at the continental scale: The value of Gravity Recovery and Climate Experiment
terrestrial water storage information, J. Geophys. Res., 115, D10104, doi:10.1029/2009JD013035.
9. Swenson S and Wahr J, 2002. Methods for inferring regional surface-mass anomalies from Gravity Recovery and Climate Experiment (GRACE) measurements of time-variable gravity, J. Geophys. Res., 107(B9), doi:10.1029/2001JB000576.
10. Swenson S and Wahr J, 2006. Post-processing removal of correlated errors in GRACE data, Geophysical Research Letters, 33, L08402, doi:10.1029/2005GL025285.
Tapley B D, Bettadpur S, Ries J C, Thompson P F, Watkins M M, 2004. GRACE measurements of mass variability in the Earth system. Science, 305, pp 503–505.
11. Tapley B D, Ries J C, Bettadpur S, Chambers D, Cheng M, Condi F, Gunter B, Kang Z, Nagel P, Pastor R, Pekker T, Poole S and Wang F, 2005. GGM02 – An improved Earth gravity field model from GRACE, J Geod, 79, pp 467-478, DOI 10.1007/s00190-005-0480-z.
12. Tiwari V M, Wahr J and Swenson S, 2009. Dwindling groundwater resources in northern India, from satellite gravity observations, Geophys. Res. Lett., 36, L18401, doi:10.1029/2009GL039401.
13. Wahr J, Swenson S, and Velicogna I, 2006. Accuracy of GRACE mass estimates, Geophys. Res. Lett., 33, L06401, doi:10.1029/2005GL025305.
The International Archives of the Photogrammetry, Remote Sensing and Spatial Information Sciences, Volume XL-8, 2014 ISPRS Technical Commission VIII Symposium, 09 – 12 December 2014, Hyderabad, India
This contribution has been peer-reviewed.