LAMPIRAN A
HASIL UJI MUTU FISIK GRANUL
Mutu fisik F A F B F C F D Persyaratan
LAMPIRAN B
HASIL UJI KEKERASAN TABLET
Replikasi I
No
Kekerasan Tablet Kaptopril (kp)
Formula Formula Formula Formula
A B C D
1. 15.36 13.74 11.03 10.15
2. 15.47 13.86 11.24 10.12
3. 15.33 13.75 11.73 10.41
4. 15.51 13.91 11.23 10.16
5. 15.58 13.64 11.21 10.21
6. 15.49 13.62 11.15 10.19
7. 15.54 13.68 11.49 10.07
8. 15.61 13.83 11.31 10.18
9 15.58 13.76 11.25 10.25
10. 15.,63 13.08 11.29 10.02
Rata-rata + SD 15.50 ± 0.10 13.69 ± 0.23 11.29 ± 0.19 10.19 ± 0.12
SDrel 0.63 1.7 1.71 1.15
Replikasi II
N0.
Kekerasan Tablet Kaptopril (kp)
Formula Formula Formula Formula
A B C D
1. 15.53 13.98 11.01 10.19
2. 15.67 13.79 11.28 10.23
3. 15.41 13.82 11.36 10.16
4. 15.58 13.65 11.25 10.11
5. 15.44 13.17 11.32 10.21
6. 15.56 13.75 11.51 10.33
7. 15.38 13.93 11.23 10.36
8. 15.54 13.73 11.49 10.41
9 15.59 13.64 11.21 10.15
10. 15.47 13.37 11.26 10.38
Rata-rata ±
SD 15.52 ± 0.10 13.68 ± 0.25 11.29 ± 0.14 10.26 ± 0.12
Replikasi III
N0.
Kekerasan Tablet Kaptopril (kp)
Formula Formula Formula Formula
A B C D
1. 15.29 13.26 11.23 10.23
2. 15.34 13.24 11.14 10.32
3. 15.57 13.25 11.24 10.12
4. 15.48 13.31 11.49 10.07
5. 15.35 13.26 11.32 10.15
6. 15.58 13.23 11.19 10.19
7. 15.32 13.15 11.23 10.42
8. 15.47 13.09 11.05 10.21
9 15.56 13.78 11.37 10.05
10. 15.59 13.16 11.27 10.22
Rata-rata ± SD 15.46 ± 0.12 13.27 ± 0.19 11.25 ± 0.12 10.18 ± 0.12
LAMPIRAN C
HASIL UJI KERAPUHAN TABLET KAPTOPRIL
Formula A Formula B Replikasi Berat Awal (g) Berat Akhir (g) Kerapuhan (%)
I 6.16 6.13 0.48701
II 6.19 6.16 0.48465
III 6.17 6.14 0.48622
Rata-rata= 0.486 SD= 0.001
KV= 0.247
Formula C Replikasi Berat Awal
(g)
Berat Akhir (g)
Kerapuhan (%)
I 6.05 6.04 0.16529
II 6.20 6.19 0.16129
III 6.18 6.17 0.16181
Rata-rata= 0.163 SD= 0.002
KV= 1.335
Replikasi Berat Awal (g) Berat Akhir (g) Kerapuhan (%)
I 6.12 6.10 0.32680
II 6.13 6.11 0.32626
III 6.17 6.15 0.32415
Rata-rata= 0.326 SD= 0.001
Formula D
Replikasi Berat Awal (g)
Berat Akhir (g)
Kerapuhan (%)
I 6.09 6.06 0.49261
II 6.15 6.12 0.48780
III 6.18 6.15 0.48544
Rata-rata= 0.48862 SD= 0.003655363
LAMPIRAN D
HASIL UJI KESERAGAMAN BOBOT TABLET
Replikasi
No F1 F2 F3 F4
Bobot Y (%) Bobot Y(%) Bobot Y(%) Bobot Y(%)
1 300.3 100.92 300.8 99.73 301.3 100.13 301.8 100.04 2 301.3 101.26 301.1 99.83 300.9 99.99 300.5 99.61 3 298.7 100.39 298.7 99.04 299.6 99.56 299.6 99.31 4 302.1 101.53 300.4 99.6 299.7 99.59 300.7 99.67 5 299.2 100.55 300.9 99.77 300.7 99.93 298.9 99.08 6 300.4 100.96 298.5 98.97 302.5 100.52 301.8 100.04 7 298.1 100.18 302.2 100.2 300.2 99.76 299.9 99.41 8 302.5 101.66 299.3 99.24 298.6 99.23 301.3 99.87 9 297.3 99.92 301.6 100 301.3 100.13 297.6 98.65 10 300.3 100.92 300.5 99.63 300.8 99.96 302.7 100.34 X rata 300.02 100.83 300.4 99.6 300.6 99.88 300.5 99.6
PK
(%) 100.83 99.6 99.88 99.6
SD 0.57 0.4 0.36 0.51
Replikasi 2
No F1 F2 F3 F4
Bobot Y (%) Bobot Y(%) Bobot Y(%) Bobot Y(%)
1 302.3 100.47 300.5 99.13 301.3 100.75 300.8 100.68 2 297.4 98.84 298.8 98.57 299.8 100.25 298.4 99.87 3 301.2 100.11 301.7 99.52 298.6 99.85 301.6 100.94 4 302.9 100.67 299.6 98.83 300.4 100.45 300.7 100.64 5 300.7 99.94 302.3 99.72 301.2 100.72 299.8 100.34 6 299.9 99.67 300.9 99.26 299.3 100.09 302.1 101.11 7 302.6 100.57 299.9 98.93 300.7 100.55 300.5 100.58 8 295.4 98.18 301.4 99.42 301.5 100.82 299.4 100.21 9 303.8 100.97 299.7 98.86 299.9 100.29 300.8 100.68 10 302.9 100.67 301.8 99.56 300.6 100.52 300.7 100.64
X
rata 300.9 100.01 300.7 99.18 300.3 100.43 300.5 100.57 PK
(%) 100.01 99.18 100.43 100.57
SD 0.89 0.38 0.31 0.36
Replikasi 3
No F1 F2 F3 F4
Bobot Y (%) Bobot Y(%) Bobot Y(%) Bobot Y(%)
1 301.3 100.93 300.6 99.41 300.9 99.85 301.2 99.46 2 300.5 100.66 298.7 98.78 299.8 99.48 300.5 99.23 3 298.4 99.96 300.9 99.51 300.4 99.68 299.8 99 4 300.2 100.56 299.6 99.08 298.7 99.12 301.4 99.53 5 299.7 100.4 301.8 99.81 296.5 98.39 298.7 98.64 6 300.4 100.63 300.2 99.28 300.8 99.82 300.3 99.16 7 301.3 100.93 299.8 99.15 302.3 100.31 299.9 99.03 8 304.2 101.9 298.5 98.72 299.5 99.38 301.5 99.56 9 298.3 99.93 302.2 99.94 300.7 99.78 299.4 98.87 10 302.1 101.2 300.9 99.51 301.9 100.18 300.8 99.33
X
rata 300.6 100.71 300.3 99.32 300.2 99.6 300.4 99.18 PK
(%) 100.71 99.32 99.6 99.18
SD 0.58 0.4 0.55 0.3
LAMPIRAN E
HASIL PENETAPAN KADAR TABLET KAPOPRIL
Formula A
Replikasi Absorbansi C Sampel C teotiris Kadar % I 0.6265 9.176056338 9.057 101.3145229 II 0.6281 9.198591549 9.108 100.9946371 III 0.6273 9.187323944 9.171 100.1779952 = 100.8290518 SD = 0.586078203
KV = 0.581259262
Formula B
Replikasi Absorbansi C Sampel C teotiris Kadar % I 0.6290 9.211267606 9.003 102.3133134 II 0.6275 9.190140845 9.075 101.2687696 III 0.6314 9.245070423 9.087 101.7395226 = 101.7738686 SD = 0.523118197
KV = 0.514000504
Formula C
Replikasi Absorbansi C Sampel C teotiris Kadar % I 0.6310 9.23943662 9.006 100.695512 II 0.6327 9.263380282 9.057 102.433289 III 0.6273 9.187323944 9.219 102.406529 = 101.5090331 SD = 0.995670978
KV = 0.980869334
Formula D
Replikasi Absorbansi C Sampel C teotiris Kadar % I 0.6330 9.267605634 9.054 103.021306 II 0.6362 9.312676056 9.156 102.55335 III 0.6336 9.276056338 9.252 100.020895
= 101.4434791 SD = 1.61424788
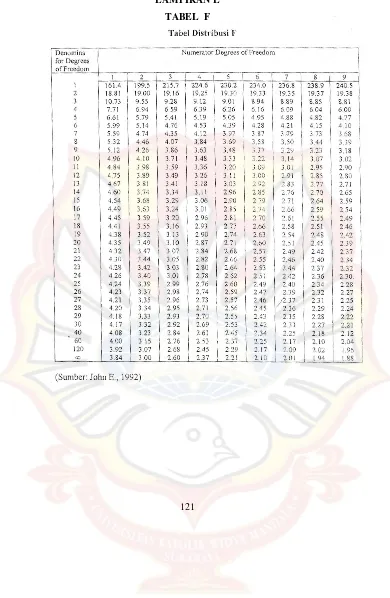
LAMPIRAN F
HASIL UJI DISOLUSI TABLET LEPAS LAMBAT KAPTOPRIL
Formula A
Waktu Replikasi Rata-rata SD KV
I II III
30 40.36 40.64 40.92 40.64 0.23 0.56 60 42.59 42.31 42.59 42.50 0.13 0.31 90 46.91 42.87 44.26 44.68 1.68 3.75 120 48.44 44.82 47.32 46.86 1.51 3.23 180 51.64 44.96 50.52 49.04 2.92 5.96 240 52.47 53.31 53.17 52.98 0.37 0.69 300 54.7 53.73 53.86 54.10 0.43 0.79 360 55.67 55.53 55.81 55.67 0.11 0.21
Formula B
Waktu Replikasi Rata-rata SD KV
I II III
Formula C
Waktu Replikasi Rata-rata SD KV
I II III
30 59.94 60.54 60.27 60.25 0.25 0.41 60 61.64 62.06 61.92 61.87 0.17 0.28 90 63.85 63.57 63.16 63.53 0.28 0.45 120 65.5 65.63 66.05 65.73 0.23 0.36 180 67.01 67.29 66.87 67.06 0.17 0.26 240 70.17 69.9 70.45 70.17 0.22 0.32 300 72.79 73.2 73.06 73.02 0.17 0.23 360 73.89 73.75 74.03 73.89 0.11 0.15
Formula D
Waktu Replikasi Rata-rata SD KV
I II III
LAMPIRAN G
HASIL UJI FLOATING LAG TIME TABLET LEPAS LAMBAT
KAPTOPRIL
Formula A
Replikasi Floating lag time
(menit) Rata-rata SD KV (%)
I 1.79
1.77 0.030551 1.73
II 1.75
III 1.81
Formula B
Replikasi Floating lag time
(menit) Rata-rata SD KV (%)
I 0.73
0.75 0.061101 8.15
II 0.77
III 0.85
Formula C
Replikasi Floating lag time
(menit) Rata-rata SD KV (%)
I 0.59
0.605 0.025166 4.16
II 0.62
III 0.57
Formula D
Replikasi
Floating lag time
(menit) Rata-rata SD KV (%)
I 0.37
0.36 0.025166 6.99
II 0.35
LAMPIRAN H
HASIL KESERAGAMAN KANDUNGAN
Hasil Uji Keseragaman Kandungan Tablet Formula A replikasi I
Hasil Uji Keseragaman Kandungan Tablet Formula A replikasi II Repli
kasi Absorbansi C sampel
W sampel
(mg) C teoritis Kadar (%) 1 0.634 9.2816901 300.3 9.009 103.0268636 2 0.629 9.2112676 299.8 8.994 102.415695 3 0.623 9.1267606 299.9 8.997 101.4422648 4 0.631 9.2394366 299.7 8.991 102.7631701 5 0.639 9.3521127 300.2 9.006 103.8431343 6 0.635 9.2957746 299.6 8.988 103.424284 7 0.628 9.1971831 300.1 9.003 102.156871 8 0.641 9.3802817 300.4 9.012 104.08657 9 0.637 9.3239437 303.7 9.111 102.337215 10 0.636 9.3098592 299.8 8.994 103.5118874
Rata-rata ± SD = 102.90 ± 0.83
KV = 0.807249218
Repl
ikasi Absorbansi C sampel
W sampel
(mg) C teoritis Kadar (%) 1 0.628 9.1971831 303.5 9.105 101.0124448 2 0.637 9.3239437 305.1 9.153 101.8676244 3 0.625 9.1549296 300.4 9.012 101.5859918 4 0.638 9.3380282 302.7 9.081 102.830395 5 0.626 9.1690141 300.5 9.015 101.7084202 6 0.634 9.2816901 306.9 9.207 100.8112321 7 0.638 9.3380282 304.2 9.126 102.3233418 8 0.629 9.2112676 300.8 9.024 102.0752173 9 0.642 9.3943662 301.3 9.039 103.9314769 10 0.623 9.1267606 300.7 9.021 101.1723818 Rata-rata ± SD = 101.93 ± 0.93
Hasil Uji Keseragaman Kandungan Tablet Formula A replikasi III
Replikasi Absorbansi C sampel
W Sampel
(mg) C teoritis
Kadar (%) 1 0.632 9.2535211 306.2 9,186 100.7350438 2 0.637 9.3239437 301.5 9,045 103.0839543 3 0.626 9.1690141 304.7 9,141 100.3064663 4 0.642 9.3943662 305.9 9,171 102.3685976 5 0.635 9.2957746 302.6 9,078 102.3989276 6 0.628 9.1971831 307.1 9,213 99.82831975 7 0.634 9.2816901 302.8 9,084 102.1762455 8 0.624 9.1408451 301.3 9,039 101.1267294 9 0.632 9.2535211 306.4 9,192 100.6692899 10 0.639 9.3521127 307.2 9,216 101.4769171
Rata-rata ± SD = 101.42±1.06
KV = 1.044242059
Hasil Uji Keseragaman Kandungan Tablet Formula B replikasi I
Replikasi Absorbansi C sampel
W Sampel
(mg) C teoritis
Kadar (%) 1 0.636 9.3098592 303.5 9.105 102.2499633 2 0.633 9.2676056 306.2 9.186 100.8883696 3 0.625 9.1549296 307.1 9.213 99.36969041 4 0.631 9.2394366 306.4 9.192 100.5160642 5 0.627 9.1830986 305.9 9.177 100.0664552 6 0.639 9.3521127 300.8 9.024 103.6360004 7 0.624 9.1408451 301.4 9.042 101.0931771 8 0.638 9.3380282 307.3 9.219 101.291118 9 0.624 9.1408451 306.9 9.207 99.28147139 10 0.642 9.3943662 301.5 9.045 103.862534
Rata-rata ± SD = 101.26 ± 1.60
Hasil Uji Keseragaman Kandungan Tablet Formula B replikasi II
Hasil Uji Keseragaman Kandungan Tablet Formula B replikasi III
Replikasi Absorbansi C sampel W Sampel
(mg) C teoritis
Kadar (%) 1 0.632 9.2535211 303.5 9.105 101.631204 2 0.638 9.3380282 305.1 9.153 102.021503 3 0.626 9.1690141 302.8 9.084 100.9358662 4 0.622 9.1126761 300.7 9.021 101.0162516 5 0.635 9.2957746 304.2 9.126 101.8603402 6 0.621 9.0985915 300.6 9.018 100.8936743 7 0.637 9.3239437 300.2 9.006 103.5303538 8 0.628 9.1971831 301.7 9.051 101.6151044 9 0.639 9.3521127 306.4 9.192 101.7418698 10 0.624 9.1408451 302.5 9.075 100.7255655
Rata-rata ± SD = 101.60 ± 0.82
KV = 0.806223272
Repli
kasi Absorbansi C sampel
W Sampel
(mg) C teoritis
Kadar (%) 1 0.634 9.2816901 300.3 9.009 103.0268636 2 0.626 9.1690141 300.7 9.021 101.6407725 3 0.633 9.2676056 306.2 9.186 100.8883696 4 0.628 9.1971831 301.5 9.045 101.6825108 5 0.635 9.2957746 302.9 9.087 102.2975091 6 0.623 9.1267606 308.1 9.243 98.74240575 7 0.641 9.3802817 300.4 9.012 104.08657 8 0.625 9.1549296 304.5 9.135 100.2181672 9 0.639 9.3521127 306.7 9.201 101.6423506 10 0.627 9.1830986 302.8 9.084 101.0909136 Rata-rata ± SD= 101.53 ± 1.47
Hasil Uji Keseragaman Kandungan Tablet Formula C replikasi I
Replikasi Absorbansi C sampel
W Sampel
(mg) C teoritis
Kadar (%) 1 0.623 9.1267606 303.5 9.105 100.2389958 2 0.627 9.1830986 306.7 9.201 99.80544062 3 0.635 9.2957746 303.9 9.117 101.9608934 4 0.639 9.3521127 300.3 9.009 103.8085545 5 0.624 9.1408451 301.8 9.054 100.9591901 6 0.642 9.3943662 308.2 9.246 101.6046528 7 0.631 9.2394366 304.1 9.123 101.2762975 8 0.628 9.1971831 307.4 9.222 99.73089458 9 0.633 9.2676056 305.7 9.171 101.0533817 10 0.625 9.1549296 301.6 9.048 101.1818035
Rata-rata ± SD = 101.16 ± 1.19
KV = 1.171714406
Hasil Uji Keseragaman Kandungan Tablet Formula C replikasi II
Repli
kasi Absorbansi C sampel
W Sampel
(mg) C teoritis Kadar (%) 1 0.631 9.2394366 303.5 9.105 101.4765142 2 0.637 9.3239437 305.3 9.159 101.8008916 3 0.632 9.2535211 300.7 9.021 102.5775538 4 0.638 9.3380282 301.8 9.054 103.1370463 5 0.624 9.1408451 304.4 9.132 100.096858 6 0.629 9.2112676 305.6 9.168 100.4719416 7 0.622 9.1126761 303.1 9.093 100.2163869 8 0.634 9.2816901 307.7 9.231 100.5491295 9 0.625 9.1549296 308.5 9.255 98.91874206 10 0.628 9.1971831 307.4 9.222 99.73089458
Rata-rata ± SD = 100.90 ± 1.32
Hasil Uji Keseragaman Kandungan Tablet Formula C replikasi III
Hasil Uji Keseragaman Kandungan Tablet Formula D replikasi I Repli
kasi Absorbansi C sampel
W Sampel
(mg) C Teoritis Kadar (%) 1 0.632 9.2535211 306.2 9.186 100.7350438 2 0.626 9.1690141 303.8 9.114 100.6036217 3 0.634 9.2816901 307.8 9.234 100.5164624 4 0.621 9.0985915 306.5 9.195 98.95151223 5 0.637 9.3239437 301.6 9.048 103.0497752 6 0.629 9.2112676 308.5 9.255 99.52747278 7 0.619 9.0704225 306.4 9.192 98.67735569 8 0.624 9.1408451 308.2 9.246 98.86269814 9 0.635 9.2957746 305.7 9.171 101.3605348 10 0.641 9.3802817 302.6 9.078 103.3298269
Rata-rata ± SD = 100.56 ± 1.65
KV = 1.644875363
Repli
kasi Absorbansi C sampel
W Sampel
(mg) C Teoritis Kadar (%) 1 0.636 9.3098592 302.5 9.075 102.5879797 2 0.625 9.1549296 305.1 9.153 100.0210814 3 0.637 9.3239437 306.8 9.204 101.3031689 4 0.622 9.1126761 307.2 9.216 98.87886346 5 0.631 9.2394366 308.5 9.255 99.83183814 6 0.629 9.2112676 304.5 9.135 100.8348944 7 0.638 9.3380282 306.4 9.192 101.5886441 8 0.627 9.1830986 301.9 9.057 101.3922777 9 0.642 9.3943662 306.2 9.186 102.2683017 10 0.639 9.3521127 304.3 9.129 102.4439991
Rata-rata ± SD= 101.12 ± 1.23
Hasil Uji Keseragaman Kandungan Tablet Formula D replikasi II
Repli
kasi Absorbansi C sampel
W Sampel
(mg) C Teoritis Kadar (%) 1 0.623 9.1267606 302.5 9.075 100.5703643 2 0.634 9.2816901 305.7 9.171 101.2069582 3 0.627 9.1830986 307.3 9.219 99.61057155 4 0.636 9.3098592 301.8 9.054 102.825924 5 0.628 9.1971831 303.6 9.108 100.9791732 6 0.631 9.2394366 307.4 9.222 100.1890763 7 0.622 9.1126761 308.2 9.246 98.55803652 8 0.635 9.2957746 306.5 9.195 101.0959722 9 0.625 9.1549296 304.9 9.147 100.0866905 10 0.632 9.2535211 305.4 9.162 100.9989208
Rata – rata ± SD = 100.61 ± 1.13
KV = 1.121181019
Hasil Uji Keseragaman Kandungan Tablet Formula D replikasi III
Replikasi Absorbansi C sampel
W Sampel
(mg) C teoritis Kadar (%) 1 0.635 9.2957746 301.5 9.045 102.7725224 2 0.627 9.1830986 305.7 9.171 100.1319223 3 0.631 9.2394366 308.3 9.249 99.89660093 4 0.625 9.1549296 304.5 9.135 100.2181672 5 0.638 9.3380282 306.4 9.192 101.5886441 6 0.623 9.1267606 308.2 9.246 98.71036733 7 0.641 9.3802817 303.1 9.093 103.1593719 8 0.633 9.2676056 302.8 9.084 102.0211981 9 0.621 9.0985915 307.2 9.216 98.72603678 10 0.643 9.4084507 302.3 9.069 103.7429783
Rata-rata ± SD = 101.10 ± 1.8
KV = 1.79445983
LAMPIRAN I
HASIL UJI DISOLUSI TABLET LEPAS LAMBAT KAPTOPRIL
Hasil Uji Disolusi Tablet Lepas Lambat Kaptopril Formula A
Replikasi t
(menit) Absorbansi
C sampel (µg/ml) Wt (mg) AUC (mg.menit) I
30 0.265 4.08 9.18 137.70
60 0.281 4.31 9.70 283.20
90 0.312 4.75 10.69 305.85
120 0.323 4.90 11.03 325.80
180 0.346 5.23 11.77 684.00
240 0.352 5.31 11.95 711.60
300 0.368 5.54 12.47 732.60
360 0.375 5.63 12.67 754.20
= 3934.95
II
30 0.267 4.11 9.25 138.75
60 0.279 4.28 9.63 283.20
90 0.283 4.34 9.77 291.00
120 0.297 4.54 10.22 299.85
180 0.298 4.55 10.24 613.80
240 0.358 5.39 12.13 671.10
300 0.361 5.44 12.24 731.10
360 0.374 5.62 12.65 746.70
= 3775.50
III
30 0.269 4.14 9.32 139.80
60 0.281 4.31 9.70 285.30
90 0.293 4.48 10.08 296.70
120 0.315 4.79 10.78 312.90
180 0.338 5.11 11.50 668.40
240 0.357 5.38 12.11 708.30
300 0.362 5.45 12.26 731.10
360 0.376 5.65 12.71 749.10
= 3891.60
Hasil Uji Disolusi Tablet Lepas Lambat Kaptopril Formula B
Replikasi t
(menit) Absorbansi
C sampel (µg/ml) Wt (mg) AUC (mg.menit) I
30 0.309 4.70 10.58 158.70 60 0.315 4.79 10.78 320.40 90 0.332 5.03 11.32 331.50 120 0.359 5.41 12.17 352.35 180 0.374 5.62 12.66 744.75 240 0.395 5.92 13.32 779.25 300 0.401 6.00 13.50 804.60 360 0.412 6.15 13.84 820.20 = 4311.75
II
30 0.308 4.69 10.55 158.25 60 0.313 4.76 10.71 318.90 90 0.338 5.11 11.50 333.15 120 0.352 5.31 11.95 351.75 180 0.379 5.69 12.80 742.50 240 0.391 5.86 13.19 779.70 300 0.407 6.08 13.68 806.10 360 0.409 6.11 13.75 822.90 = 4313.25
III
30 0.311 4.73 10.64 159.60 60 0.327 4.96 11.16 327.00 90 0.339 5.13 11.55 340.65 120 0.356 5.37 12.08 354.45 180 0.375 5.63 12.67 742.50 240 0.394 5.90 13.28 778.50 300 0.405 6.06 13.64 807.60 360 0.411 6.14 13.82 823.80 = 4334.10
Hasil Uji Disolusi Tablet Lepas Lambat Kaptopril Formula C Replikas i t (menit ) Absorbans i C sampel (µg/ml) Wt (mg) AUC (mg.menit ) I
30 0.411 6.135 13.82 207.30 60 0.423 6.310 14.18 420.00 90 0.439 6.535 14.72 433.50 120 0.451 6.704 15.08 447.00 180 0.462 6.859 15.44 915.60 240 0.485 7.183 16.16 948.00 300 0.504 7.451 16.76 987.60 360 0.512 7.563 17.01 1013.10
= 5372.10
II
30 0.415 6.197 13.95 209.25 60 0.426 6.352 14.29 423.60 90 0.437 6.507 14.65 434.10 120 0.452 6.718 15.12 446.55 180 0.464 6.887 15.50 918.60 240 0.483 7.155 16.11 948.30 300 0.507 7.493 16.85 988.80 360 0.511 7.549 16.99 1015.20
= 5384.40
III
30 0.413 6.169 13.88 208.20 60 0.425 6.338 14.27 422.25 90 0.434 6.465 14.56 432.45 120 0.455 6.761 15.21 446.55 180 0.461 6.845 15.41 918.60 240 0.487 7.211 16.22 948.90 300 0.506 7.479 16.83 991.50 360 0.513 7.577 17.06 1016.70
= 5385.15
Hasil Uji Disolusi Tablet Lepas Lambat Kaptopril Formula D
Keterangan: Abs = absorbansi sampel, C sampel = konsentrasi sampel, Wt = jumlah kaptopril yang terlarut.
Replikasi t
(menit) Absorbansi
C sampel (µg/ml)
Wt (mg)
AUC (mg.menit)
I 30 0.548 8.070 18.16 272.40
60 0.553 8.141 18.32 547.20 90 0.561 8.254 18.56 553.20 120 0.576 8.465 19.06 564.30 180 0.584 8.577 19.31 1151.10 240 0.602 8.831 19.87 1175.40 300 0.623 9.127 20.54 1212.30 360 0.648 9.479 21.33 1256.10
= 6732.00
II 30 0.551 8.113 18.25 273.75
60 0.563 8.282 18.63 553.20 90 0.578 8.493 19.10 565.95 120 0.585 8.592 19.33 576.45 180 0.604 8.859 19.94 1178.10 240 0.616 9.028 20.32 1207.80 300 0.632 9.254 20.81 1233.90 360 0.649 9.493 21.35 1264.80
= 6853.95
III 30 0.546 8.042 18.09 271.35
60 0.559 8.225 18.52 549.15 90 0.563 8.282 18.63 557.25 120 0.575 8.451 19.01 564.60 180 0.581 8.535 19.22 1146.90 240 0.607 8.901 20.03 1177.50 300 0.625 9.155 20.61 1219.20 360 0.647 9.465 21.31 1257.60
LAMPIRAN J
CONTOH PERHITUNGAN
Contoh perhitungan sudut diam: Formula A:
W persegi panjang = 3,83 gram W lingkaran = 0,75 gram Luas persegi panjang = 29,6 x 22,4
= 663,04 cm2
Luas lingkaran =
663
,
04
83
,
3
75
,
0
×
= 129,84 cm2A = π.r2
r2 =
A
=
14
,
3
84
,
129
= 41,35r = 6,43 cm
tg α =
r
t
=43
,
6
27
,
3
= 0,5086α = 26,96°
Contoh perhitungan indeks kompresibilitas:
Formula A :
Berat gelas = 129,58 g (W1)
Bj nyata = 1 1 2
)
(
V
W
W
−
=100
)
58
,
129
13
,
182
(
−
= 0,5255Bj mampat =
2 1 2
)
(
V
W
W
−
=80
)
58
,
129
13
,
182
(
−
= 0,6569% kompresibilitas = x100% mampat . Bj nyata . Bj
1− = 20,003%
Contoh perhitungan akurasi & presisi:
Absorbansi = 0,546 y = 0,0671 – 0,0771 Konsentrasi sebenarnya = 9,420 ppm Konsentrasi teoritis = 9,144 ppm
% perolehan kembali = (konsentrasi sebenarnya / konsentrasi teoritis) x 100%
= (9,420 / 9,144) x 100% = 103,02 %
Untuk menghitung % KV = x100%
X SD
= 100%
101,04 0,415 x % Bahan aktif (mg) Matri ks (mg) +Larutan HCl pH 1,0 ad Pipe t (ml) +Larutan HCl pH 1,0 ad Konsen trasi (ppm) 10 0
Contoh perhitungan Wt:
Wt = Csesungguhnya x 5
Formula A replikasi 1 pada t = 30 menit Wt = 3,34 x 5 = 16,70 mg
Contoh perhitungan % obat terlepas:
% obat terlepas = ×100% PK
Wt
Formula A replikasi 1 pada t = 30 menit
% obat terlepas = 100% 32,78% 95 , 50 mg 16,70 = × mg
Contoh perhitungan AUC pada disolusi:
Rumus: Wtn + W tn-1 x tn – tn-1 2
Formula A batch 1 Wtn-1 = 16,70 Wtn = 16,92 tn = 60 menit tn-1 = 30 menit
AUC =
(
60
30
)
2
70
,
16
92
,
16
−
+
x
= 504,32Perhitungan persamaan orde nol:
Rumus: Ct = C0 - k . t
Dari persamaan regresi Ct versus t (waktu), maka didapatkan suatu persamaan regresi dan nilai r, slope serta intersept. Nilai kdiss adalah slope.
Perhitungan persamaan orde satu:
Rumus: ln (
X
-Ct) = ln C0 - k . tDari persamaan regresi ln (
X
-Ct) versus t (waktu), maka didapatkan suatu persamaan regresi dan nilai r, slope serta intersept. Nilai kdiss adalah –slope.X
adalah rata-rata penetapan kadar.Perhitungan persamaan Higuchi:
Rumus: Ct = C0 + k . t1/2
Dari persamaan regresi Ct versus
t
(waktu), maka didapatkan suatuLAMPIRAN K
SERTIFIKAT ANALISIS BAHAN
PVP K-30
LAMPIRAN L
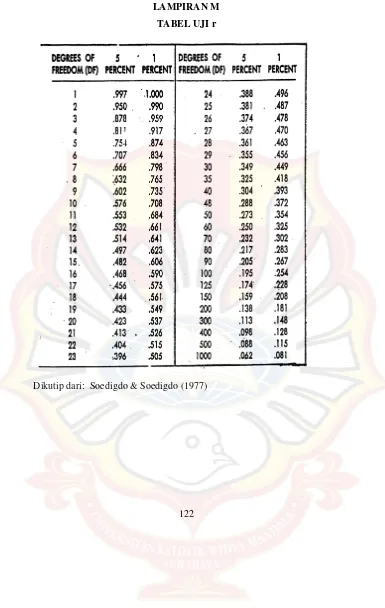
LAMPIRAN M
TABEL UJI r
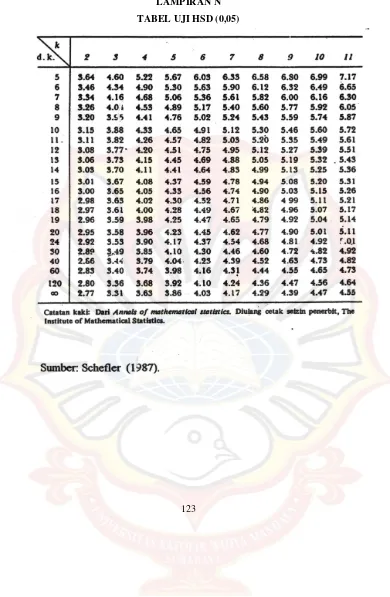
LAMPIRANN
LAMPIRAN O
HASIL UJI STATISTIK KEKERASAN TABLET ANTAR
FORMULA
Anova: Single Factor
SUMMARY
Groups Count Sum Average Variance
Column 1 3 46.469 15.48967 0.001001 Column 2 3 35.813 11.93767 0.022805 Column 3 3 50.641 16.88033 0.05588 Column 4 3 42.026 14.00867 0.00626 ANOVA
Source of
Variation SS df MS F P-value F crit
Between Groups 40.28211 3 13.42737 624.9116
8.01E-10 4.066181 Within Groups 0.171895 8 0.021487
Total 40.45401 11
Keterangan: F hitung = 624,9116 > F0,05= 3,59 sehingga H ditolak dan ada perbedaan yang bermagna antar formula.
Hasil Uji HSD Kekerasan Tablet
HSD = 0,296099
Perlakuan Mean FA FB FC FD
11.93767 16.88033 14.00867 0 FA 11.93767 0 4.942667 * 2.071 * -11.9377 *
FB 16.88033 0 -2.87167 * -16.8803
FC 14.00867 0 -14.0087 *
FD 0 0
Keterangan:
Nilai HSD = 0,296099
LAMPIRAN P
HASIL UJI STATISTIK KERAPUHAN TABLET ANTAR
FORMULA
Anova: Single Factor SUMMARY
Groups Count Sum Average Variance
Column 1 3 0.488391877 0.162797292 4.72553E-06 Column 2 3 1.457889315 0.485963105 1.4437E-06 Column 3 3 0.977210768 0.325736923 1.96192E-06 Column 4 3 1.465852609 0.488617536 1.33617E-05
Keterangan: F hitung = 13462,81447 > F0,05 = 3,59 sehingga H ditolak dan ada perbedaan bermagna antar formula.
Hasil Uji HSD Kerapuhan Talet
HSD = 0.004682395
Perlakuan Mean FA FB FC FD
0.162797292 0.485963105 0.325736923 0.488617536
FA 0.162797292 0 0.323165813 * 0.162939631 0.325820244 *
FB 0.485963105 0 -0.160226182 * 0.002654431 TS
FC 0.325736923 0 0.162880613 *
FD 0.488617536 0
Keterangan:
Nilai HSD = 0,004682395
* = Perbedaannya signifikan, karena selisihnya > nilai HSD ANOVA
Source of
Variation SS df MS F P-value F crit
Between
Groups 0.2170154 3 0.072338467 13462.81447
3.7849E-15 4.066180557 Within
Groups 4.29856E-05 8 5.37321E-06
LAMPIRAN Q
HASIL UJI STATISTIK PENETAPAN KADAR TABLET ANTAR
FORMULA
Anova: Single Factor
SUMMARY
Groups Count Sum Average Variance
Column 1 3 306.6486 102.2162 1.130031 Column 2 3 305.3216 101.7739 0.273653 Column 3 3 305.5353 101.8451 0.991361 Column 4 3 305.5956 101.8652 2.605796
ANOVA
Source of
variation ss df MS F P-value F crit
Between Groups 0.352799 3 0.1176 0.094064 0.961197 4.066181 Within Groups 10.00168 8 1.25021
Total 0,35448 11
LAMPIRAN R
UJI F KURVA BAKU PENETAPAN KADAR
REPLIKASI 1
Konsentrasi Absorbansi X2 Y2 XY
3.096 0.375 9.5852 0.1406 1.1610
5.16 0.475 26.6256 0.2256 2.4510
7.224 0.589 52.1862 0.3469 4.2549
9.288 0.679 86.2669 0.4610 6.3066
11.352 0.756 128.8679 0.5715 8.5821 13.416 0.879 179.9891 0.7726 11.7927 15.480 0.904 239.6304 0.8172 13.9939
REPLIKASI 2
Konsentrasi Absorbansi X2 Y2 XY
3.048 0.389 9.2903 0.1513 1.1857
5.080 0.491 25.8064 0.2411 2.4943
7.112 0.597 50.5805 0.3564 4.2459
9.144 0.695 83.6127 0.4830 6.3551
11.176 0.775 124.9030 0.6006 8.6614 13.208 0.894 174.4513 0.7992 11.8080 15.240 0.915 232.2576 0.8372 13.9446
REPLIKASI 3
Konsentrasi Absorbansi X2 Y2 XY
3.072 0.369 9.4372 0.1362 1.1336
5.12 0.482 26.2144 0.2323 2.4678
7.168 0.572 51.3802 0.3272 4.1001
9.216 0.684 84.9347 0.4679 6.3037
11.264 0.763 126.8777 0.5822 8.5944 13.312 0.882 177.2093 0.7779 11.7412 15.360 0.908 235.9296 0.8245 13.9469
S X2 SXY S Y2 N SSi RDF
Regresi I 723.1513 48.5422 3.3356 7 3.2685 6 Regresi II 700.9018 48.6948 3.4689 7 3.3994 6 Regresi III 711.9831 48.2877 3.3481 7 3.2803 6
2136.0362 145.5248 10.1526 9.9482
Ssc = 10,0845
LAMPIRAN S
HASIL UJI STATISTIK DISOLUSI TABLET ANTAR FORMULA
Anova: Single Factor SUMMARY
Groups Count Sum Average Variance
Column 1 8 386.46 48.3075 31.15048 Column 2 8 430.63 53.82875 29.43044
Column 3 8 535.52 66.94 25.60991
Column 4 8 682.63 85.32875 23.12093
ANOVA Source of
Variation SS df MS F P-value F crit
Between
Groups 6501.056 3 2167.019 79.29682 8.49E-14 2.946685 Within Groups 765.1823 28 27.32794
Total 7266.239 31
Keterangan: F hitung = 79,29682 > F 0,05 = 2,92 sehingga H ditolak dan ada perbedaan yang bermagna antar formula
Hasil Uji HSD Disolusi Tablet
Perlakuan Mean FA FB FC FD
48.3075 53.82875 66.94 85.32875
FA 48.3075 0 5.52125 18.6325 37.02125
FB 53.82875 0 13.11125 31.5
FC 66.94 0 18.38875
FD 85.32875 0
Keterangan:
Nilai HSD = 10,55978
LAMPIRAN T
HASIL UJI STATISTIK FLOATING LAG TIME TABLET ANTAR
FORMULA
Anova: Single Factor SUMMARY
Groups Count Sum Average Variance
Column 1 3 5.35 1.783333 0.000933 Column 2 3 2.35 0.783333 0.003733 Column 3 3 1.78 0.593333 0.000633 Column 4 3 1.12 0.373333 0.000633
ANOVA Source of
Variation SS df MS F P-value F crit
Between
Groups 3.4926 3 1.1642 784.8539 3.23E-10 4.066181 Within Groups 0.011867 8 0.001483
Total 3.504467 11
Keterangan: F hitung = 784,8539 > F 0,05 = 3,59 sehingga H ditolak dan ada perbedaan yang bermagna antar formula
Hasil Uji HSD Floating Lag Time Tablet
HSD = 0.077798
Perlakuan Mean FA FB FC FD
1.783333 0.783333 0.593333 0.373333
FA 1.783333 0 -1 * -1.19 * -1.41
FB 0.783333 0 -0.19 * -0.41
FC 0.593333 0 -0.22
FD 0.373333 0
Keterangan:
Nilai HSD = 0,077798
LAMPIRAN U
HASIL UJI ANAVA KEKERASAN TABLET DENGAN
DESIGN-EXPERT
Response 1 Kekerasan
ANOVA for selected factorial model
Analysis of variance table [Partial sum of squares - Type III]
Sum of Mean F
Source Squares df Square Value
Model 50.18 3 16.73 1
A-HPMC K4M-Guar gum 42.79 1 42.79 2
B-Asam Tartrat 6.81 1 6.81
AB0.58 1 0.58 38.21
Pure Error 0.12 8 0.015
Cor Total 50.30 11
The Model F-value of 1100.45 implies the model is significant. There is only
a 0.01% chance that a "Model F-Value" this large could occur due to noise.
Values of "Prob > F" less than 0.0500 indicate model terms are significant.
In this case A, B, AB are significant model terms.
Values greater than 0.1000 indicate the model terms are not significant. If there are many insignificant model terms (not counting those required to support hierarchy),
model reduction may improve your model.
Std. Dev. 0.12 R-Squared 0.9976
Mean12.63 Adj R-Squared 0.9967
C.V. % 0.98 Pred R-Squared 0.9946 PRESS 0.27 Adeq Precision 74.224
The "Pred R-Squared" of 0.9946 is in reasonable agreement with the "Adj R-Squared" of 0.9967.
navigate the design space.
Coefficient Standard 95% CI 95% CI
FactorEstimate df Error Low High
Intercept 12.63 1 0.036 12.55 12.71
A-HPMC K4M-Guar gum -1.89 1 0.036 -1.97- 1.811.00 B-Asam Tartrat -0.75 1 0.036 -0.84- 0.671.00
AB 0.22 1 0.036 0.14 0.30 1.00
Final Equation in Terms of Coded Factors: Kekerasan =
+12.63
-1.89 * A
-0.75 * B
+0.22 * A * B
Final Equation in Terms of Actual Factors:
Kekerasan =
+12.63167
-1.88833 * HPMC K4M-Guar gum
-0.75333 * Asam Tartrat
+0.22000 * HPMC K4M-Guar gum * Asam Tartrat
The Diagnostics Case Statistics Report has been moved to the Diagnostics Node.
In the Diagnostics Node, Select Case Statistics from the View Menu.
Proceed to Diagnostic Plots (the next icon in progression). Be sure to look at the:
1) Normal probability plot of the studentized residuals to check for normality of residuals.
2) Studentized residuals versus predicted values to check for constant error. 3) Externally Studentized Residuals to look for outliers, i.e., influential values.
4) Box-Cox plot for power transformations.
LAMPIRAN V
HASIL UJI ANAVA KERAPUHAN TABLET DENGAN
DESIGN-EXPERT
Response 2 Kerapuhan
ANOVA for selected factorial model
Analysis of variance table [Partial sum of squares - Type III]
Sum of Mean F p-value
Source Squares df Square Value
Model0.22 3 0.072 13484.21 < 0.0001 significant
A-HPMC K4M-Guar gum 0.021 1 0.021 3834.24 < 0.0001
B-Asam Tartrat 0.18 1 0.18
33024.14 < 0.0001
AB 0.019 1 0.019 3594.24 < 0.0001
Pure Error 4.291E-005 8 5.364E-006
Cor Total 0.22 11
The Model F-value of 13484.21 implies the model is significant. There is only
a 0.01% chance that a "Model F-Value" this large could occur due to noise.
Values of "Prob > F" less than 0.0500 indicate model terms are significant. In this case A, B, AB are significant model terms.
Values greater than 0.1000 indicate the model terms are not significant. If there are many insignificant model terms (not counting those required to support hierarchy), model reduction may improve your model.
Std. Dev. 2.316E-003 R-Squared 0.9998
Mean0.37 Adj R-Squared 0.9997
C.V. % 0.63 Pred R-Squared 0.9996 PRESS 9.655E-005 Adeq Precision 243.647
The "Pred R-Squared" of 0.9996 is in reasonable agreement with the "Adj R-Squared" of 0.9997.
Coefficient Standard 95% CI 95% CI
FactorEstimate df Error Low
Intercept 0.37 1 6.686E-004 0.360.37
A-HPMC K4M-Guar gum 0.041 1 6.686E-004 0.0400.0431.00 B-Asam Tartrat 0.12 1 6.686E-004 0.120.121.00
AB-0.040 16.686E-004 -0.042 -0.0391.00
Final Equation in Terms of Coded Factors:
Kerapuhan =
+0.37
+0.041 * A
+0.12 * B
-0.040 * A * B
Final Equation in Terms of Actual Factors:
Kerapuhan =
+0.36578
+0.041400 * HPMC K4M-Guar gum
+0.12150 * Asam Tartrat
-0.040083 * HPMC K4M-Guar gum * Asam Tartrat
The Diagnostics Case Statistics Report has been moved to the Diagnostics Node.
In the Diagnostics Node, Select Case Statistics from the View Menu. Proceed to Diagnostic Plots (the next icon in progression). Be sure to look at the:
1) Normal probability plot of the studentized residuals to check for normality of residuals.
2) Studentized residuals versus predicted values to check for constant error. 3) Externally Studentized Residuals to look for outliers, i.e., influential values.
4) Box-Cox plot for power transformations.
LAMPIRAN W
HASIL UJI ANAVA K DISOLUSI TABLET DENGAN
DESIGN-EXPERT
Response 3 k disolusi
ANOVA for selected factorial model
Analysis of variance table [Partial sum of squares - Type III]
Sum of Mean F p-value
Source Squares df Square Value
Prob > F
Model5.871E-004 3 1.957E-00417.740.0007 significant
A-HPMC K4M-Guar gum 4.600E-004 14.600E-00441.710.0002 B-Asam Tartrat 1.015E-004 11.015E-0049.200.0162
AB2.552E-005 12.552E-005 2.310.1667
Pure Error 8.823E-005 8 1.103E-005Cor
Total6.753E-004 11
The Model F-value of 17.74 implies the model is significant. There is only a 0.07% chance that a "Model F-Value" this large could occur due to noise. Values of "Prob > F" less than 0.0500 indicate model terms are significant. In this case A, B are significant model terms.
Values greater than 0.1000 indicate the model terms are not significant. If there are many insignificant model terms (not counting those required to support hierarchy), model reduction may improve your model.
Std. Dev. 3.321E-003 R-Squared 0.8693 Mean 0.040 Adj R-Squared 0.8204 C.V. % 8.36 Pred R-Squared 0.7060 PRESS 1.985E-004 Adeq Precision 9.492
The "Pred R-Squared" of 0.7060 is in reasonable agreement with the "Adj R-Squared" of 0.8204.
"Adeq Precision" measures the signal to noise ratio. A ratio greater than 4 is desirable. Your
Coefficient Standard 95% CI 95% CI
FactorEstimate df Error Low High VIF
Intercept 0.040 1 9.587E-0040.0370.042 A-HPMC K4M-Guar gum6.192E-003 19.587E-0043.981E-0038.402E-003 1.00
B-Asam Tartrat 2.908E-003 1 9.587E-0046.977E-004 5.119E-003 1.00
AB1.458E-003 1 9.587E-004-7.523E-0043.669E-0031.00
Final Equation in Terms of Coded Factors:
k disolusi =
+0.040
+6.192E-003 * A
+2.908E-003 * B
+1.458E-003 * A * B
Final Equation in Terms of Actual Factors:
k disolusi =
+0.039708
+6.19167E-003 * HPMC K4M-Guar gum +2.90833E-003 * Asam Tartrat
+1.45833E-003 * HPMC K4M-Guar gum * Asam Tartrat
The Diagnostics Case Statistics Report has been moved to the Diagnostics Node.In the Diagnostics Node, Select Case Statistics from the View Menu. Proceed to Diagnostic Plots (the next icon in progression). Be sure to look at the:
1) Normal probability plot of the studentized residuals to check for normality of residuals.
2) Studentized residuals versus predicted values to check for constant error. 3) Externally Studentized Residuals to look for outliers, i.e., influential values.
4) Box-Cox plot for power transformations.
LAMPIRAN X
HASIL UJI ANAVA FLOATING LAG TIME TABLET DENGAN
DESIGN-EXPERT
Response 4 Floating lag time
ANOVA for selected factorial model
Analysis of variance table [Partial sum of squares - Type III]
Sum of Mean F p-value
Source Squares df Square Value
Model3.49 3 1.16 784.85< 0.0001 significant
A-HPMC K4M-Guar gum 1.92 1 1.92 1294.38 < 0.0001
B-Asam Tartrat 1.12 1 1.12 752.56 < 0.0001 AB 0.46 1 0.46 307.62< 0.0001
Pure Error 0.012 8 1.483E-003 Cor Total 3.50 11
The Model F-value of 784.85 implies the model is significant. There is only a 0.01% chance that a "Model F-Value" this large could occur due to noise.
Values of "Prob > F" less than 0.0500 indicate model terms are significant. In this case A, B, AB are significant model terms.
Values greater than 0.1000 indicate the model terms are not significant. If there are many insignificant model terms (not counting those required to support hierarchy), model reduction may improve your model.
Std. Dev. 0.039 R-Squared 0.9966
Mean0.88 Adj R-Squared 0.9953
C.V. %4.36 Pred R-Squared 0.9924
PRESS0.027 Adeq Precision 63.410
The "Pred R-Squared" of 0.9924 is in reasonable agreement with the "Adj R-Squared" of 0.9953.
Coefficient Standard 95% CI 95% CI
FactorEstimate df Error Low High VIF Intercept 0.88 1 0.011 0.86 0.91 A-HPMC K4M-Guar gum -0.40 1 0.011 -0.43 -0.37 1.00 B-Asam Tartrat -0.31 1 0.011 -0.33 -0.28 1.00
AB 0.20 1 0.011 0.17 0.22 1.00
Final Equation in Terms of Coded Factors: Floating lag time =
+0.88
-0.40 * A -0.31 * B +0.20 * A * B
Final Equation in Terms of Actual Factors: Floating lag time = +0.88333
-0.40000 * HPMC K4M-Guar gum
-0.30500 * Asam Tartrat
+0.19500 * HPMC K4M-Guar gum * Asam Tartrat
The Diagnostics Case Statistics Report has been moved to the Diagnostics Node. In the Diagnostics Node, Select Case Statistics from the View Menu.
Proceed to Diagnostic Plots (the next icon in progression). Be sure to look at the:
1) Normal probability plot of the studentized residuals to check for normality of residuals.
2) Studentized residuals versus predicted values to check for constant error. 3) Externally Studentized Residuals to look for outliers, i.e., influential values.
4) Box-Cox plot for power transformations.