T H E J O U R N A L O F H U M A N R E S O U R C E S • 47 • 3
Kasey S. Buckles
Elizabeth L. Munnich
A B S T R A C T
Using the NLSY79 and NLSY79 Child and Young Adult Surveys, we inves-tigate the effect of the age difference between siblings (spacing) on educa-tional achievement. Because spacing may be endogenous, we use an in-strumental variables strategy that exploits variation in spacing driven by miscarriages. The IV results indicate that a one-year increase in spacing increases test scores for older siblings by about 0.17 standard deviations. These results are larger than the OLS estimates, suggesting that failing to account for the endogeneity of spacing may understate its benefits. For younger siblings, we find no causal impact of spacing on test scores.
I. Introduction
A large body of work in economics and other disciplines has found a relationship between family structure and children’s outcomes. For example, chil-dren from larger families generally have lower educational attainment, lower IQ scores, worse employment outcomes, and are more likely to engage in risky behavior (Kessler 1991; Hanushek 1992; Steelman et al. 2002; Deschenes 2007; Black, Dev-ereux, and Salvanes 2010). A recent literature in economics has considered the effects of birth order and found that later-born children have lower educational attainment, receive less parental time investment, and in some cases have worse labor market outcomes (Black, Devereux, and Salvanes 2005; Price 2008). There is even evidence that the gender composition of one’s siblings affects educational at-tainment, though results are mixed (Butcher and Case 1994; Kaestner 1997; Hauser and Kuo 1998; Dahl and Moretti 2008).
However, the age difference between siblings (spacing) has received much less attention in the economic literature—despite the fact that child spacing “may well
Kasey Buckles is an assistant professor of economics at the University of Notre Dame. Elizabeth Mun-nich is a Ph.D. student in economics at the University of Notre Dame. The authors thank Dan Hunger-man, Joseph Price, Seth Sanders, Jacob Vigdor, and seminar participants at the University of Notre Dame, Mount Holyoke, UT-Austin, UT-Arlington, and Duke University for helpful comments. The data used in this article can be obtained beginning January 2013 through December 2016 from Kasey Buck-les, 436 Flanner Hall, Notre Dame, IN 46556; kbuckles@nd.edu.
[Submitted August 2011; accepted November 2011]
be the most important aspect of fertility differentials in low-fertility societies” (Wi-neberg and McCarthy 1989). The research that exists in other fields has focused primarily on the effect of small gaps (shorter than two years), and on very early outcomes such as birth weight and infant mortality. In this paper, we investigate the effects of birth spacing on one important later-life outcome: academic achievement as measured by performance on the Peabody Individual Achievement Tests for math and reading. Our focus on later outcomes is especially valuable given that many of the possible effects of spacing (described more in Section II) would occur after birth, meaning that studies focusing on perinatal outcomes could find effects that differ from long-run effects.
Evidence of the effect of spacing on later outcomes would add to our understand-ing of the effects of family structure. In fact, some of the hypothesized mechanisms for birth order effects, such as differential parental investments, could be mitigated by spacing (Zajonc 1976). Furthermore, unlike birth order, spacing is a matter over which parents might have some control. Empirical evidence of a causal effect of gap size on children’s outcomes would be helpful for parents making decisions about the timing of their fertility.1
Additionally, policy makers in both developed and developing countries have advocated greater spacing between births as a means of improving maternal and infant health. For example, the Contra Costa County Health Services Department in California conducted a public health campaign in 2007, which encouraged greater spacing with the slogan “Just Us for Two Years” (Contra County Health Services 2007). Similarly, the United States Agency for International Development (USAID) has issued a policy brief stating that greater spacing is one of the best ways for women to achieve healthy pregnancies and safe births, citing evidence that “three to five saves lives” (USAID 2006). Programs informing women about the benefits of greater spacing have been implemented in countries including Nigeria, Zimbabwe, and Bangladesh (Olukoya 1986; Guilkey and Jayne 1997; Jamison et al. 2006). However, these policies may have unintended consequences (either positive or neg-ative) if spacing affects outcomes beyond maternal and infant health.2
We begin by using OLS to estimate the relationship between spacing and academic achievement, using the sample of women with multiple children in the 1979 National Longitudinal Survey of Youth (NLSY79). We observe the spacing between each sibling pair, and match the data to detailed information about the siblings from the NLSY79 Children and Young Adults survey. We perform the analysis separately for the older and younger sibling in each pair. The OLS results indicate that longer gaps are associated with slightly better test scores for older children, while for younger children there is little relationship.
However, as Rosenzweig (1986) observes, estimation techniques that fail to ac-count for within- and across-family heterogeneity in unobservable characteristics could produce biased estimates of the effects of birth spacing. Therefore, we also use an instrumental variables strategy to identify the causal effect of spacing on sibling outcomes. The identification strategy exploits variation in spacing driven by miscarriages that occur between two live births; there are several caveats to consider when using this instrument, which will be discussed in detail in Section V. We show that a miscarriage between siblings is associated with an increase in spacing of about eight months, and decreases the likelihood that the siblings are less than two years apart by 19 percentage points.
The results using miscarriages as an instrument indicate that an increase in spacing of one year increases reading scores for the older sibling by 0.17 standard deviations (SD). This effect is comparable to estimates of the effect of birth order on IQ scores and larger than estimates of the effect of decreasing family size by one.3 Spacing
of shorter than two years decreases reading scores by 0.65 SD; estimates for math scores are similar. The two-stage least-squares (2SLS) results are much larger than those obtained by OLS, suggesting that estimates that fail to account for the endo-geneity of spacing may understate its benefits. We find no evidence of an effect of spacing on test scores for younger siblings.
II. Birth Spacing: Background
A. Previous Research
Social scientists have long been interested in the effects of birth spacing. Much of the research in sociology is built on the confluence model presented by Zajonc and Markus (1975), in which family size and birth order influence the intellectual en-vironment of a household. Zajonc (1976) argues that the effects of birth order “are mediated entirely by the age spacing between siblings” and that greater spacing between siblings can reverse the negative effects of birth order. The argument is that children born into families with older children are born into more favorable intel-lectual environments. In this model, larger gaps may also positively affect first-born children, who have more time to develop before the birth of an “intellectually im-mature” younger sibling. Empirical evidence is provided by Broman et al. (1975), who find that children born after longer intervals scored higher on the Stanford-Binet intelligence scale than those born after shorter intervals. However, Galbraith (1982) finds that sibling spacing was not related to intellectual development in a sample of college students.
Among economists, Rosenzweig (1986) develops a model of optimal child spacing in which spacing is an input into child quality. An important feature of the model is that the endowments of older children affect the optimal timing of subsequent births. Empirically, he finds that having a healthier firstborn child significantly
creases the likelihood of a closely spaced second child. This finding is confirmed in Rosenzweig and Wolpin (1988), who also estimate the effects of spacing using a procedure that uses lagged characteristics of parents and children as instruments. They show that greater spacing increases birth weight for younger siblings, and the effects are larger than those estimated with seemingly unrelated regression or fixed effects techniques.4
Our paper builds on Rosenzweig and Wolpin in four ways. First, one might be concerned that lagged parental characteristics may be related to unobservable factors (such as parental tastes and abilities) that persist over time, which could affect the validity of their identification strategy. Here, we pursue a different identification strategy. Second, Rosenzweig and Wolpin’s study is based on a sample of 109 house-holds from a village in Colombia; we have approximately 5,000 sibling pairs from a representative sample of the United States. Third, we focus on later outcomes, which may be valuable as many potential channels for a spacing effect would be realized after infancy. And finally, our strategy allows us to estimate the effect of spacing on older siblings, who are not considered by Rosenzweig and Wolpin.
B. Potential Mechanisms
Birth spacing could affect child outcomes, including educational achievement, through a number of channels. We now discuss several of these mechanisms, which we have organized into four broad categories.
1. Physiological Effects
There is substantial evidence in the medical literature linking both short (typically less than 18 months) and long (more than five years) interpregnancy intervals to adverse infant health outcomes.5These include infant mortality, stillbirth, preterm
delivery, and low birth weight. Smits and Essed (2001) and van Eijsden et al. (2008) suggest nutritional depletion—in particular folate—as a mechanism through which short spacing might affect birth outcomes. On the other hand, the “physiological regression hypothesis” proposes that after long intervals, women’s reproductive ca-pabilities regress (Zhu et al. 1999). There is also recent evidence linking spacing to conditions beyond the perinatal period. In a study of sibling pairs in California, Cheslack et al. (2011) estimate that second-born children conceived within 12 months of a previous birth have three times the odds of being diagnosed with autism than those conceived more than 36 months after a previous birth.6If spacing affects
infant health or child development, this could produce a link between spacing and other outcomes like test scores.
4. In other work in economics, Bhalotra and van Soest (2008) and DaVanzo et al. (2008) consider the effects of birth intervals on infant mortality in India and Bangladesh, respectively. Blalotra and van Soest estimate a structural model while DaVanzo et al. estimate a hazard model with controls for family char-acteristics. Both studies suggest that greater spacing reduces infant mortality.
2. Parental Investments
Spacing may also affect parents’ investments in their children. Price finds that par-ents spend significantly more time with first-born than second-born children, and this translates into less time spent reading to the younger child and lower reading test scores (Price 2008, 2010). Importantly, he shows that the birth order premium in both parental time and in test scores is larger when spacing is greater.7There is
also evidence that financial constraints reduce parents’ economic investments in older children when children are closely spaced, and that this results in lower high school completion and college attendance (Powell and Steelman 1993, 1995). Fi-nally, spacing could affect the likelihood that a mother breastfeeds either the older or younger sibling.
3. Complementarities/Economies of Scale
The confluence model of Zajonc (1976) highlights ways in which children of dif-ferent ages might be complements in the production of child quality. For example, he observes that older children may benefit from teaching younger children, the effect of which may increase with spacing. Spacing may in turn affect a younger child’s receptiveness to an older sibling—Cicirelli (1973) finds that younger siblings were more likely to accept direction from a sibling who is four years older than one who is two years older. Having children closer together could also decrease the per child cost of certain inputs, both in terms of physical resources (for example, sharing clothes and toys) and time-intensive activities (for example, reading to children) so that children benefit from tighter spacing. Jones (2011) uses immunization rates for children in Senegal to show that consumption of “club goods” for children is greater when the children in the house are close in age. Alternatively, sharing resources with a much younger, less mature child may impede intellectual development of an older sibling or lead to sibling rivalries, in which case outcomes for an older sibling would be negatively correlated with spacing (Zajonc 1976).8
4. Effects on Parents
Heckman and Walker (1990) consider the effects of female labor market outcomes on fertility timing and birth spacing and found that higher female wages led to delayed childbearing and greater spacing between children. Troske and Voicu (2009) show that women who delay the birth of a second child reduce their labor force participation by less than women with closely spaced children, but are more likely to work part-time. If spacing affects women’s labor force participation or earnings, these could in turn affect children’s educational achievement by altering the time
7. Price estimates that first-born children receive about 3,000 more hours of parental time on average than second-born children between the ages of 4 and 13 (2008), and the gap increases by about 25 percent with each year of spacing (2010).
and financial resources of the household. The spacing of children might also affect parents’ relationships with their children or with one another (Christensen 1968).
Note that some of the above channels would suggest a positive effect of spacing on test scores, while others suggest the opposite. Whether the effect is positive or negative on net is an empirical question, and the focus of this paper. Also, for some mechanisms (such as physiological effects in the prenatal period) the expected effect is different for the older and younger child in the pair. For this reason, we estimate results separately for each sibling. We briefly explore the relative importance of these channels in the discussion section below.
III. Data
The data for this study come from the National Longitudinal Survey of Youth, 1979 (NLSY79). The NLSY79 is a nationally representative panel survey of 12,686 respondents, who were aged 14 to 22 in 1979. For women in the sample, detailed fertility histories are available that include how many pregnancies each woman has had, the outcome of each pregnancy, and its timing. For our study, we use women with at least two live births, since we are interested in the spacing between them. Each observation is a sibling pair, where the pair consists of siblings adjacent in birth order.
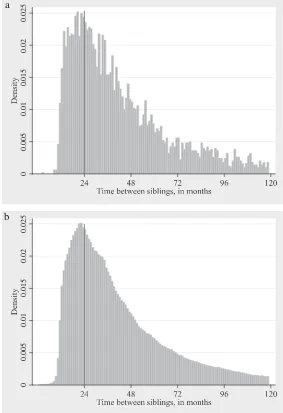
For each sibling pair, we observe the gap in days between their births. We limit the sample to gaps among the first five live births and to gaps smaller than ten years, and to births before 2001 (since our child outcome measure is typically observed between the ages of five and seven). This gives us 5,010 observations from 3,070 mothers.9 Figure 1a shows the distribution of the gap for our sample, in integer
months. The mean gap is 40.78 and the median is 34. As a check on the reliability of the data in the NLSY79, we compare the data to information on sibling spacing obtained from the 1988 Natality Detail Files. This data set contains birth certificate information for virtually all children born in the United States in 1988, which is the mean year for our younger sibling sample in the NLSY79. We use information on the number of months since the mother’s last live birth, for the 1,737,479 children with birth order 2-5 in the data and with fewer than 10 years since the previous birth. The distribution generated by the Natality data is shown in Figure 1b, and the two data sets generate remarkably similar results. In the Natality data, the mean gap is 40.76 and the median is also 34. The null hypothesis that the means for the two samples are the same cannot be rejected (p= 0.47).
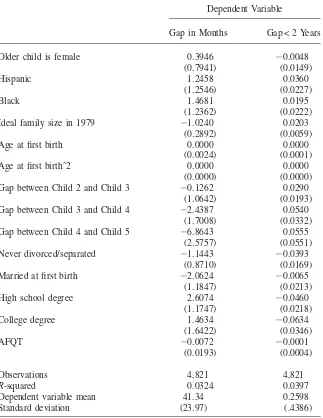
In Table 1, we investigate the correlates of spacing for our sample. For Column 1, we regress the time between siblings in months on characteristics of the older child and of the mother. In Column 2, the dependent variable is a dummy equal to one if the siblings are less than two years apart. Not surprisingly, women who desire larger families have closer spacing. Women who are married at first birth have slightly smaller gaps in months, and women who have never been divorced are less likely to have gaps shorter than two years. Spacing decreases slightly with parity
a
b
0.005
0
0.01
0.015
0.02
0.025
0
0.005
0.01
0.015
0.02
0.025
Figure 1
a. Distribution of Gap for NLSY79 Sample. b. Distribution of Gap for Comparable 1988 Natality Detail File Sample
Table 1
OLS Regressions of Spacing on Characteristics of Mother and Older Child
Dependent Variable
Gap in Months Gap < 2 Years
Older child is female 0.3946 −0.0048
(0.7941) (0.0149)
Hispanic 1.2458 0.0360
(1.2546) (0.0227)
Black 1.4681 0.0195
(1.2362) (0.0222)
Ideal family size in 1979 −1.0240 0.0203
(0.2892) (0.0059)
Age at first birth 0.0000 0.0000
(0.0024) (0.0001)
Age at first birthˆ2 0.0000 0.0000
(0.0000) (0.0000)
Gap between Child 2 and Child 3 −0.1262 0.0290
(1.0642) (0.0193)
Gap between Child 3 and Child 4 −2.4387 0.0540
(1.7008) (0.0332)
Gap between Child 4 and Child 5 −6.8643 0.0555
(2.5757) (0.0551)
Never divorced/separated −1.1443 −0.0393
(0.8710) (0.0169)
Married at first birth −2.0624 −0.0065
(1.1847) (0.0213)
High school degree 2.6074 −0.0460
(1.1747) (0.0218)
College degree 1.4634 −0.0634
(1.6422) (0.0346)
AFQT −0.0072 −0.0001
(0.0193) (0.0004)
Observations 4,821 4,821
R-squared 0.0324 0.0397
Dependent variable mean 41.34 0.2598
Standard deviation (23.97) (.4386)
and increases with education (though nonmonotonically). Child gender, race, age at first birth, and AFQT score are not statistically significant regressors.
After constructing the sibling pairs from the NLSY79, we link these observations to information on the siblings obtained from the NLSY79 Child and Young Adult Survey. This data set contains information on the children born to the women of the NLSY79, and allows us to observe outcomes such as test scores for the siblings in each pair. Children are matched to their mothers’ fertility histories by unique mother identifiers. We will consider the effects of spacing for the older and younger child in the sibling pair separately.
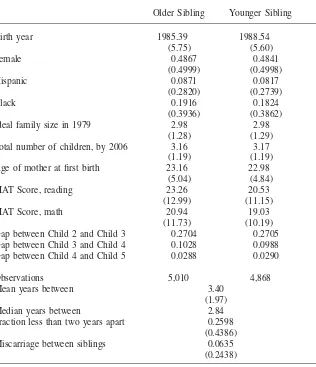
Table 2 presents summary statistics for the siblings and sibling pairs.10About 60
percent of our observations are for gaps between child one and two; 27 percent are for gap 2-3; 10 percent are for gap 3-4; and 3 percent are for gap 4-5. Test scores are from the Peabody Individual Achievement Test (PIAT), which measures aca-demic achievement of children ages five to 18. We use the math and reading rec-ognition tests, which consist of 100 multiple choice questions.11Raw PIAT scores
ranged from 1 to 84 in our data. Test scores are about 0.2 standard deviations better on average for older siblings, consistent with previous research on birth order (Black, Devereux, and Salvanes 2007). For all remaining results, test scores will be adjusted for the age at which the child took the test and standardized to have mean zero and standard deviation of one.12
The NLSY79 fertility histories also allow us to observe whether any pregnancy occurred between siblings that resulted in an outcome other than a live birth. The histories indicate the timing of the pregnancy, and whether the pregnancy ended in a live birth, miscarriage, stillbirth, or abortion.13 Out of our 5,010 sibling pairs, a
miscarriage or stillbirth occurred between the siblings in 291 cases. The miscarriage data will be useful for our identification strategy, which we summarize in more detail in Section V below.
10. The number of observations is different for the two samples because test scores and other information are sometimes missing for the younger child. As long as the gap size can be observed we include these observations in the results for the older child. These differences in sample size contribute to small dis-crepancies in pair characteristics for the older and younger samples. The use of child-specific controls and weights also contributes to these differences.
11. We also produced results using the PIAT reading comprehension scores; results were very similar to results for reading recognition and so we omit them for brevity.
12. Nearly 80 percent of the children in our sample took the PIAT for the first time between ages 5 and 7. To age-adjust the scores, we captured the residuals from a regression of scores on the age at which the child first took the exam. We then standardized the residuals.
Table 2
Summary Statistics for Children in Sample
Older Sibling Younger Sibling
Birth year 1985.39 1988.54
(5.75) (5.60)
Female 0.4867 0.4841
(0.4999) (0.4998)
Hispanic 0.0871 0.0817
(0.2820) (0.2739)
Black 0.1916 0.1824
(0.3936) (0.3862)
Ideal family size in 1979 2.98 2.98
(1.28) (1.29)
Total number of children, by 2006 3.16 3.17
(1.19) (1.19)
Age of mother at first birth 23.16 22.98
(5.04) (4.84)
PIAT Score, reading 23.26 20.53
(12.99) (11.15)
PIAT Score, math 20.94 19.03
(11.73) (10.19)
Gap between Child 2 and Child 3 0.2704 0.2705 Gap between Child 3 and Child 4 0.1028 0.0988 Gap between Child 4 and Child 5 0.0288 0.0290
Observations 5,010 4,868
Mean years between 3.40
(1.97)
Median years between 2.84
Fraction less than two years apart 0.2598 (0.4386)
Miscarriage between siblings 0.0635
(0.2438)
Data are from the NLSY79 and the NLSY79 Child and Young Adult Survey. Each observation is a sibling pair. Standard deviations are in parentheses. Child weights are used, and the sample is restricted to intervals smaller than ten years.
IV. Estimation: OLS
We begin by estimating the effects of birth spacing on sibling out-comes using OLS. The model to be estimated is:
Score =β +gapβ +Xβ +Zβ +u
where the subscript i indexes a sibling pair and s indicates whether the variable describes the older or younger sibling of the pair. In all regressions, the effect of the gap is estimated separately for older and younger siblings. The dependent vari-able is the standardized, age-adjusted PIAT score in math or reading recognition. The variablegapiis either (a) the spacing between the births of the two siblings, in
years;14(b) the log of spacing, in years; or (c) a dummy variable indicating that the
spacing was shorter than two years.15We also consider specifications with a
qua-dratic in spacing. The vectorXsis a set of characteristics specific to childsof the
pair, including gender, race, birth order, and a set of year- and month-of-birth dum-mies. Zi is a vector of characteristics common to both children in the pair, and
includes the mother’s age at first birth, ideal number of children in 1979, and marital history, highest degree obtained, and adjusted AFQT score; uisis error. Estimates
are weighted by NLSY child sampling weights. Because a mother with more than two children will have more than one sibling pair in the data set, standard errors are clustered by mother.
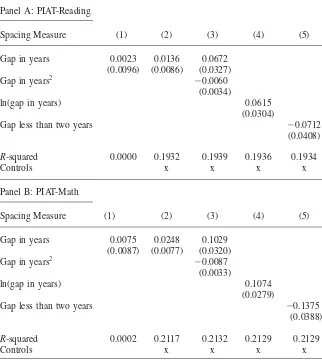
OLS results for older siblings are presented in Table 3, with results for reading in Panel A and for math in Panel B. In the first column, the coefficient is from a simple regression of test score on the gap in years. The correlation is positive but small and statistically insignificant for both reading and math. However, in Speci-fication 2 with the above controls included, there is a small statistically significant relationship between spacing and math scores. A one-year increase in spacing is associated with an increase in scores of 0.0248 SD. The regressions with log or quadratic functional forms have slightly higherR-squared values, suggesting that the relationship might be non-linear; the level of spacing that maximizes predicted test scores is around six years. The coefficient on the dummy indicating spacing of shorter than two years is −0.07 for reading and −0.14 for math, indicating that especially close spacing has a strong negative association with academic achieve-ment.
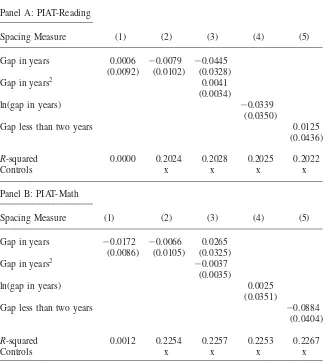
For the younger siblings, however, there is little association between spacing from the older sibling and test scores (Table 4). The raw correlation is negative for math, but the coefficient is smaller and statistically insignificant when controls are added. It does appear that spacing of shorter than two years is associated with lower math scores, but the effect is smaller than the effect for older children.
The results in this section show that longer spacing between siblings is associated with higher test scores, though primarily for older siblings. However, our results may be biased if spacing between siblings is correlated with unobservable charac-teristics of the mother or children. Rosenzweig (1986) and Rosenzweig and Wolpin (1988) show that unobserved heterogeneity across- and within-families biases OLS
14. We measure spacing as days between births, and convert it to years by dividing by 365 for ease in interpretation.
Table 3
OLS Estimates of Effect of Spacing on Test Scores of OLDER Siblings
Panel A: PIAT-Reading
Spacing Measure (1) (2) (3) (4) (5)
Gap in years 0.0023 0.0136 0.0672
(0.0096) (0.0086) (0.0327) Gap in years2
−0.0060
(0.0034)
ln(gap in years) 0.0615
(0.0304)
Gap less than two years −0.0712
(0.0408)
R-squared 0.0000 0.1932 0.1939 0.1936 0.1934
Controls x x x x
Panel B: PIAT-Math
Spacing Measure (1) (2) (3) (4) (5)
Gap in years 0.0075
(0.0087)
0.0248 (0.0077)
0.1029 (0.0320) Gap in years2
−0.0087
(0.0033)
ln(gap in years) 0.1074
(0.0279)
Gap less than two years −0.1375
(0.0388)
R-squared 0.0002 0.2117 0.2132 0.2129 0.2129
Controls x x x x
Each column is from a separate regression and gives the coefficient on the spacing measure for the indicated specification (where gaps in years are calculated as days/365). Each observation is a sibling pair, and child weights are used. The dependent variable is the age-adjusted, standardized test score in math or reading, for the older sibling in the pair. Additional controls include child gender and mother’s race, age at first birth, education, ideal family size in 1979, marital status, AFQT score, and child month-and year-of-birth dummies. Standard errors are clustered by mother (in parentheses). Sample is restricted to intervals smaller than ten years; there are 4,398 observations in each regression.
Table 4
OLS Estimates of Effect of Spacing on Test Scores of YOUNGER Siblings
Panel A: PIAT-Reading
Spacing Measure (1) (2) (3) (4) (5)
Gap in years 0.0006 −0.0079 −0.0445 (0.0092) (0.0102) (0.0328)
Gap in years2 0.0041
(0.0034)
ln(gap in years) −0.0339
(0.0350)
Gap less than two years 0.0125
(0.0436)
R-squared 0.0000 0.2024 0.2028 0.2025 0.2022
Controls x x x x
Panel B: PIAT-Math
Spacing Measure (1) (2) (3) (4) (5)
Gap in years −0.0172 −0.0066 0.0265 (0.0086) (0.0105) (0.0325) Gap in years2
−0.0037
(0.0035)
ln(gap in years) 0.0025
(0.0351)
Gap less than two years −0.0884
(0.0404)
R-squared 0.0012 0.2254 0.2257 0.2253 0.2267
Controls x x x x
Each column is from a separate regression and gives the coefficient on the spacing measure for the indicated specification (where gaps in years are calculated as days/365). Each observation is a sibling pair, and child weights are used. The dependent variable is the age-adjusted, standardized test score in math or reading, for the younger sibling in the pair. Additional controls include child gender and mother’s race, age at first birth, education, ideal family size in 1979, marital status, AFQT score, and child month-and year-of-birth dummies. Standard errors are clustered by mother (in parentheses). Sample is restricted to intervals smaller than ten years; there are 4,074 observations in each regression.
likely others. In order to address this problem, we employ an identification strategy that uses miscarriages as exogenous factors that affect birth spacing.
V. Miscarriages as an Instrumental Variable
A miscarriage is a pregnancy that is lost before the 20th week of gestation.16Ten to 20 percent of confirmed pregnancies—and as many as 50 percent
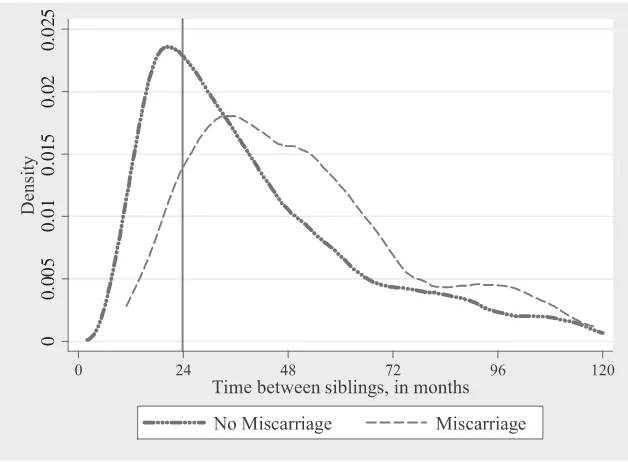
of all conceptions—are thought to end in a miscarriage (ACOG 2002). We use miscarriages that occur between two live births as an instrument for birth spacing. The critical point for our estimation strategy is that a miscarriage between two siblings induces a delay in the birth of the younger child—the next live birth now occurs after the woman miscarries, conceives again, and gives birth. Estimates of average time to conception for women who conceived within one year of a miscar-riage range from 17.35 weeks (Goldstein, Croughan, and Robertson 2002) to 23.2 weeks (Wyss, Biedermann, and Huch 1994). This would generally increase the av-erage spacing between children by about 6 to 8 months, assuming a mean of around eight weeks gestation at miscarriage. Figure 2 shows the distribution of birth spacing for women who do and do not have a miscarriage between live births. In the mis-carriage sample, the spacing distribution is shifted to the right, and the fraction of births spaced less than two years apart appears to be much lower. In the next section, we provide regression estimates of the effect of a miscarriage on birth spacing for our NLSY79 sample.
The 2SLS estimates below identify the effect of spacing on children’s academic achievement, for cases where the spacing was affected by a miscarriage. Thus, we are identifying the impact of increasing spacing by “accident,” which may not be the same as the policy-relevant effect of increasing spacing by (for example) in-forming women of its benefits. However, we believe our results are still informa-tive—particularly because we would expect that any effects of moving women away from their optimal timing by an accidental event would be negative, where we find positive effects below. We also note that for the younger child in a sibling pair, a miscarriage induces a change in spacinganda change in parents’ age at the child’s birth, and with our specification we cannot identify the effect of spacing independent of parental age. From a policy perspective, the combined effect is the one of interest, since any policy that increased spacing would automatically also increase parental age. Moreover, the few studies that consider the effects of maternal age for later born children typically find no association between maternal age and child educa-tional outcomes (Gueorguieva et al. 2001; Lo´pez Turley 2003; Leigh and Gong 2010; Bradbury 2011). Nonetheless, we keep this in mind when interpreting our results for younger siblings.
Previous studies have used miscarriages as an instrument for the timing offirst births. In this setting, Hotz, Mullin, and Sanders (1997) show that miscarriage is an
0
0.005
0.01
0.015
0.02
0.025
Figure 2
Distribution of Birth Spacing in NLSY79, by Miscarriage
Samples are restricted to intervals less than ten years, and to intervals through the fifth child. There are 4,719 intervals with no miscarriage and 291 intervals with a miscarriage between the births. Kernel density estimates are shown.
appropriate instrumental variable for women who experience random miscarriages. They use this instrument to explore the effect of teenage childbearing on teen moth-ers’ outcomes. Building on this work, Hotz, McElroy, and Sanders (2005) use mis-carriages to identify the effect of delayed childbearing on teenage mothers’ socio-economic attainment. Miller (2011) uses biological fertility shocks, including miscarriage, to instrument for the age at which a woman bears her first child in her analysis of the effects of delayed childbearing on subsequent earnings. However, the use of this instrument is not without its challenges. We now address four significant threats to this identification strategy.
only 3.3 percent report having an abortion between their first and second live birth, while 7.9 percent of women report having an abortion in their first pregnancy.17
These numbers raise a second concern, however, which is that miscarriages are underreported in the NLSY79. Systematic misreporting of miscarriage among women who intentionally aborted would bias our estimates (Wilde, Batchelder, and Ellwood 2010). Using a similar sample of women with children in the NLSY79, Miller (2011) finds that miscarriage is unrelated to religious beliefs, a likely correlate of misreporting. We follow Hotz, Mullin, and Sanders (1997) and assume that un-derreporting of miscarriages is random with respect to child outcomes; to the extent that women underreport miscarriages randomly, this would bias our estimates down-ward.
Third, the IV estimates would be invalid if miscarriages are correlated with unob-servable characteristics of the mother or child. Chromosomal abnormality in the fetus is the most common reason for a miscarriage, accounting for over 50 percent of miscarriages in known pregnancies during the first 13 weeks (ACOG 2002; Cun-ningham et al. 2010). In most instances, the abnormality is a random occurrence and is not associated with higher risk of miscarrying in the future; we omit women with more than one miscarriage after her first live birth. There are known risk factors for miscarriage, including maternal age, multiple births,maternal illness or trauma, hormonal imbalances, and other reproductive issues (ACOG 2002; Cunningham et al. 2010). Behaviors such as drug use, alcohol abuse, and smoking are also correlated with miscarriage, as are community-level risk factors (Fletcher and Wolfe 2009; Mullin 2005).18 Finally, women are more likely to miscarry after having a boy,
possibly due to immune responses of the mother (Nielsen et al. 2008).
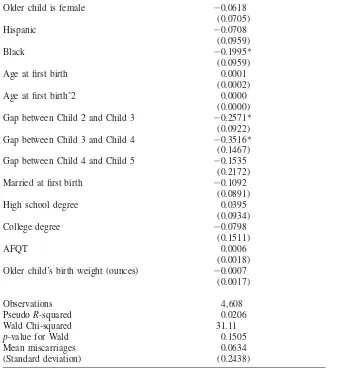
To explore the extent to which miscarriages might be associated with observable characteristics, Table 5 presents marginal effects from a probit regression of a dummy for a miscarriage between births on predetermined characteristics of the mother and birth.19 The only characteristics that appear to be associated with the
risk of a later miscarriage are mother’s race and indicators for Gap 2-3 and Gap 3-4. All other variables are statistically insignificant, and the null hypothesis that all covariates are jointly zero cannot be rejected (p= 0.1505).20 Nevertheless, in all
17. To further alleviate concerns that miscarriages are latent abortions, we have omitted women with an abortion after the first live birth.
18. We can control for alcohol use and smoking for a subset of our sample, and results are not affected by their inclusion.
19. An alternative way to address concerns that miscarriages are correlated with unobservable character-isticsacrossfamilies is to include mother fixed effects in our specifications. However, this is only feasible for women with at least two gaps (or three children). Fewer than half of the women in our sample have more than two children, and we were unable to obtain precise estimates using this method. We have also added the miscarriage variable to our OLS regressions of the effects of spacing in Tables 3 and 4, and in all but one case (withp= 0.097) we failed to reject the null hypothesis that miscarriages have no ceteris paribus effect on test scores at the 10 percent level.
Table 5
Marginal Effects from a Probit Regression of Miscarriage on Precharacteristics
Older child is female −0.0618
(0.0705)
Hispanic −0.0708
(0.0959)
Black −0.1995*
(0.0959)
Age at first birth 0.0001
(0.0002)
Age at first birthˆ2 0.0000
(0.0000) Gap between Child 2 and Child 3 −0.2571*
(0.0922) Gap between Child 3 and Child 4 −0.3516*
(0.1467) Gap between Child 4 and Child 5 −0.1535
(0.2172)
Married at first birth −0.1092
(0.0891)
High school degree 0.0395
(0.0934)
College degree −0.0798
(0.1511)
AFQT 0.0006
(0.0018) Older child’s birth weight (ounces) −0.0007
(0.0017)
Observations 4,608
PseudoR-squared 0.0206
Wald Chi-squared 31.11
p-value for Wald 0.1505
Mean miscarriages 0.0634
(Standard deviation) (0.2438)
results below we add them as controls. As a robustness check, we have reproduced our 2SLS results omitting black women from the sample; the estimated coefficients are very similar but are less precisely estimated.21
Finally, we are concerned that the miscarriage itself could have a direct effect on children’s outcomes, in particular through its impact on the mother’s mental and physical well-being. A number of studies show that women who experience a mis-carriage are more likely to suffer from depression and anxiety (Armstrong 2002; Armstrong and Hutti 1998; Neugebauer et al. 1992). However, previous research also suggests that these symptoms decrease over time and usually disappear 12 months after a miscarriage (Thapar and Thapar 1992; Janssen et al. 1996; Hughes, Turton, and Evans 1999). Women who have a healthy pregnancy following a mis-carriage or stillbirth might also be at decreased risk for depressive symptoms (Swan-son 2000; Theut et al. 1989). Other evidence suggests that women are less attached to children born after a stillbirth, which could lead to later developmental problems (Hughes et al. 2001) but miscarrying appears to have no effect on investment in subsequent children (Armstrong 2002; Theut et al. 1992).22Miscarriage might also
have a direct effect on the development of the fetus in subsequent births. Swingle et al. (2009) find that women are at greater risk of having a preterm birth following a miscarriage, though Wyss, Biedermann, and Huch (1994) show that women who had already given birth to a child prior to a miscarriage are at lower risk of delivering prematurely than those who had not previously given birth.
Importantly, the vast majority of the evidence on the effects of miscarriage would lead us to conclude that miscarriage would have, if anything, a negativeeffect on the well-being of the mother or her children.23If that is the case we would expect
our 2SLS estimates to be biased against finding a beneficial effect of spacing, which works in opposition to our findings below that increased spacing haspositiveeffects on child outcomes.
21. Related to the issue of nonrandom miscarriage is the concern that women who miscarry and go on to conceive again might be different from women who miscarry and stop, which could lead to selection bias. For example, women who miscarry and conceive again might have a stronger preference for children. We use information on the wantedness of live births, and show that women who have a miscarriage between live births were no more likely to say that theirfirstchild was wanted than women who never have a miscarriage—the means were 0.615 and 0.613, respectively, and thep-value for the null hypothesis that the means are the same is 0.96.
We also compare observable characteristics of women who have a miscarriage and no further children to those that have a subsequent birth, and find that the “stoppers” are more educated and have higher AFQT scores and incomes than those who continued. This would suggest that our sample with a miscarriage between live births is, if anything, negatively selected, which would bias us against finding a beneficial effect of spacing.
22. Women in our sample were actually less likely to say that a child born after a miscarriage was wanted (which would again bias us against finding a beneficial effect of spacing), though the difference is statis-tically insignificant (p= 0.373).
Table 6
First Stage Estimates of Effect of Miscarriage on Spacing
Panel A: Older Siblings
Dependent Variable
Gap in Years ln(Gap in Years) Gap < 2 Years
Miscarriage = 1 0.6769 0.2333 −0.1858
(0.1273) (0.0320) (0.0219)
F-statistic 28.26 53.12 71.85
Dependent variable mean 3.40 1.07 0.26
Panel B: Younger Siblings
Dependent Variable
Gap in Years ln(Gap in Years) Gap < 2 Years
Miscarriage = 1 0.6263 0.2114 −0.1598
(0.1190) (0.0309) (0.0233)
F-statistic 27.71 46.93 46.85
Dependent variable mean 41.74 3.57 0.26
Each entry is from a separate regression and gives the coefficient on the indicator for miscarriage, where the dependent variable is the indicated measure of spacing (gaps in years are calculated as days/365). Each observation is a sibling pair, and child weights are used. Additional controls include child gender and mother’s race, age at first birth, education, ideal family size in 1979, marital status, AFQT score, and child month- and year-of-birth dummies. Standard errors are clustered by mother (in parentheses). Sample is restricted to intervals smaller than ten years; there are 4,821 observations in the older sample and 4,683 in the younger sample.
VI. Results
Table 6 shows the first-stage effect of miscarriage on our measures of spacing. We control for demographic characteristics of the mother, for child gen-der and birth orgen-der, and for year- and month-of-birth dummies. For olgen-der children, a miscarriage before the birth of the next child is associated with an increase in spacing of 0.68 years (8.12 months), or an increase of about 23 percent using the logged dependent variable.24Miscarriage also decreases the likelihood that the
spac-ing is shorter than two years by 19 percentage points. This is a large change relative to the mean (0.26), which indicates that most women who would have had spacing
of shorter than two years but miscarry are pushed past the two-year mark by the event. For the sample of younger siblings, the estimated effect is slightly smaller and also statistically significant. The F-statistics are well above 10 in all cases, alleviating concerns about a weak instrument.
The 2SLS results are in Table 7, with results for older siblings in Panel A. The effect of spacing in years is positive for both subjects, though marginally significant for math (p= 0.110). For reading, the coefficient indicates that a one-year increase in spacing increases test scores by 0.173 SD. The estimated magnitude from the log specification is comparable; a 10 percent increase in spacing (which is about four months at the mean) increases scores by 0.05 SD.25There is a large negative effect
of spacing of shorter than two years on both math and reading scores. The coefficient for math scores is−0.58 (marginally significant withp= 0.106), and for reading is
−0.65 (p= 0.077). We find no statistically significant effects of spacing on test scores
for younger siblings (Panel B). For both subjects and for all specifications, the coefficients are statistically insignificant and much smaller in magnitude than the results for older siblings.
While the OLS estimates in Table 3 also suggested a positive relationship between spacing and test scores for older siblings, the coefficients from the 2SLS specification are much larger. For example, the 2SLS estimate of the effect of an additional year of spacing is an order of magnitude larger than the comparable 2SLS estimate (0.1732 vs. 0.0136). The 2SLS estimate of the effect of spacing shorter than two years is also much bigger (−0.6481 vs.−0.0712). This suggests that the OLS results
are biased downward, which is consistent with Rosenzweig’s finding (1986) that when parents have a child with a better endowment, they have the next birth sooner. In results not shown here, we also find support for this claim—for example, when the older child has been admitted to the hospital before his or her first birthday, the time to the next birth is increased by about five months.
Given the economically meaningful differences in the coefficients, we believe there is convincing evidence that the 2SLS estimates should be the preferred esti-mates. However, the IV approach does have its weaknesses. First, the standard errors are large, which means that we would not able to detect smaller effects of spacing on test scores. Second, recall from our discussion in Section V that measurement error, selection bias, and the potential negative direct effect of a miscarriage would all bias our 2SLS estimates against finding a beneficial effect of spacing. Thus, we expect that we are underestimating the true effect. Last, for younger siblings we are not able to separate the effect of spacing from increased parental age—though the evidence suggests that parental age has little effect on achievement for later-born siblings.
VII. Discussion
Recall from our discussion in Section II that the predicted effect of spacing on test scores is ambiguous. Our 2SLS results indicate that greater spacing
Buckles
and
Munnich
633
Panel A: Older Siblings
PIAT-Reading PIAT-Math
Spacing Measure: Gap in Years ln(Gap in Years) Gap < 2 Years Gap in Years ln(Gap in Years) Gap < 2 Years
Coefficient 0.1732 (0.1044)
0.5056 (0.2946)
−0.6481 (0.3665)
0.1552 (0.1003)
0.4529 (0.2859)
−0.5808 (0.3597)
R-squared 0.1040 0.1367 0.1350 0.1501 0.1772 0.1772
Panel B: Younger Siblings
PIAT-Reading PIAT-Math
Spacing Measure: Gap in Years ln(Gap in Years) Gap < 2 Years Gap in Years ln(Gap in Years) Gap < 2 Years
Coefficient 0.0211 (0.1176)
0.0647 (0.3595)
−0.0892 (0.4956)
−0.0613 (0.1066)
−0.1875 (0.3265)
0.2587 (0.4532)
R-squared 0.1998 0.1999 0.2001 0.2173 0.2170 0.2055
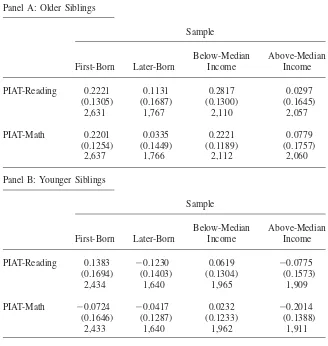
increases academic achievement for older siblings; one potential explanation that would generate this result is that spacing allows parents to spend more time with older children. If this is the case, we might expect the benefits of spacing to be especially strong for first-born children, who reap the benefits of a longer period as an only child when spacing is large—as Price (2010) suggests. In Panel A of Table 8, we show 2SLS estimates of the effects of spacing in years, for first- and later-born older siblings. While we cannot reject that the coefficients are the same, the magnitudes are in fact larger for first-born children and are statistically insignificant for higher order births.
A related explanation is that greater spacing allows for greater financial invest-ment in older children, so we might expect the benefit of spacing to be greater for families that are financially constrained (Powell and Steelman 1995). In Table 8 we also show results for children from families above and below median family income for the sample. We find that the negative effects of close spacing for older siblings are in fact larger for the low-income group, and are not statistically significant for those with high incomes. However, an important caveat is that income may be endogenous to spacing (Troske and Voicu 2009). In Panel B, we show results anal-ogous to those in Panel A but for younger siblings, and we continue to find no effect of spacing on test scores for younger siblings.
In Table 9, we explore the extent to which some of the mechanisms discussed in Section II might explain the benefits of spacing that we have observed for older children. The estimates in Table 9 are created using the same specification as in Table 7, but with measures of inputs into child quality as the dependent variable. For brevity, we show the results for the effect of spacing in years. Each column in Table 9 represents a separate regression. First, note that random variation in spacing should not affect the birth weight of the older child, and this is what we find. However, spacing does increase the probability that the mother reported reading to the child every day when the child was of preschool age. Likewise, the probability that there are more than ten books in the house is increased by spacing. Each year of spacing also results in a marginally significant decrease in the hours of television the child watched on weekdays as a preschooler. These results suggest that both time and financial investments in the older child may be increased by spacing. We find no effect of spacing on mother’s work experience in the previous year or on the probability that the parents have ever been divorced.
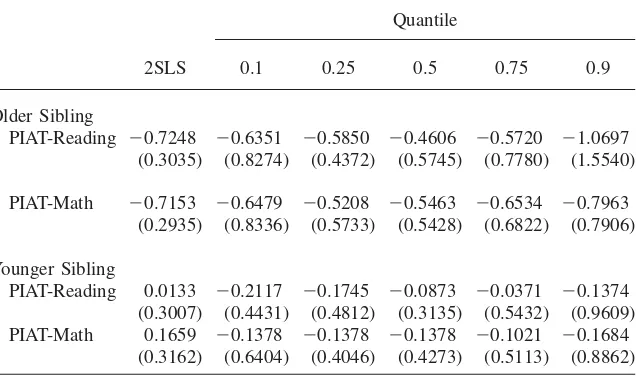
Finally, the results in Table 7 showed that greater spacing increases mean test scores; one might also be interested in how spacing changes the test score distri-bution. To address this question, we use techniques developed by Abadie, Angrist, and Imbens (2002) and by Fro¨lich and Melly (2010) for the estimation of quantile treatment effects (QTEs). We use miscarriages as an instrument to estimate uncon-ditional QTEs of spacing shorter than two years.26 These results are in Table 10.
First, for comparison, in Panel A we show the quantile analogs of the OLS results
Table 8
2SLS Estimates of Effect of Birth Spacing in Years, for Selected Subsamples
Panel A: Older Siblings
Sample
First-Born Later-Born
Below-Median Income
Above-Median Income
PIAT-Reading 0.2221 0.1131 0.2817 0.0297
(0.1305) (0.1687) (0.1300) (0.1645)
2,631 1,767 2,110 2,057
PIAT-Math 0.2201 0.0335 0.2221 0.0779
(0.1254) (0.1449) (0.1189) (0.1757)
2,637 1,766 2,112 2,060
Panel B: Younger Siblings
Sample
First-Born Later-Born
Below-Median Income
Above-Median Income
PIAT-Reading 0.1383 −0.1230 0.0619 −0.0775
(0.1694) (0.1403) (0.1304) (0.1573)
2,434 1,640 1,965 1,909
PIAT-Math −0.0724 −0.0417 0.0232 −0.2014
(0.1646) (0.1287) (0.1233) (0.1388)
2,433 1,640 1,962 1,911
Each entry is from a separate 2SLS regression for the indicated sample, where miscarriage is used as an instrument for spacing shorter than two years. See text for details on how median income is calculated. The dependent variable is the age-adjusted, standardized test score. Each observation is a sibling pair, and child weights are used. Additional controls include child gender and mother’s race, age at first birth, education, ideal family size in 1979, marital status, AFQT score, and child month- and year-of-birth dummies. Standard errors are clustered by mother (in parentheses); number of observations is given below the standard error. Sample is restricted to intervals smaller than ten years.
Journal
of
Human
Resources
Table 9
2SLS Estimates of Effect of Spacing on Inputs into Child Quality for the Older Child
Dependent Variable
Observations 4,608 3,410 4,798 3,409 4,821 4,821
Table 10
Estimates of Effect of Spacing on Test Score Distribution
Panel A: Quantile Regression and OLS Estimates
Quantile
OLS 0.1 0.25 0.5 0.75 0.9
Older Sibling
PIAT-Reading −0.0971 −0.1616 −0.1244 −0.0501 −0.0743 −0.0999
(0.0318) (0.0585) (0.0412) (0.0308) (0.0494) (0.1037) PIAT-Math −0.146 −0.2399 −0.1378 −0.1326 −0.0716 −0.1379
(0.0309) (0.0519) (0.0420) (0.0425) (0.0507) (0.0886) Younger Sibling
PIAT-Reading −0.0090 0.0000 0.0131 0.1244 0.0372 0.1244
(0.0308) (0.0557) (0.0474) (0.0381) (0.0524) (0.1395) PIAT-Math −0.0895 0.0000 −0.0716 −0.1021 −0.1021 −0.0308
(0.0320) (0.0553) (0.0476) (0.0458) (0.0611) (0.0850) Panel B: Quantile Treatment Effects and 2SLS Estimates
Quantile
2SLS 0.1 0.25 0.5 0.75 0.9
Older Sibling
PIAT-Reading −0.7248 −0.6351 −0.5850 −0.4606 −0.5720 −1.0697 (0.3035) (0.8274) (0.4372) (0.5745) (0.7780) (1.5540) PIAT-Math −0.7153 −0.6479 −0.5208 −0.5463 −0.6534 −0.7963
(0.2935) (0.8336) (0.5733) (0.5428) (0.6822) (0.7906) Younger Sibling
PIAT-Reading 0.0133 −0.2117 −0.1745 −0.0873 −0.0371 −0.1374
(0.3007) (0.4431) (0.4812) (0.3135) (0.5432) (0.9609) PIAT-Math 0.1659 −0.1378 −0.1378 −0.1378 −0.1021 −0.1684
imprecise; we conclude only that there is no evidence that the negative effects of close spacing are confined to any particular part of the distribution.27
VIII. Conclusion
In this paper, we have examined the relationship between an impor-tant component of family structure—birth spacing—and academic achievement. Be-cause we are concerned that unobserved within- and across-family heterogeneity might bias OLS estimates, we use miscarriages that occur between live births as an instrument for child spacing. We find a beneficial effect of spacing for older siblings, and the magnitude of the effect is much larger than that estimated with OLS. A one-year increase in spacing improves reading scores for older children by 0.17 SD— an effect comparable to estimates of the effect of birth order, and three times the effect of increasing annual family income by $1,000 (Dahl and Lochner 2011). Spacing of shorter than two years decreases scores by 0.65 SD. We find no effect of spacing on test scores for younger siblings.
This evidence of an effect of birth spacing on child outcomes is an important contribution to the literature on the effects of family structure. In particular, Price (2008, 2010) suggests that the birth order premium may be a result of differences in parental time investments. Our finding that spacing improves outcomes for older children is consistent with this hypothesis. We present some evidence that the bene-fits of spacing are greater for first-born children, and show that spacing increases the probability that the child was read to daily as a preschooler.
Further, our results indicate that spacing could be an important channel through which parents can improve child outcomes. We only find a beneficial effect of spac-ing on the academic achievement of older siblspac-ings, but since there is no evidence of anegativeeffect for younger siblings, parents may be able to improve outcomes for the former without harming the latter. As a matter of public policy, our findings suggest that programs that encourage greater interpregnancy intervals for health rea-sons could have unanticipated benefits. An important caveat is that our sample only included children in the United States; more research is required to determine whether spacing is a means to improve outcomes in developing or high-fertility societies.
Last, we have considered only one important outcome for children—academic achievement. The test with which achievement was assessed was typically admin-istered between the ages of five and seven, so future work should consider whether these effects persist. Also, as the children in the NLSY79 Child and Young Adult Survey age, we hope to be able to consider other outcomes like health, educational attainment, and the likelihood of engaging in risky behaviors. An additional question
for future research is whether birth spacing affects the well-being of parents (beyond maternal health).
References
Abadie, Alberto, Joshua Angrist, and Guido Imbens. 2002. “Instrumental Variables Esti-mates of the Effect of Subsidized Training on the Quantiles of Trainee Earnings.” Econo-metrica70(1):91–117.
American College of Obstetricians and Gynecologists. 2002.Early Pregnancy Loss: Miscar-riage and Molar Pregnancy. Washington, D.C.: American College of Obstetricians and Gynecologists. Accessed 26 February 2010: http://www.acog.org/publications/pa-tient_education/bp090.cfm.
Armstrong, Deborah Smith. 2002. “Emotional Distress and Prenatal Attachment in Preg-nancy After Perinatal Loss.”Journal of Nursing Scholarship34(1):339–45.
Armstrong, Deborah, and Marianne Hutti. 1998. “Pregnancy after Perinatal Loss: The Rela-tionship Between Anxiety and Prenatal Attachment.”Journal of Obstetric, Gynecologic, and Neonatal Nursing27(2):185–89.
Bhalotra, Sonia, and Arthur van Soest. 2008. “Birth-Spacing, Fertility and Neonatal Mortal-ity in India: Dynamics, Frailty, and FecundMortal-ity.”Journal of Econometrics143:274–90. Bjerkedal, Tor, Petter Kristensen, Geir A. Skjeret, and John I. Brevik. 2007. “Intelligence
Test Scores and Birth Order Among Young Norwegian Men (Conscripts) Analyzed Within and Between Families.”Intelligence35(5):503–14.
Black, Sandra, Paul Devereux, and Kjell Salvanes. 2005. “The More the Merrier? The Ef-fect of Family Size and Birth Order on Children’s Education.”Quarterly Journal of Eco-nomics120(2):669–700.
———. 2007. “Older and Wiser? Birth Order and IQ of Young Men.” IZA Working Paper #3007.
———. 2010. “Small Family, Smart Family? Family Size and the IQ Scores of Young Men.”Journal of Human Resources45(1):33–58.
Bradbury, Bruce. 2011. “Young Motherhood and Child Outcomes.” Social Policy Research Centre Report 1/11, prepared for the Australian Government Department of Families, Housing, Community Services and Indigenous Affairs. Accessed 18 August 2011 at http://www.sprc.unsw.edu.au/media/File/1_Report1_11_YoungMotherhood.pdf.
Broman, Sarah H., Paul L. Nichols, and Wallace A. Kennedy. 1975.Preschool IQ: Prenatal and Early Developmental Correlates. Hillsdale, N.J.: L. Erlbaum Associates.
Butcher, Kristin F., and Anne Case. 1994. “The Effect of Sibling Sex Composition on Women’s Education and Earnings.”The Quarterly Journal of Economics109(3):531–63. Cheslack-Postava, Keely, Kayuet Liu, and Peter S. Bearman. 2011. “Closely Spaced
Preg-nancies Are Associated With Increased Odds of Autism in California Sibling Births.” Pe-diatrics127(2):246–53
Christensen, Harold. 1968. “Children in the Family: Relationship of Number and Spacing to Marital Success.”Journal of Marriage and Family30(2):283–89.
Cicirelli, Victor G. 1973. “Effects of Sibling Structure and Interaction on Children’s Catego-rization Style.”Developmental Psychology9(1):132–39.
Contra County Health Services. 2007. “Campaign to Encourage Spacing Babies Launched.” Press Release, August 27. Accessed 20 May 2011: http://cchealth.org/press_releases/ birth_spacing_campaign_2007_08.php.
Cunningham, F. Gary, Kenneth J. Leveno, Steven L. Bloom, John C. Hauth, Dwight J. Rouse, Catherine Y. Spong. 2010.Williams Obstetrics, Twenty-Third Edition. The Mc-Graw-Hill Companies, Inc. Accessed 28 February 2010: http://www.accessmedicine.com/ content.aspx?aID = 6053140.
Dahl, Gordon, and Lance Lochner. 2011. “The Impact of Family Income on Child Achieve-ment: Evidence from Changes in the Earned Income Tax Credit.”American Economic Review. Forthcoming.
Dahl, Gordon, and Enrico Moretti. 2008. “The Demand for Sons.”Review of Economic Studies75(4):1085–1120.
DaVanzo, Julie, Lauren Hale, Abdur Razzaque, and Mizanur Rahman. 2008. “The Effects of Pregnancy Spacing on Infant and Child Mortality in Matlab, Bangladesh: How They Vary by the Type of Pregnancy Outcome That Began the Interval.”Population Studies 62(2):131–54.
Deschenes, Olivier. 2007. “Estimating the Effect of Family Background on the Return to Schooling.”Journal of Business and Economic Statistics25(3):265–77
Fletcher, Jason, and Barbara Wolfe. 2009. “Education and Labor Market Consequences of Teenage Childbearing: Evidence Using the Timing of Pregnancy Outcomes and Commu-nity Fixed Effects.” Journal of Human Resources 44(2):303–25.
Fro¨lich, Markus, and Blaise Melly. 2010. “Estimation of Quantile Treatment Effects with Stata.”Stata Journal10(3):423–25.
Galbraith, Richard C. 1982. “Sibling Spacing and Intellectual Development: A Closer Look at the Confluence Models.”Developmental Psychology18(2):151–73.
Goldstein, Rachel R., Mary S. Croughan, and Patricia A. Robertson . 2002. “Neonatal Out-comes in Immediate Versus Delayed Conceptions After Spontaneous Abortion: A Retro-spective Case Series.”American Journal of Obstetrics and Gynecology186(6):1230–35. Gueorguieva, Ralitza V., Randy L. Carter, Mario Ariet, Jeffrey Roth, Charles S. Mahan, and
Michael B. Resnick. 2001. “Effect of Teenage Pregnancy on Educational Disabilities in Kindergarten.”American Journal of Epidemiology154(3):212–20.
Guilkey, David K., and Susan Jayne. 1997. “Fertility Transition in Zimbabwe: Determinants of Contraceptive Use and Method Choice.”Population Studies51(2):173–89.
Hanushek, Eric A. 1992. “The Trade-Off Between Child Quantity and Quality,”Journal of Political Economy100(1):84–117.
Hauser, Robert M., and Hsiang-Hui Daphne Kuo. 1998. “Does the Gender Composition of Sibships Affect Women’s Educational Attainment?”Journal of Human Resources 33(3):644–57.
Heckman, James, and James Walker. 1990. “The Relationship Between Wages and Income and the Timing and Spacing of Births: Evidence from Swedish Longitudinal Data.” Econ-ometrica58(6):1411–41.
Hotz, V. Joseph, Susan Williams McElroy, and Seth G. Sanders. 2005. “Teen Childbearing and Its Life Cycle Consequences.”Journal of Human Resources45(3):683–715. Hotz, V. Joseph, Charles Mullin, and Seth Sanders. 1997. “Bounding Causal Effects Using
Data from a Contaminated Natural Experiment: Analyzing the Effects of Teenage Child-bearing.”Review of Economic Studies64(4):575–603.
Hughes, Patricia M., Penelope Turton, Elizabeth Hopper, Gill A. McGauley, and Peter Fon-agy. 2001. “Disorganised Attachment Behaviour Among Infants Born Subsequent to Still-birth.”Journal of Child Psychology and Psychiatry42(6):791–801.
Jamison, Dean T., Joel G. Breman, Anthony R. Measham, George Alleyne, Mariam Clae-son, David B. Evans, Prabhat Jha, Anne Mills, Philip Musgrov, eds. 2006.Disease Con-trol Priorities in Developing Countries. Washington, D.C.: The World Bank and Oxford University Press.
Janssen, Hettie, Marianne Cuisinier, Kees Hoogduin, Kees de Graauw . 1996. “Controlled Prospective Study on the Mental Health of Women Following Pregnancy Loss.” Ameri-can Journal of Psychiatry153:226–23.
Jones, Kelly M. 2011. “Growing Up Together: Cohort Composition and Child Investment.” University of California, Berkeley. Unpublished.
Kaestner, Robert. 1997. “Are Brothers Really Better? Sibling Sex Composition and Educa-tional Achievement Revisited.”Journal of Human Resources32(2):250–84
Kessler, Daniel. 1991. “Birth Order, Family Size, and Achievement: Family Structure and Wage Determination.”Journal of Labor Economics9(4):413–26.
Lalive, Rfael, and Josef Zwiemu¨ller. 2005. “Does Parental Leave Affect Fertility and Re-turn-to-Work? Evidence from a ‘True Natural Experiment.’” IZA Discussion Papers #1613.
Lang, Kevin, and Adam Ashcraft. 2006. “The Consequences of Teenage Childbearing.” NBER Working Paper 12485.
Leigh, Andrew, and Xiaodong Gong. 2010. “Does Maternal Age Affect Children’s Test Scores?”Australian Economic Review43(1):12–27.
Lo´pez Turley, Ruth N. 2003. “Are Children of Young Mothers Disadvantaged Because of Their Mother’s Age or Family Background?”Child Development74(2):465–74. Miller, Amalia R. 2011. “The Effects of Motherhood Timing on Career Path.”Journal of
Population Economics24(3):1071–1100.
Mullin, Charles. 2005. “Bounding Treatment Effects with Contaminated and Censored Data: Assessing the Impact of Early Childbearing on Children.”Advances in Economic Analysis & Policy5(1), Article 8.
Neugebauer Richard, Jennie Kline, Patricia O’Connor, Patrick Shrout, Jim Johnson, Andrew Skodol, Judith Wicks, Mervyn Sussser 1992. “Determinants of Depressive Symptoms in the Early Weeks After Miscarriage.”American Journal of Public Health82(10):1332–39. Nielsen, Henriette Svarre, Anne-Marie Nybo Andersen, Astrid Marie Kolte, Ole Bjarne
Christiansen. 2008. “A Firstborn Boy is Suggestive of a Strong Prognostic Factor in Sec-ondary Recurrent Miscarriage: a Confirmation Study.”Fertility and Sterility89(4):907–11. Olukoya, A.A. 1986. “Traditional Child Spacing Practices of Women: Experiences from a
Primary Care Project in Lagos, Nigeria.”Social Science and Medicine23(3):333–36. Powell, Brian, and Lala Carr Steelman. 1993. “The Educational Benefits of Being Spaced
Out: Sibship Density and Educational Progress.”American Sociological Review 58(3):367–81.
———. 1995. “Feeling the Pinch: Age Spacing and Economic Investments in Children.” Social Forces73(4):1465–86.
Price, Joseph. 2008. “Parent-Child Quality Time: Does Birth Order Matter?”Journal of Hu-man Resources43(1): 240–265.
———. 2010. “The Effect of Parental Time Investments: Evidence from Natural Within-Family Variation.” Working Paper. Accessed 14 July 2010: http://byuresearch.org/home/ downloads/price_parental_time_2010.pdf.
Rosenzweig, Mark R., and Kenneth I. Wolpin. 1988. “Heterogeneity, Intrafamily Distribu-tion and Child Health.”Journal of Human Resources23(4):437–61.
Smits, Luc J., and Gerard G. Essed. 2001. “Short Interpregnancy Intervals and Unfavoura-ble Pregnancy Outcome: Role of Folate Depletion.”Lancet358:2074–77.
Steelman, Lala Carr, Brian Powell, Regina Werum, and Scott Carter. 2002. “Reconsidering the Effects of Sibling Configuration: Recent Advances and Challenges.”Annual Review of Sociology28:243–69.
Swanson, Kristen M. 2000. “Predicting Depressive Symptoms after Miscarriage: A Path Analysis Based on the Lazarus Paradigm.”Journal of Women’s Health & Gender-Based Medicine9(2):191–206.
Swingle, Hanes, Tarah Colaizy, Bridget Zimmerman, and Frank Morriss, Jr. 2009. “Abortion and the Risk of Subsequent Preterm Birth.”Journal of Reproductive Medicine54: 95– 108.
Thapar, Ajay K., and Anita Thapar. 1992. “Psychological Sequelae of Miscarriage: a Con-trolled Study Using the General Health Questionnaire and the Hospital Anxiety and De-pression Scale.”British Journal of General Practice42:94–96.
Theut, Susan K., Frank A. Pedersen, Martha J. Zaslow, Richard L. Cain, Beth A. Rabinov-ich, and John M. Morihisa. 1989. “Perinatal Loss and Parental Bereavement.”American Journal of Psychiatry146:635–39.
Theut, Susan K., Frank A. Pedersen, Martha J. Zaslow, Beth A. Rabinovich, Lara Levin, John J. Bartko. 1992. “Perinatal Loss and Maternal Attitudes Toward the Subsequent Child.”Infant Mental Health Journal13(2):157–66.
Todoroff, Karen, and Gary M. Shaw. 2000. “Prior Spontaneous Abortion, Prior Elective Ter-mination, Interpregnancy Interval, and Risk of Neural Tube Defects.”American Journal of Epidemiology151(5):505–11.
Troske, Kenneth, and Alexandru Voicu. 2009. “The Effect of the Timing and Spacing of Births on the Level of Labor Market Involvement of Married Women.”IZA Discussion Paper No. 4417.
United States Agency for International Development. 2006. “Healthier Mothers and Chil-dren Through Birth Spacing.” Issue brief, June. Accessed 20 May 2011 at http:// www.usaid. gov/our_work/global_health/pop/news/issue_briefs/healthy_birthspacing.pdf. Van Eijsden, Manon, Luc J.M. Smits, Marcel F. Van der Wal, and Gouke J. Bonsel. 2008. “Association Between Short Interpregnancy Intervals and Term Birth Weight: the Role of Folate Depletion.”American Journal of Clinical Nutrition88(1):147–53.
Wilde, Elizabeth Ty, Lily Batchelder, and David T. Ellwood. 2010. “The Mommy Track Di-vides: the Impact of Childbearing on Wages of Women of Different Skill Levels.” NBER Working Paper 16582.
Wineberg, Howard, and James McCarthy. 1989. “Child Spacing in the United States: Recent Trends and Differentials.”Journal of Marriage and Family51(1):213–28.
Wyss, Pius, Kurt Biedermann, and Albert Huch. 1994. “Relevance of the Miscarriage-New Pregnancy Interval.”Journal of Perinatal Medicine22(3):235–41.
Zajonc, Robert B. 1976. “Family Configuration and Intelligence.”Science192(4235):227– 36.
Zajonc, Robert B., and Gregory B. Markus. 1975. “Birth Order and Intellectual Develop-ment.”Psychological Review82(1):74–88.