Lewis Alexander
1-212-816-9882
Europe
Michael Saunders 44-20-7986-3299
Japan
Kiichi Murashima 81-3-5574-4730
United States
Robert V. DiClemente 1-212-816-9893
Australia/New Zealand
Paul Brennan Stephen Halmarick 61-2-8225-6043
Canada
Dana Peterson 1-212-816-3549
Emerging Markets
Donald Hanna 1-212-816-9891
See the Disclosure Appendix for the Analyst
Certification and Other Disclosures.
Global Economic
Outlook and Strategy
➤
Housing adjustment and tight financial conditions
continue to weigh on the U.S. economy. Aggressive
Fed easing and other policy measures should help, but
a sustained pickup in growth depends on improved
financial conditions.
➤
Activity in the United Kingdom is also slowing. We
expect the BoE to continue to ease policy gradually
through yearend. We do not anticipate ECB easing
until late in the second quarter.
➤
As the U.S. slowdown broadens to consumption and
investment, other countries should be more affected.
But we expect only a modest slowdown in emerging
economies.
[image:1.612.120.549.69.711.2]➤
Inflation worries in emerging markets are probably
overblown but they will reduce the scope for monetary
loosening in the short run.
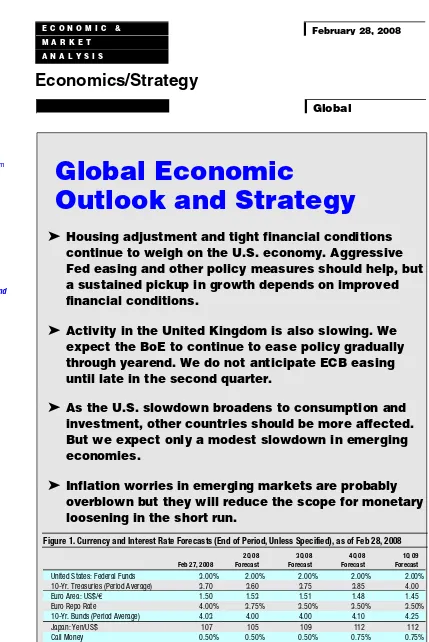
Figure 1. Currency and Interest Rate Forecasts (End of Period, Unless Specified), as of Feb 28, 2008
2Q 08 3Q 08 4Q 08 1Q 09
Feb 27, 2008 Forecast Forecast Forecast Forecast
United States: Federal Funds 3.00% 2.00% 2.00% 2.00% 2.00% 10-Yr. Treasuries (Period Average) 3.70 3.60 3.75 3.85 4.00 Euro Area: US$/€€ 1.50 1.53 1.51 1.48 1.45 Euro Repo Rate 4.00% 3.75% 3.50% 3.50% 3.50% 10-Yr. Bunds (Period Average) 4.03 4.00 4.00 4.10 4.25
Japan: Yen/US$ 107 105 109 112 112
Call Money 0.50% 0.50% 0.50% 0.75% 0.75% 10-Yr. JGB (Period Average) 1.49 1.70 1.70 1.80 1.80
Source: Citi.
E C O N O M I C & February 28, 2008
M A R K E T
A N A L Y S I S
Economics/Strategy
2
Table of Contents
Page
Key Events Calendar 2
Summary of Main Views 3
Overview 4-9
Short-Term Economic Forecasts 10
Key Global Economic Indicators 11
Short-Term Currency, Interest Rate and Bond Forecasts 12-13
Foreign Exchange Strategy 14-15
Global Equity Strategy 16-17
Long-Term Economic and Market Forecasts 18-19
Country Commentary
United States 20
Japan 21
Euro Area 22-24
United Kingdom 25
Switzerland, Sweden, Denmark, and Norway 26
Canada 27
Australia and New Zealand 28
China 29
Emerging Markets 30-38
EMA Contact List 39
[image:2.612.59.577.315.700.2]Recent Publications 40
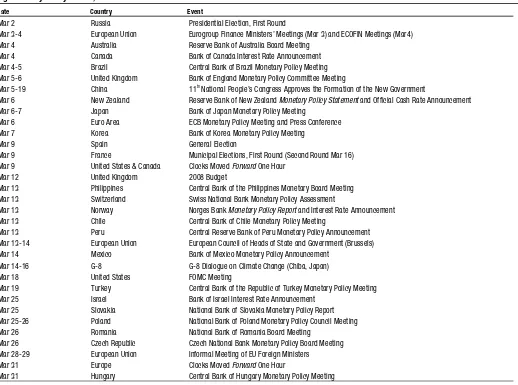
Figure 2. Key Policy Events, 28 Feb – 31 Mar 08
Date Country Event
Mar 2 Russia Presidential Election, First Round
Mar 3-4 European Union Eurogroup Finance Ministers’ Meetings (Mar 3) and ECOFIN Meetings (Mar4) Mar 4 Australia Reserve Bank of Australia Board Meeting
Mar 4 Canada Bank of Canada Interest Rate Announcement Mar 4-5 Brazil Central Bank of Brazil Monetary Policy Meeting Mar 5-6 United Kingdom Bank of England Monetary Policy Committee Meeting Mar 5-19 China 11th
National People’s Congress Approves the Formation of the New Government
Mar 6 New Zealand Reserve Bank of New Zealand Monetary Policy Statement and Official Cash Rate Announcement Mar 6-7 Japan Bank of Japan Monetary Policy Meeting
Mar 6 Euro Area ECB Monetary Policy Meeting and Press Conference Mar 7 Korea Bank of Korea Monetary Policy Meeting
Mar 9 Spain General Election
Mar 9 France Municipal Elections, First Round (Second Round Mar 16) Mar 9 United States & Canada Clocks Moved Forward One Hour
Mar 12 United Kingdom 2008 Budget
Mar 13 Philippines Central Bank of the Philippines Monetary Board Meeting Mar 13 Switzerland Swiss National Bank Monetary Policy Assessment
Mar 13 Norway Norges Bank Monetary Policy Report and Interest Rate Announcement Mar 13 Chile Central Bank of Chile Monetary Policy Meeting
Mar 13 Peru Central Reserve Bank of Peru Monetary Policy Announcement Mar 13-14 European Union European Council of Heads of State and Government (Brussels) Mar 14 Mexico Bank of Mexico Monetary Policy Announcement
Mar 14-16 G-8 G-8 Dialogue on Climate Change (Chiba, Japan) Mar 18 United States FOMC Meeting
Mar 19 Turkey Central Bank of the Republic of Turkey Monetary Policy Meeting Mar 25 Israel Bank of Israel Interest Rate Announcement
Mar 25 Slovakia National Bank of Slovakia Monetary Policy Report Mar 25-26 Poland National Bank of Poland Monetary Policy Council Meeting Mar 26 Romania National Bank of Romania Board Meeting
Mar 26 Czech Republic Czech National Bank Monetary Policy Board Meeting Mar 28-29 European Union Informal Meeting of EU Foreign Ministers
Mar 31 Europe Clocks Moved Forward One Hour
3 Figure 3. Forecast Highlights and Changes from Last Month
G3
•
United States
•
With tight financial conditions reinforcing economic weakness, the
Fed has taken a more aggressive tack, with only limited impact
thus far. We look for cuts in the funds rate to 2% by midyear,
barring a sharp recovery in risk appetite and housing leads.
•
Euro Area
•
Growth has slowed to a subtrend pace, where it probably will stay
until late this year. Inflation remains high but should moderate
quickly. We expect the ECB to ease policy modestly later this year.
•
Japan
•
Economic growth likely will remain near trend in 2008. The next
BoJ rate hike probably will be delayed until around yearend, as
uncertainties surrounding the global outlook have increased.
Others
•
United Kingdom
•
The MPC will likely cut rates a lot more, but any easing will be
gradual in order to grind down inflation expectations.
•
Canada
•
Moderating inflation and lingering downside risks likely will prompt
an additional 100 basis points of BoC easing before summer.
•
Australia
•
The RBA is set to tighten policy again in March and May, with the
risk of further tightening beyond that, as the Bank attempts to drive
inflation back down toward the 2%-3% target range.
•
China
•
Rising inflation and weakening exports could lead to a period of
tight monetary policy and loose fiscal policy.
4
Overview: The United States and World Economic Outlook
The recent deterioration in financial conditions is having its biggest impact on the U.S. economy. Europe is also slowing, but the spillover to most emerging economies remains modest so far. Looking ahead, we expect a variety of factors — including the waning of the drag from residential construction, fiscal stimulus, and improving financial conditions driven by a more assertive Fed — to contribute to a modest recovery in U.S. growth starting in the second half of the year.The forces restraining the pace of U.S. economic activity have shown few signs of easing in recent weeks. Incoming data from the housing sector point to ongoing contraction. The prevailing mix of credit, equity, and other asset prices continues to be a significant headwind for aggregate demand (see Figure 4). Consumption indicators suggest that household spending has slowed markedly.
The U.S. slowdown is a drag on the Canadian and Mexican economies, and economic activity in the United Kingdom and the euro area is also slowing, but less sharply than in the United States.
However, most other countries still show few signs of being adversely affected by the U.S.-led slowdown. Recent data for China point to a strong start to 2008, while resilient demand for commodities is supporting many emerging economies and smaller high-income countries with a comparative advantage in commodity production. The underperformance of the U.S. economy relative to most other major economies is contributing to downward pressure on the U.S. dollar (see Figure 5).
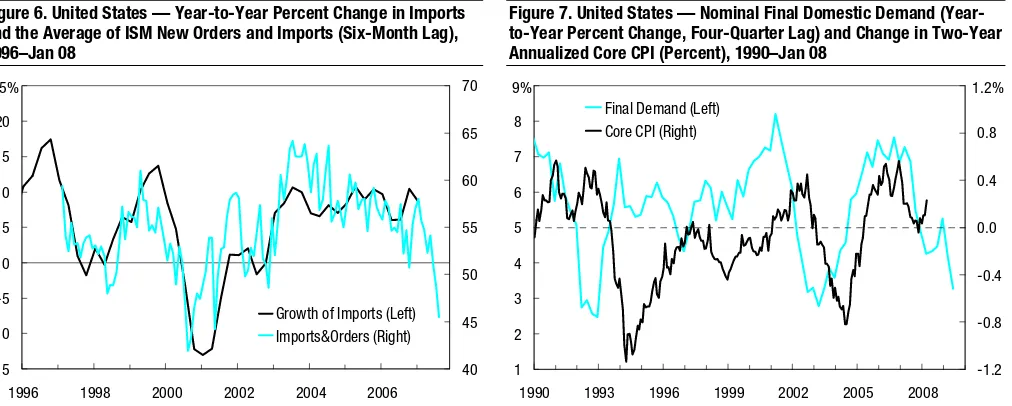
This pattern may change in coming quarters. The U.S. slowdown is spreading beyond residential construction. A broader and deeper slowdown in U.S. consumption and investment should generate a more significant slowdown in imports that will serve to moderate growth in the rest of the world (see Figure 6).
Policy flexibility around the world is likely to play an important role in containing the global slowdown. Unlike the past, many emerging economies (such as Brazil, Mexico, and Korea) have strong public and private balance sheets, and they have established
Figure 4. United States — Citi Financial Conditions Index (Standard Deviations) and the Output Gap (Percent of GDP), 1988-Jan 08
Figure 5. United States and Other Major Industrial Countries — Economic Surprises (100=1 Standard Deviation), Jan 07-27 Feb 08
-3 -2 -1 0 1 2 3
1988 1990 1992 1994 1996 1998 2000 2002 2004 2006 2008 -6 -4 -2 0 2 4 6
FCI (Left) GDP Gap (Right)
3σ 6%
-75 -50 -25 0 25 50 75 100
Jan-07 Apr-07 Jul-07 Oct-07 Jan-08 Apr-08 -75 -50 -25 0 25 50 75 100 United States Other Major Economies
Note: Shaded regions denote recession. Sources: Bureau of Economic Analysis, Congressional Budget Office and Citi.
Note: Citi Economic Surprise Indexes are weighted averages of the difference between individual data releases and the consensus forecast. “Other Industrial Countries” includes the euro area, Japan, Great Britain, Australia, and Canada. Source: Citi.
Lewis Alexander (212) 816-9882 lewis.alexander @citi.com
Financial conditions are weighing on the U.S. economy.
Most countries show few signs of distress...
...but that may change.
5 strong records of pursuing stable macroeconomic policies. This should make it possible for these countries to ease policy, if needed, even in the midst of substantial turmoil in global financial markets.
Strong commodity prices and declining output gaps in some countries are putting upward pressure on inflation. Nonetheless, we expect the slowdown in the United States and Western Europe to contain inflation in those countries (see Figure 7), and slowing export growth should help to contain inflationary pressures in other key countries such as China.
The evolution of financial conditions remains a key source of uncertainty. In recent days, credit, equity, and other financial markets seem to have found a footing in
response to the significant shift in Federal Reserve policy in late January, the U.S. fiscal stimulus package, and other policy measures intended to address some of the stress points in the financial system. However, even if financial markets stabilize and improve from here, the cumulative impact of the financial turmoil of the last six months is likely to be a drag on the U.S. and global economy for many months. Moreover, given the still considerable uncertainty about the magnitude and distribution of losses in the financial system, we cannot be confident that we have seen the worst in financial markets.
U.S. Financial Conditions Critical to the Outlook
Our composite measure of U.S. financial conditions has tightened since our last forecast round (see Figure 4). Currently, the Citi financial conditions index (FCI) is about two standard deviations tighter than normal, a reading consistent with anemic economic growth. Recent data, particularly the deceleration of consumption since November, appear consistent with the deterioration in financial conditions since last summer. The Federal Reserve seems likely to lower policy rates further in an attempt to offset the adverse dynamic starting to take hold. Importantly, forecasts of a sustained
improvement in the pace of activity later this year depend on a recovery in financial conditions.
The recently enacted fiscal stimulus package will boost economic growth later this year — most likely in the third quarter — but its impact on activity will be temporary. The lift in household disposable income from the rebate checks could underpin consumer spending growth that is about 2½ percentage points faster than otherwise would be the case. But because this is a one-time boost to household income, the step up in spending will be largely reversed out in ensuing quarters.
An additional 100-basis-point decline in the funds rate is likely despite the continued stickiness in inflation. Consumer and wholesale inflation readings in January were disappointing, and our latest forecast anticipates slightly higher core inflation this year. As long as inflation expectations remain anchored near current levels, however, the combination of soft demand, tight financial conditions, and falling home prices should produce a cooling in price pressures. The timetable for such a cooling probably will be deeper into the year than we previously envisioned. As key Fed officials continue to remind market participants, an unmooring of pricing attitudes could upend expectations of an easing in inflation. So, we will continue to monitor developments on this front closely.
Slow growth should contain inflation.
The course of global growth depends on financial conditions.
The Citi FCI has tightened despite Fed easing.
The fiscal package will provide a temporary boost.
6
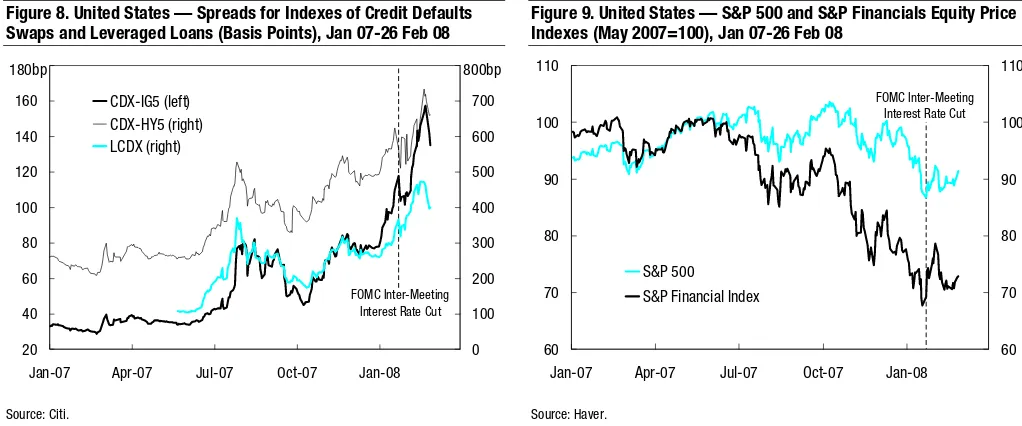
In recent days, however, financial markets have improved marginally in response to the likelihood that Fed officials will continue to pursue a risk-management approach to policy and hints that some regulators’ efforts may be reducing the probability of select risk outcomes (see Figures 8 and 9). Considerable additional improvement remains necessary.
The Euro Area Has Started to Slow
GDP growth in the euro area slowed markedly in late 2007, and confidence indicators suggest that the expansion remains somewhat below trend early this year, although not dramatically so. Still, the risks to the growth outlook remain on the downside, reflecting not only the global slowdown, but also, and more importantly, disappointing domestic consumption. Against a backdrop of less favorable labor market conditions, tighter lending standards suggest that a significant rebound of consumer outlays is less likely than before. The near-term inflation outlook is uncertain, as food and energy prices may rise further. However, medium-term price prospects remain favorable because the economic slowdown limits the risk of a rise in inflation expectations and wage growth. The European Central Bank (ECB) probably will keep official rates unchanged until near-term inflation and wage risks diminish. If inflation moderates rapidly starting in the second quarter and wages are contained, the ECB probably will lower rates this year, although not aggressively. The rise in the latest German ifo business survey will no doubt encourage ECB officials to consider that growth will not be far below potential.
Muted Impact on Japanese Economy
[image:6.612.62.568.485.688.2]Japan’s economic outlook remains relatively favorable and stable among the major industrialized countries. Real GDP grew a stronger-than-expected 3.7% annualized in the fourth quarter of 2007, driven by strong gains in exports and business investment. While exports will inevitably decelerate in 2008 in the context of the slower global economy, we still expect near or slightly above-trend growth this year. Trade statistics for January indicate that Japan’s exports remain on a solid upward track, driven by exports not bound for the United States. Moreover, negative effects from the
Figure 6. United States — Year-to-Year Percent Change in Imports and the Average of ISM New Orders and Imports (Six-Month Lag), 1996–Jan 08
Figure 7. United States — Nominal Final Domestic Demand (Year-to-Year Percent Change, Four-Quarter Lag) and Change in Two-Year Annualized Core CPI (Percent), 1990–Jan 08
-15 -10 -5 0 5 10 15 20 25 40 45 50 55 60 65 70
1996 1998 2000 2002 2004 2006 Growth of Imports (Left) Imports&Orders (Right) 25% 1 2 3 4 5 6 7 8 9
1990 1993 1996 1999 2002 2005 2008 -1.2 -0.8 -0.4 0.0 0.4 0.8 1.2 Final Demand (Left)
Core CPI (Right)
9% 1.2%
Sources: Institute for Supply Management and Bureau of Economic Analysis. Sources: Bureau of Economic Analysis and Bureau of Labor Statistics. Improved financial
conditions will be necessary to avoid the worst outcomes.
Risks to euro area growth are to the downside...
7 government’s economic policies — namely, the enforcement of the revised Building Standard Law and tax and social security burden hikes for the household sector — will diminish meaningfully or even reverse in 2008. Finally, financial conditions remain much more favorable than in other industrialized countries as damages to banks’ capital from subprime mortgage-related structured products have been limited.
Bank of Japan (BoJ) Governor Fukui will leave office on March 19. The government is scheduled to announce its proposal for the next governor and two deputy governors next week. Press reports suggest that Mr. Toshiro Muto, a current deputy governor, is likely to be nominated to replace Mr. Fukui. The basic thrust of monetary policy (that is, gradual rate hikes to more normal levels) will likely remain largely intact. While uncertainties surrounding the U.S. economy and global financial markets will likely continue to dissuade the BoJ from hiking rates until around the turn of this year, the next policy action will probably be a rate hike unless the domestic economy slows much more sharply than we now expect.
Strong Commodities Demand Is Boosting Some Industrial Countries
In contrast to developments in the major industrial economies, economic growth has remained resilient in a number of smaller industrialized economies that principally are leveraged to the boom in commodity prices, such as Australia. Indeed, many
commodity prices have continued to rise this year, especially energy-related commodities, iron ore, food, and some base metals, despite the marking down of prospects for global economic growth. The strength of commodity prices reflects ongoing supply bottlenecks and still rampant demand in China and emerging
economies generally. Against this backdrop, a deteriorating outlook for inflation forced both the Reserve Bank of Australia and the Riksbank to raise official interest rates in February, and we expect more monetary policy tightening in Australia and Norway, while the Reserve Bank of New Zealand is likely to maintain a tightening bias this year.
Strong Fundamentals Are Bolstering Many Emerging Economies...
Strong economic growth is likely to continue in emerging Asia, despite the weakening of the U.S. economy. However, Asia’s resilient growth is not because it has decoupled from the United States, but because it enjoys greater policy flexibility from improved macroeconomic fundamentals. China is likely to step up public-sector dominated spending on infrastructure and the resource sectors in the face of slowing exports. This could also happen in many other economies, including Korea, Hong Kong, Singapore, Thailand, the Philippines, and even Indonesia. This implies that, in the short term, while headline growth could moderate, Asian economies could become more dependent on investment. As a result, commodity demand intensity could increase.
Deteriorating global prospects, especially in the major economies, have so far had only a modest impact on Latin American economies. Growth remains generally strong, although somewhat slower than in 2007, and should remain above trend with a regional average of 4.4% for 2008. After a temporary selloff, currencies have strengthened, with the Brazilian real, Peruvian sol, and Colombian and Chilean pesos making new highs against the U.S. dollar in recent weeks.
China will appoint its new government for the next five years at the National People’s Congress meetings starting March 5. A new president just took office in Korea. In general, we do not expect these political changes to have a significant impact on The change in BoJ
leadership will not alter policy.
Rising commodity prices have helped some industrial economies.
Strong fundamentals have insulated some emerging economies...
8
economic policies. However, economic policies in Taiwan and Thailand could show significant improvement following the elections, generating an important
macroeconomic turnaround in these two sluggish economies.
However, financial stability remains a concern in a number of emerging European economies thanks to a sustained decline in risk appetite, together with concerns about the risks to net exports in the context of a slowdown in the Eurozone. The export shock will be felt most acutely in central Europe, particularly in Hungary, Czech Republic, and Slovakia, whose economies are highly dependent on exports, and whose recent growth rates have benefited considerably from Eurozone demand. Poland, by contrast, should be relatively insulated because it is a more closed economy reliant on domestic spending growth.
The decline in capital flows is naturally proving most painful to those economies heavily dependent on external financing: Romania, South Africa, and the Baltics are key examples. The clearest expression of risk aversion in these countries has been the continued rise in sovereign credit (particularly CDS) spreads. The rise in spreads has been noticeably large even in countries with very low public debt burdens like Kazakhstan (6% of GDP) or Romania (16% of GDP). In addition, currency volatility has increased in a number of countries, particularly in South Africa and Romania.
...But Inflation Remains a Concern
The decline in capital flows and the rise in exchange rate volatility complicate the inflation outlook in many countries, particularly in the context of higher global food prices. Interest rates are under upward pressure in South Africa, Romania, Hungary, the Czech Republic, Poland, and Egypt, among other countries. Our interest rate forecasts are subject to the risk that we have underestimated food price shocks in the region.
Inflation is also a key issue for many of the “surplus” economies, notably the Gulf Cooperation Council and Russia. For these economies it remains the case that currency appreciation will be the most reliable disinflationary tool. Policymakers remain fearful in many cases that stronger nominal exchange rates will hurt competitiveness. In time we expect this dilemma to be resolved mostly in favor of local currency revaluation against the dollar.
[image:8.612.51.562.503.716.2]Figure 8. United States — Spreads for Indexes of Credit Defaults Swaps and Leveraged Loans (Basis Points), Jan 07-26 Feb 08
Figure 9. United States — S&P 500 and S&P Financials Equity Price Indexes (May 2007=100), Jan 07-26 Feb 08
20 40 60 80 100 120 140 160 180
Jan-07 Apr-07 Jul-07 Oct-07 Jan-08
0 100 200 300 400 500 600 700 800 CDX-IG5 (left) CDX-HY5 (right) LCDX (right) FOMC Inter-Meeting Interest Rate Cut
180bp 800bp 60 70 80 90 100 110
Jan-07 Apr-07 Jul-07 Oct-07 Jan-08
60 70 80 90 100 110 S&P 500 S&P Financial Index
FOMC Inter-Meeting Interest Rate Cut
Source: Citi. Source: Haver.
Slowing exports may harm some emerging economies.
Reduced capital flows are hurting countries that rely on external financing.
Rates have risen in countries at risk to higher inflation.
9 Food inflation has become a key challenge in a number of economies, including China, Hong Kong, Singapore, Taiwan, and Vietnam. This has led to tightening monetary policies, including faster appreciation of Asian currencies, especially the Taiwanese dollar and Vietnamese dong. In other economies where inflation is less of a challenge, monetary policy easing is likely to continue following the Fed actions, especially in Thailand, the Philippines, and Korea. While inflation complicates macroeconomic policymaking, we think the chances of stagflation remain remote, as slowing activities should help ease inflation rates, especially core rates. But food prices could stay high in coming months, suggesting that tightening biases may continue in a number of
economies.
Given the high share of food in the typical CPI basket in Latin America, inflation pressures should remain a concern for most regional central bankers in the coming month. Interest rate markets reflect a lower risk of rate hikes in Brazil, and they are now pricing in cuts in Mexico. But the central banks of Chile, Colombia, and Peru remain under pressure to tighten further, as inflation rates continue to print well above their targets. Our current forecasts show the region shifting into a current account deficit of 0.2% of GDP in 2008 on the back of rapidly growing imports. However, we believe that sky-high commodity prices place our forecast at risk, and may lead to higher-than-expected reserves accumulation again this year.
Rising global food prices...
10
Figure 10. Forecast Overview, 2007-09F
GDP Growth CPI Inflation Current Balance (% of GDP) Fiscal Balance (% of GDP)
2007 2008F 2009F 2007 2008F 2009F 2007 2008F 2009F 2007 2008F 2009F
Global 3.9% 3.2% 3.3% 3.0% 3.7% 2.8% 0.2% 0.1% 0.1% -0.6% -1.3% -1.4%
Based on PPP weights 4.8 4.1 4.2 3.6 4.2 3.3 1.0 0.7 0.4 -0.7 -1.4 -1.5
Industrial Countries 2.5% 1.7% 2.0% 2.1% 2.6% 1.8% -1.5% -1.2% -0.7% -1.0% -1.9% -1.9%
United States 2.2 1.6 2.1 2.9 3.6 2.0 -5.4 -4.9 -4.1 -1.1 -3.0 -3.0
Japan 2.1 1.9 1.7 0.0 0.7 0.3 4.8 4.8 5.2 -2.8 -3.0 -3.1
Euro Area 2.6 1.7 1.8 2.1 2.3 1.8 0.2 0.2 0.3 -1.0 -1.3 -1.2
Canada 2.5 1.0 1.5 2.1 1.4 2.0 0.9 -0.2 -0.8 0.2 0.1 0.1
Australia 3.8 2.7 3.4 2.3 3.3 2.8 -5.9 -5.2 -5.2 1.6 1.3 1.5
Germany 2.6 1.6 1.9 2.1 1.8 1.6 6.6 6.8 6.8 0.0 -0.5 -0.7
France 1.9 1.6 1.6 1.5 2.2 1.4 -1.5 -1.7 -1.6 -2.6 -2.9 -2.8
Italy 1.6 0.8 1.4 2.2 2.5 1.8 -2.0 -1.5 -1.5 -2.3 -2.7 -2.9
Spain 3.8 2.1 2.2 2.7 3.4 2.3 -9.6 -8.9 -7.5 2.2 1.2 0.0
United Kingdom 3.1 1.7 1.9 2.3 2.5 2.0 -5.2 -4.5 -3.3 -3.0 -3.3 -3.5
Emerging Markets 7.2% 6.5% 6.4% 5.2% 6.1% 5.4% 4.6% 3.5% 2.3% 0.4% -0.1% -0.4%
China 11.4 10.5 10.0 4.8 5.0 4.0 10.8 8.8 7.0 -1.8 -2.0 -1.5
India 8.7 8.3 8.5 4.5 4.3 4.0 -1.2 -1.9 -1.8 -6.0 -5.8 -5.2
Korea 4.9 4.6 4.8 2.5 3.3 2.5 0.6 -1.3 -0.6 2.0 2.0 1.5
Poland 6.5 5.0 4.7 2.5 4.2 3.0 -3.7 -4.7 -4.6 -1.5 -2.1 -2.5
Russia 8.1 6.6 6.5 9.0 12.9 8.9 5.9 6.2 3.3 5.4 5.6 5.0
South Africa 5.1 3.5 4.3 7.1 6.1 5.4 -7.1 -7.7 -7.7 0.8 0.3 0.2
Turkey 3.8 4.2 5.2 8.8 7.8 6.5 -7.7 -8.3 -6.8 -2.2 -2.4 -3.2
Brazil 5.3 4.4 4.0 3.6 4.7 4.5 0.3 -0.6 -1.0 -1.4 -0.7 -0.4
Mexico 3.3 2.9 3.7 4.0 3.9 3.5 -0.9 -1.8 -2.3 0.0 0.0 0.0
Note: Aggregation based on nominal GDP except where noted. F Citi forecast. For India, inflation forecast is for WPI.
11
Key Economic Indicators
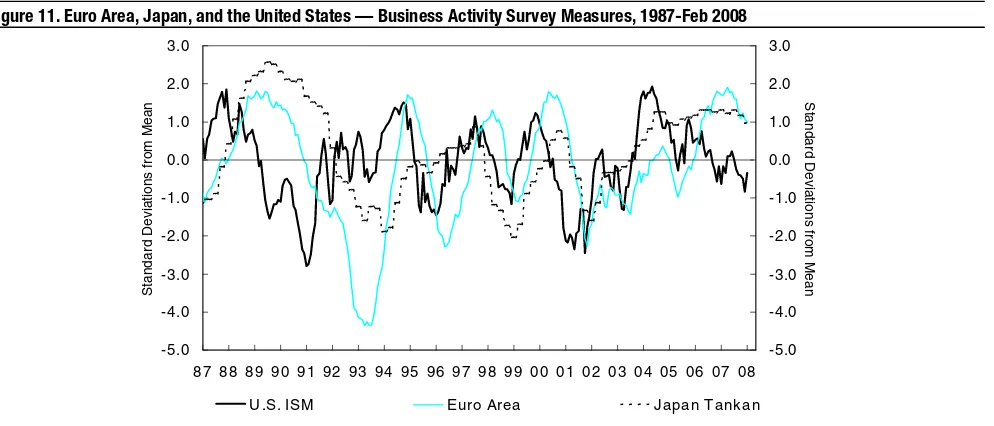
Figure 11. Euro Area, Japan, and the United States — Business Activity Survey Measures, 1987-Feb 2008
-5.0 -4.0 -3.0 -2.0 -1.0 0.0 1.0 2.0 3.0
87 88 89 90 91 92 93 94 95 96 97 98 99 00 01 02 03 04 05 06 07 08 -5.0 -4.0 -3.0 -2.0 -1.0 0.0 1.0 2.0 3.0
U .S. ISM Euro Area Japan Tankan
S tandar d D e v iati ons fr om Mean
d S
tandar d D e v iati ons fr om Mean
Note: The figure shows business activity survey indexes in the euro area, Japan and the United States, measured in units of standard deviations from the ten-year mean. Sources: Bank of Japan, EU Commission and the U.S. Institute for Supply Management.
Figure 12. Commodity Prices, 1987-Feb 2008
80 100 120 140 160 180 200 220 240
87 88 89 90 91 92 93 94 95 96 97 98 99 00 01 02 03 04 05 06 07 08 0 10 20 30 40 50 60 70 80 90 100 $ per Barrel
Economist Index (Left) Oil Prices (Right)
Note: Brent crude. Sources: The Economist and OECD.
Figure 13. Selected Countries — Global Industrial Production (Year-to-Year Percent Change), 2007-09F
2007 2008F 20009F
World 4.2% 3.5% 3.9%
United States 2.1 1.7 2.5
Japan 2.9 2.3 2.5
Euro Area 2.5 1.9 1.6
United Kingdom 0.3 0.8 0.8
Canada -0.1 -3.0 1.0
China 18.5 16.8 16.5
India 9.0 8.5 10.0
Korea 8.2 7.7 8.0
Brazil 3.0 4.8 4.2
Note: “World” includes 22 countries based on industrial production weights. Sources: National sources and Citi.
Figure 14. Euro Area, Japan, United Kingdom, and United States — Forecasts for 2008 GDP (Left) and 2008 Inflation (Right), 2006-Feb 2008.
0.5 1.0 1.5 2.0 2.5 3.0 3.5 4.0
Jan-06 Apr Jul Oct Jan-07 Apr Jul Oct Jan-08
0.5 1.0 1.5 2.0 2.5 3.0 3.5 4.0
U.S. Euro U.K. Japan
4.0% 4.0% -0.5 0.0 0.5 1.0 1.5 2.0 2.5 3.0 3.5 4.0
Jan-06 Apr Jul Oct Jan-07 Apr Jul Oct Jan-08
4.0% -0.5 0.0 0.5 1.0 1.5 2.0 2.5 3.0 3.5 4.0 4.0%
U.S. Euro U.K. Japan
12
Figure 15. Short Rates (End of Period), as of Feb 28, 2008
Current 1Q 08 2Q 08 3Q 08 4Q 08 1Q 09
United States 3.00 % 2.50 % 2.00 % 2.00 % 2.00 % 2.00 %
Japan 0.50 0.50 0.50 0.50 0.75 0.75
Euro Area 4.00 4.00 3.75 3.50 3.50 3.50
Canada 4.00 % 3.50 % 3.00 % 3.00% 3.00% 3.00%
Australia 7.00 7.25 7.50 7.50 7.50 7.50
New Zealand 8.25 8.25 8.25 8.25 8.25 8.25
Denmark 4.25 % 4.25 % 4.00 % 3.75% 3.75% 3.75%
Norway 5.25 5.25 5.50 5.50 5.75 5.75
Sweden 4.25 4.25 4.25 4.25 4.00 3.75
Switzerland 2.75 2.75 2.75 2.75 2.75 2.75
United Kingdom 5.25 5.25 4.75 4.50 4.25 4.25
China 7.47 % 7.74 % 7.74 % 7.74 % 7.74 % 7.74 %
[image:12.612.64.534.232.410.2]Source: Citi.
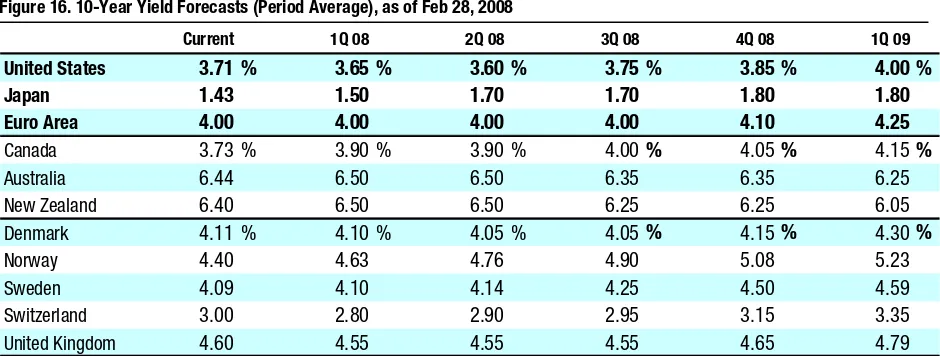
Figure 16. 10-Year Yield Forecasts (Period Average), as of Feb 28, 2008
Current 1Q 08 2Q 08 3Q 08 4Q 08 1Q 09
United States 3.71 % 3.65 % 3.60 % 3.75 % 3.85 % 4.00 %
Japan 1.43 1.50 1.70 1.70 1.80 1.80
Euro Area 4.00 4.00 4.00 4.00 4.10 4.25
Canada 3.73 % 3.90 % 3.90 % 4.00% 4.05% 4.15%
Australia 6.44 6.50 6.50 6.35 6.35 6.25
New Zealand 6.40 6.50 6.50 6.25 6.25 6.05
Denmark 4.11 % 4.10 % 4.05 % 4.05% 4.15% 4.30%
Norway 4.40 4.63 4.76 4.90 5.08 5.23
Sweden 4.09 4.10 4.14 4.25 4.50 4.59
Switzerland 3.00 2.80 2.90 2.95 3.15 3.35
United Kingdom 4.60 4.55 4.55 4.55 4.65 4.79
[image:12.612.65.540.445.655.2]Notes: Bond yields measured on local market basis (semi-annual for the United States, United Kingdom, Canada, Australia, and New Zealand; annual for the rest). The 10-year yield for the euro area is the Bund yield. Source: Citi.
Figure 17. 10-Year Yield Spreads (Period Average), as of Feb 28, 2008
Current 1Q 08 2Q 08 3Q 08 4Q 08 1Q 09 Current 1Q 08 2Q 08 3Q 08 4Q 08 1Q 09
United States NA NA NA NA NA NA -20 bp -21 bp -21 bp -11 bp -21 bp -21 bp
Japan -241 bp -229 bp -209 bp -219 bp -209 bp -224 bp -261 -250 -230 -230 -230 -245
Euro Area 20 21 21 11 21 21 NA NA NA NA NA NA
Canada -13 bp 15 bp 15 bp 15 bp 20 bp 15 bp -23 bp -6 bp -6 bp 4 bp -1 bp -6 bp Australia 259 275 275 250 250 225 245 261 261 245 235 210 New Zealand 263 275 275 240 240 205 249 261 261 235 225 189 France 32 bp 33 bp 31 bp 20 bp 29 bp 29 bp 12 bp 12 bp 10 bp 9 bp 8 bp 8 bp
Italy 61 61 59 46 56 54 41 40 38 35 35 33
Spain 34 36 35 25 33 31 14 15 14 14 12 10
Netherlands 29 30 29 18 27 27 9 9 8 7 6 6
Belgium 47 46 39 27 36 34 27 25 18 16 15 13 Denmark 31 bp 31 bp 26 bp 16 bp 26 bp 26 bp 11 bp 10 bp 5 bp 5 bp 5 bp 5 bp Norway 55 84 97 101 119 119 56 63 76 90 98 98
Sweden 24 31 35 36 61 55 10 10 14 25 40 34
Switzerland -84 -99 -89 -94 -74 -69 -104 -120 -110 -105 -95 -90 United Kingdom 85 80 80 70 80 79 65 60 60 60 60 60
NA Not applicable. Note: Spreads calculated on annual basis (except those of the United Kingdom, Canada, Australia and New Zealand over the United States). Source: Citi.
13 Figure 18. Foreign Exchange Forecasts (End of Period), as of Feb 28, 2008
Current Mar-08 Jun-08 Sep-08 Dec-08 Mar-09 Current Mar-08 Jun-08 Sep-08 Dec-08 Mar-09
United States NA NA NA NA NA NA 1.51 1.51 1.53 1.51 1.48 1.45
Japan 106 105 105 109 112 112 160 159 161 165 166 162
Euro Area 1.51 1.51 1.53 1.51 1.48 1.45 NA NA NA NA NA NA
Canada 0.98 1.01 1.02 1.03 1.04 1.04 1.48 1.53 1.56 1.56 1.54 1.51
Australia 0.94 0.92 0.95 0.92 0.90 0.88 1.60 1.64 1.61 1.64 1.64 1.65
New Zealand 0.81 0.80 0.78 0.76 0.75 0.73 1.86 1.89 1.96 1.99 1.97 1.99
Norway 5.20 5.07 4.84 4.83 4.90 4.97 7.87 7.65 7.40 7.30 7.25 7.20
Sweden 6.20 6.16 5.95 6.03 6.22 6.41 9.37 9.30 9.10 9.10 9.20 9.30
Switzerland 1.06 1.06 1.04 1.03 1.03 1.03 1.60 1.60 1.59 1.56 1.52 1.50
United Kingdom 1.98 1.97 1.96 1.95 1.92 1.93 0.76 0.77 0.78 0.77 0.77 0.75
China 7.11 7.06 7.00 6.90 6.75 6.55 10.8 10.7 10.7 10.7 10.0 9.5
India 39.9 39.0 38.5 38.0 37.5 37.0 60.3 58.9 58.9 57.4 55.5 53.7
Korea 938 960 960 940 920 870 1418 1450 1469 1419 1362 1262
Poland 2.33 2.34 2.42 2.44 2.42 2.43 3.52 3.53 3.70 3.68 3.58 3.52
Russia 24.1 24.2 23.9 24.1 24.3 24.6 36.4 36.5 36.6 36.3 36.0 35.7
South Africa 7.56 7.70 7.90 8.10 8.00 8.10 11.43 11.63 12.09 12.23 11.84 11.75
Turkey 1.18 1.22 1.24 1.27 1.29 1.32 1.79 1.84 1.90 1.92 1.91 1.91
Brazil 1.67 1.79 1.80 1.80 1.80 1.85 2.52 2.70 2.75 2.72 2.66 2.68
Mexico 10.7 10.8 10.9 11.0 11.0 11.0 16.2 16.3 16.7 16.6 16.2 16.0
vs USD vs EUR
Source: Citi.
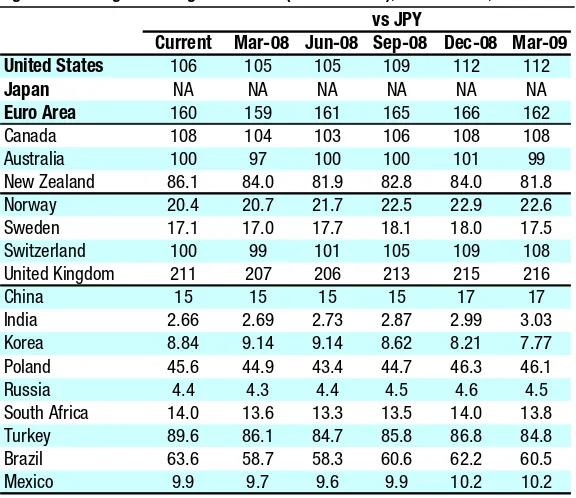
Figure 19. Foreign Exchange Forecasts (End of Period), as of Feb 28, 2008
Current Mar-08 Jun-08 Sep-08 Dec-08 Mar-09
United States 106 105 105 109 112 112
Japan NA NA NA NA NA NA
Euro Area 160 159 161 165 166 162
Canada 108 104 103 106 108 108
Australia 100 97 100 100 101 99
New Zealand 86.1 84.0 81.9 82.8 84.0 81.8
Norway 20.4 20.7 21.7 22.5 22.9 22.6
Sweden 17.1 17.0 17.7 18.1 18.0 17.5
Switzerland 100 99 101 105 109 108
United Kingdom 211 207 206 213 215 216
China 15 15 15 15 17 17
India 2.66 2.69 2.73 2.87 2.99 3.03
Korea 8.84 9.14 9.14 8.62 8.21 7.77
Poland 45.6 44.9 43.4 44.7 46.3 46.1
Russia 4.4 4.3 4.4 4.5 4.6 4.5
South Africa 14.0 13.6 13.3 13.5 14.0 13.8
Turkey 89.6 86.1 84.7 85.8 86.8 84.8
Brazil 63.6 58.7 58.3 60.6 62.2 60.5
Mexico 9.9 9.7 9.6 9.9 10.2 10.2
vs JPY
[image:13.612.64.352.362.611.2]14
Currency Outlook
With the depth of the near-term deceleration of the U.S. economy still in doubt, and financial conditions continuing to deteriorate, we expect downward pressure on the U.S. dollar to persist in coming months. The dollar downtrend should, however, remain modest. Aggressive action by the Federal Reserve should help to stabilize financial conditions and prospects for growth in coming quarters. In addition, the outlook for growth in the euro area appears to be deteriorating, and this change in cyclical outlooks should eventually turn the tide on USD/EUR.
The USD will likely depreciate modestly relative to the Japanese yen in the first half of 2008. Japan appears to be the least affected by the money and credit market strains among the major economies and should benefit from any further heightened risk
aversion. However, we expect the JPY to start weakening against the USD in the second half of the year. As global economic and financial risks wane, in part thanks to policy actions in major countries, Japanese households are likely to resume diversifying their portfolios into foreign currency denominated assets, weighing down the yen.
We continue to expect the British pound to be one of the weakest of the G10 currencies in 2008. While markets currently are discounting an easing cycle, we expect growth is likely to undershoot MPC forecasts, thus opening up scope for an extended easing cycle, even with the short-term inflation worries.
Led by the renminbi, emerging Asian currencies continued to gain ground during the past month. A broad pickup in inflation has generated incentives for central banks across the region to tolerate greater exchange rate flexibility — especially for the Taiwanese dollar and Vietnamese dong. We continue to expect emerging Asian currencies to lead the next leg of U.S. dollar weakness. However, we also warn against excessive optimism regarding the outlook of Asian currencies, given that the expected slowing in exports will likely add caution to currency policymaking. We maintain our expectation of 7.5% renminbi appreciation against the USD, which is less aggressive than market expectations.
We continue to favor the AUD among commodity currencies. Markets could be surprised by the extent to which the Reserve Bank of Australia (RBA) tightens monetary policy in coming months. We project a tightening of at least 50 basis points by May. Indeed, further tightening beyond that could be required to ensure inflation returns to the 2%-3% target zone. Along with rising interest rates, gains in key Australian commodity prices, as indicated by the recent 65% price rise in iron ore exports to Japan for the coming financial year, should continue to provide the AUD with fundamental support.
In the near term, the NZD should remain in a range, as the Reserve Bank of New Zealand (RBNZ) holds monetary policy steady, balancing the inflation risks from higher dairy prices and a tight labor market against clear signs of a slowdown in the housing sector. The CAD is also likely to remain range-bound in the near term, with some modest retreat from parity amid a slowing Canadian economy, ongoing financial market strains, and tighter credit conditions. While the BoC is now expected to lower policy rates by 100 basis points by midyear, this will only match the expected easing in the United States. As a result, continued commodity price strength and the weak U.S. economic outlook argue against a meaningful depreciation of the CAD.
The Swiss franc (CHF) has been a star performer so far this year, rising about 4% in trade-weighted terms, and it is likely to remain strong. Markets have scaled back the amount of Swiss National Bank (SNB) easing priced in for the second and third quarters, as the economy holds up better than expected and inflation remains above the Stephen Halmarick
15 SNB’s 2% target ceiling. Therefore, the SNB will likely keep rates on hold in coming months, unless the CHF rises more sharply. The outlook for the CHF also should be reinforced by the currency’s longstanding safe-haven status, with a strong and positive correlation between equity market volatility and the trade-weighted CHF.
While the Norges Bank has recently expressed concerns about money market strains and heightened global economic uncertainty, we still expect further monetary policy tightening to combat inflation risks amid heightened capacity pressures and
accelerating wages. Oil prices are a double-edged sword for the NOK. Recent high prices have supported the NOK, but the sharp rise over the past year also raises the risk of a correction. In Sweden, the Riksbank is expected to keep rates steady near term, following the surprise rate hike in February. The next move is likely to be a cut around yearend to offset the negative effects from the credit crisis and weakening U.S. and global economic growth. But interest rate spreads remain in the SEK’s favor. Also, while periods of financial instability normally do not favor the SEK, the SEK should strengthen again once the dust settles in financial markets.
Currencies across CEEMEA continue to feel the effects of conflicting forces. Amid ongoing financing concerns, currencies of external deficit countries such as South Africa and Romania remain under pressure relative to the EUR. Inflationary pressures across the region, however, continue to put upward pressure on domestic interest rates, providing some support to currencies of countries with better economic prospects, including Poland, Israel, and Slovakia. Slovakia is also experiencing capital inflows in anticipation of a revaluation of the koruna’s central parity against the EUR next quarter as part of the euro-adoption process. Hungary, by abandoning its band, reversed much of its January selloff.
[image:15.612.169.553.466.671.2]Latin American currencies have so far shown no vulnerability to deteriorating global prospects. In fact, with the United States cutting rates and commodity prices making new highs, Latin currencies have continued to appreciate. Inflationary challenges in Chile, Peru, and Colombia will likely keep those central banks vigilant, with a bias toward maintaining a hawkish discourse, and possibly even hiking rates. Rate cuts are likely in Mexico, but not until September, given the likelihood that yearly inflation will increase above the top of Banxico’s band during most of the second quarter.
Figure 20. Currency Recommendations, as of Feb 28, 2008
Current
3-Month Forecast
Annual Return vs
FWD Implied Vol.
12-Month Forecast
Annual Return vs
FWD Implied Vol.
United States NA NA NA NA NA NA NA
Japan 106 105 1.9 10.7 112 -7.2 9.6
Euro Area 1.51 1.52 4.1 9.1 1.46 -2.1 8.8
Canada 0.98 1.02 -14.4 11.6 1.04 -5.2 10.9 Australia 0.94 0.94 3.5 13.1 0.89 -0.7 12.7 New Zealand 0.81 0.80 -6.3 14.8 0.74 -3.6 14.8 Norway 5.20 4.92 25.3 12.2 4.94 8.2 11.8 Sweden 6.20 6.02 13.0 11.8 6.35 -0.5 11.3 Switzerland 1.06 1.05 4.7 10.0 1.03 2.7 9.0 United Kingdom 1.98 1.96 -1.7 8.6 1.93 -0.4 8.5 China 7.11 7.02 -5.2 3.4 6.62 -2.2 4.9 India 39.9 38.7 12.7 6.0 37.2 7.7 6.4 Korea 938 960 -8.8 5.3 887 6.0 4.9 Poland 2.33 2.39 -7.6 11.0 2.43 -0.7 10.5 Russia 24.1 24.0 3.7 5.9 24.5 1.4 6.7 South Africa 7.56 7.83 -5.5 19.6 8.07 2.2 19.3 Turkey 1.18 1.23 -3.9 14.1 1.31 1.9 16.2 Brazil 1.67 1.80 -23.7 13.6 1.83 -2.6 14.6 Mexico 10.7 10.9 -2.3 5.3 11.0 1.6 6.6
16
Global Equity Strategy
Our economics colleagues now forecast recessionary conditions in the United States. What have previous U.S. recessions meant for global corporate earnings and stock prices and what are the implications for the current situation?
Earnings Impact
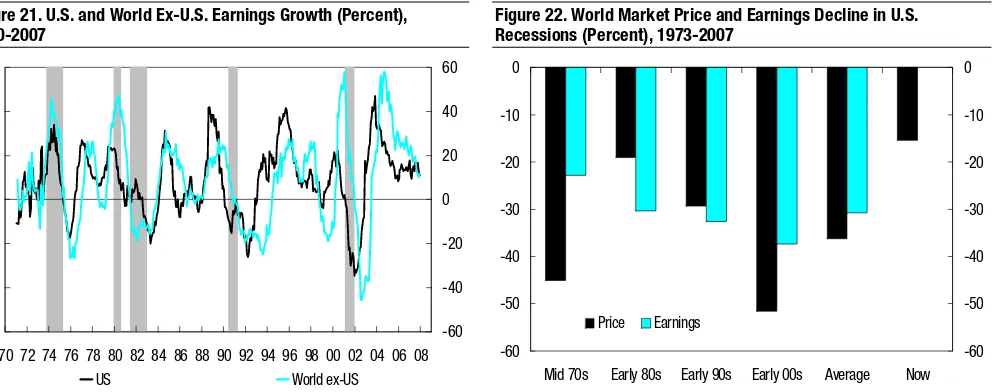
Figure 21 plots U.S. and world ex-U.S. trailing earnings growth for the listed corporate sector, with shaded regions denoting U.S. recessions. Given reporting delays, earnings will tend to lag the economic data, so this series does not yet reflect the recent earnings collapse among financials.
Earnings are much more volatile than real GDP given the impact of financial and operational leverage. For example, annual U.S. earnings growth has ranged from -40% to +40% over a period when real U.S. GDP growth has ranged between -3% and +8%. Although GDP seems to have become less volatile, corporate earnings have become more volatile. There is no sign of the “great moderation” here. Figure 21 also shows that world ex-U.S. earnings growth tracks U.S. earnings closely but with even greater volatility recently. The key message is clear. U.S. recessions have been bad
news for the United States and world earnings.
In the past, U.S. recessions have been associated with contractions of at least 20% in both U.S. and world ex-U.S. earnings. To put this into context, the IBES consensus expects U.S. and global earnings growth of 14% and 13%, respectively, in 2008. So, investors should prepare themselves for a period of earnings downgrades.
U.S. Recessions and Global Equities
If the United States is heading into recession, the outlook for global corporate earnings looks bleak. What does that mean for share prices?
Figure 22 shows that, on average, global earnings have fallen by 31% around U.S. recessions. Share prices have fallen by slightly more (36%). As for the current
[image:16.612.69.565.486.682.2]situation, the 15% share price decline from last July’s high suggests that, even though earnings are only just starting to roll over, global equities are already halfway through
Figure 21. U.S. and World Ex-U.S. Earnings Growth (Percent), 1990-2007
Figure 22. World Market Price and Earnings Decline in U.S. Recessions (Percent), 1973-2007
-60 -40 -20 0 20 40 60
70 72 74 76 78 80 82 84 86 88 90 92 94 96 98 00 02 04 06 08 -60 -40 -20 0 20 40 60
US World ex-US
-60 -50 -40 -30 -20 -10 0
Mid 70s Early 80s Early 90s Early 00s Average Now -60 -50 -40 -30 -20 -10 0
Price Earnings
Note: Shaded regions denote recession. Sources: MSCI and Datastream. Sources: MSCI and Datastream. Robert Buckland
011-44-20-7986-3947 robert.buckland
17 the selloff associated with a typical U.S. recession and are rapidly approaching the mild correction seen in the early 1980s (19%).
Valuations
Could it be that the recent fall in prices has already priced a U.S. recession into global equities? It seems that the bear market associated with the last U.S. recession was as severe as it was because global equities traded at a record 35 times PE heading into the worst earnings slump in 40 years. Now, global equities trade on a much more reasonable 15 times trailing PE, similar to valuations at the bottom of the early 1990s correction. Even if earnings do fall significantly, current valuations look reasonable.
We also point out that global equities entered each of the last two recessions with a major valuation bubble. In 1990, Japan traded on a PE of 52 times. In 2000, global Technology (TMT) traded on a PE of 65 times. Both accounted for around 40% of the total global market cap and then bore the brunt of the subsequent selloff. This spared the rest of the global equity market from the worst of the pain. It is difficult to point to any such obvious major valuation anomalies this time round. Emerging markets have performed strongly, but they are hardly in bubble territory.
Interest Rates
Thus, the current valuation case in favor of global equities is better than it was during the last recession but still probably not enough to counter the impact of major
earnings downgrades. Perhaps it is still too early to buy back into equities — stick with defensive cash and government bonds instead.
But there is a problem with this defensive strategy — interest rates are already low. U.S. real rates have gone negative much earlier than in the early 1980s, 1990s, or 2000s downturns. Not only do negative real rates help to reduce the severity of the U.S. recession, but they also undermine the attractiveness of cash as an asset class. The other obvious place to take refuge is government bonds. But value here also looks poor.
Market Timing
How do global equities perform around a U.S. recession? Previously, the worst performance through the whole period has been in the first half. The best performance has been during the second half. What about now? We start the clock ticking from January of this year. History suggests that the recession will last around a year. It also suggests that investors should not be in too much of a hurry to buy. Falling rates and increasingly attractive valuations are not enough to counter the rising wave of bad economic and earnings news in the first half of the recession. At least the selloff this year is already approaching the average selloff for the first half, although it is still far from the worst.
18
Figure 23. Long-Term Forecasts (Calendar Average), as of Feb 28, 2008
GDP CPI Short-Term Interest Rates
2008 2009 2010 2011 2012 2008 2009 2010 2011 2012 2008 2009 2010 2011 2012
United States 1.6% 2.1% 2.7% 2.7% 2.7% 3.6% 2.0% 2.0% 2.0% 2.0% 2.35% 2.00% 3.50% 4.25% 4.25%
Japan 1.9 1.7 2.0 2.0 1.2 0.7 0.3 0.5 0.6 2.3 0.56 0.88 1.38 1.75 2.00
Euro Area 1.7 1.8 2.0 2.0 2.0 2.3 1.8 1.8 1.8 1.8 3.65 3.50 3.75 3.75 3.75
Canada 1.0 1.5 2.2 2.4 2.5 1.4 2.0 2.0 2.1 2.1 3.15 3.00 3.25 3.50 3.50
Australia 2.7 3.4 3.5 3.3 3.3 3.3 2.8 2.5 2.5 2.5 7.45 7.05 6.00 5.50 5.50
New Zealand 2.1 2.0 3.0 3.0 3.0 2.8 2.4 2.3 2.3 2.3 8.25 7.80 7.00 6.75 6.50
Germany 1.6 1.9 2.1 1.7 1.7 1.8 1.6 1.6 1.5 1.5
France 1.6 1.6 2.0 2.3 2.3 2.2 1.4 1.6 1.6 1.5
Italy 0.8 1.4 1.2 1.3 1.2 2.5 1.8 1.9 1.8 1.7
Spain 2.1 2.2 2.1 2.2 2.1 3.4 2.3 2.4 1.7 1.8
Norway 4.0 3.0 2.5 2.5 2.5 3.4 2.5 2.5 2.5 2.5
Sweden 2.3 2.2 2.3 2.3 2.3 3.4 2.3 2.1 2.1 2.0
Switzerland 2.2 2.0 2.2 2.0 1.9 1.5 0.8 1.1 0.8 0.8 2.90 3.00 3.00 3.00 3.00
United Kingdom 1.7 1.9 2.6 2.8 2.9 2.5 2.0 2.2 1.9 2.1 4.75 4.30 4.90 5.00 5.25
China 10.5 10.0 10.5 9.8 9.0 5.0 4.0 4.2 3.5 4.0 7.7 7.7 8.0 8.0 8.3
India 8.3 8.5 8.7 9.5 9.5 4.3 4.0 4.0 4.0 3.5 6.0 6.0 6.0 5.5 5.5
Korea 4.6 4.8 4.8 4.8 4.8 3.3 2.5 2.5 2.5 2.5 4.9 5.0 5.2 5.3 5.3
Poland 5.0 4.7 5.2 5.9 5.5 4.2 3.0 2.3 2.5 2.7 5.5 5.5 5.5 5.5 5.5
Russia 6.6 6.5 6.5 6.5 6.6 12.9 8.9 7.0 5.9 4.8 11.0 9.5 8.3 7.5 6.8
South Africa 3.5 4.3 5.3 5.1 5.5 6.1 5.4 5.5 5.0 5.2 10.3 8.9 9.0 9.3 9.0
Turkey 4.2 5.2 5.8 6.0 6.2 7.8 6.5 5.1 4.5 4.2 16.3 13.8 11.1 10.0 9.2
Brazil 4.4 4.0 4.0 4.0 4.0 4.7 4.5 4.1 4.0 3.7 11.3 10.5 9.8 9.3 8.5
Mexico 2.9 3.7 4.1 3.8 4.3 3.9 3.5 3.2 3.1 3.1 7.3 6.5 6.5 6.5 6.5
19 Figure 24. Long-Term Forecasts (Calendar Average), as of Feb 28, 2008
Ten-Year Yields Exchange Rate vs. U.S. Dollar Exchange Rate vs. Euro
2008 2009 2010 2011 2012 2008 2009 2010 2011 2012 2008 2009 2010 2011 2012
United States 3.75% 4.25% 4.75% 5.00% 5.00% NA NA NA NA NA 1.50 1.45 1.47 1.50 1.52
Japan 1.68 1.90 2.50 2.75 2.25 108 110 100 95 95 162 160 147 143 144
Euro Areaa 4.05 4.40 4.40 4.40 4.40 1.50 1.45 1.47 1.50 1.52 NA NA NA NA NA
Canada 3.91 4.41 4.75 4.90 4.90 1.04 1.06 1.08 1.13 1.15 1.56 1.54 1.59 1.70 1.75
Australiab 6.35 6.40 6.75 6.50 6.50 0.92 0.87 0.82 0.78 0.78 1.63 1.67 1.79 1.92 1.95
New Zealandc 6.35 6.30 6.75 6.75 6.75 0.77 0.72 0.69 0.66 0.65 1.95 2.01 2.13 2.27 2.34
Denmark 4.10 4.45 4.45 4.45 4.45 NA NA NA NA NA NA NA NA NA NA
Norway 4.85 5.30 5.20 5.10 5.10 4.99 5.00 4.90 4.74 4.61 7.48 7.25 7.21 7.11 7.01
Sweden 4.25 4.65 4.65 4.65 4.65 6.13 6.31 6.16 6.00 5.92 9.20 9.15 9.05 9.00 9.00
Switzerland 3.20 3.50 3.50 3.50 3.50 1.04 1.11 1.10 1.08 1.06 1.56 1.61 1.62 1.62 1.61
United Kingdomd 4.75 5.10 5.10 5.10 5.10 1.95 1.93 2.10 2.17 2.20 0.77 0.75 0.70 0.69 0.69
Chinae 4.1 4.0 4.5 5.0 5.5 6.98 6.35 5.89 5.58 5.40 10.5 9.2 8.7 8.4 8.2
India 7.3 7.5 7.5 7.0 7.0 38.5 36.0 35.0 33.0 31.0 57.8 52.2 51.5 49.5 47.1
Koreae 4.9 5.2 5.5 5.5 5.5 950 890 850 800 800 1425 1291 1250 1200 1216
Poland 5.9 5.7 5.5 5.5 5.4 2.41 2.43 2.32 2.21 2.12 3.61 3.52 3.42 3.32 3.22
Russia 6.6 6.7 6.6 6.6 6.5 24.0 24.5 24.4 24.2 24.0 36.0 35.5 35.9 36.2 36.4
South Africa 8.0 8.1 8.7 9.0 9.3 7.37 8.00 8.20 8.55 8.90 11.05 11.60 12.05 12.83 13.53
Turkey NA NA NA NA NA 1.26 1.34 1.34 1.34 1.34 1.90 1.94 1.97 2.00 2.04
Brazil 10.7 9.7 9.4 9.1 9.0 1.79 1.88 1.93 1.98 2.03 2.69 2.72 2.83 2.96 3.08
Mexico 7.4 7.1 7.2 7.2 7.2 10.9 11.0 11.1 11.3 11.5 16.3 15.9 16.3 17.0 17.5
a
Ten-year bund yield. Exchange rate versus U.S. dollar shows US$/€€. b US$/A$. c
US$/NZ$. d US$/£. e
Five-year bond yield.
20
United States
Recessionary conditions may be unfolding in the U.S. economy as the slowdown appears to be spreading with reinforcement from harsh financial conditions. Policy efforts have aided liquidity, but credit availability has tightened and lower rates have failed to ease strains on capital markets. With housing activity still declining and joblessness creeping higher, headwinds are forming against a timely and sustained return to trend growth despite a prospective boost from recent fiscal action.
Given the threat of an especially adverse dynamic, Fed officials have turned more aggressive, and are expected to lower the funds rate by another percentage point by midyear. Nonetheless, any end to rate cuts would likely first require some improvement in the financial setting, reflected in a revival of risk assets and signs that large overhanging imbalances in housing markets are beginning to clear.
Economic growth appears to have stalled, reflecting slowdowns in consumer and business spending and continued sharp declines in homebuilding. Although many industries exhibit solid finances and have not overreached in recent years, business caution has increased, mirroring the pronounced retreat in risk appetites among financial markets. Lower equity prices are threatening to compound pressures on consumers from declining home values and faltering job growth.
[image:20.612.54.559.413.655.2]The improvement in inflation measures has stalled, but continued Fed easing indicates that officials still see scope for easing price pressures later this year. Oncoming financial restraint on demand along with rising slack and protracted housing weakness should impose stiff competitive pressures on firm pricing. As long as inflation expectations remain checked in this setting, we expect underlying inflation to recede somewhat, aiding policy flexibility and shortening recession.
Figure 25. United States — Economic Forecast, 2007-09F
2007 2008
2007F 2008F 2009F 2Q 3Q 4Q 1QF 2QF 3QF 4QF
GDP SAAR 3.8% 4.9% 0.6% -0.1% 0.9% 3.0% 2.2% YoY 2.2% 1.6% 2.1% 1.9 2.8 2.5 2.3 1.6 1.1 1.5
Consumption SAAR 1.4 2.8 2.0 0.6 0.6 3.5 1.2
YoY 2.9 1.6 1.8 2.9 3.0 2.5 1.7 1.5 1.7 1.5 Business Investment SAAR 11.0 9.3 7.5 0.3 -1.2 -0.3 0.3
YoY 4.8 3.0 0.7 4.1 5.1 7.4 7.0 3.9 1.5 -0.2 Housing Investment SAAR -11.8 -20.5 -23.9 -23.9 -15.4 -6.4 -1.6
YoY -16.9 -17.9 -0.2 -16.5 -16.5 -18.3 -20.2 -21.0 -17.7 -12.2 Government SAAR 4.1 3.8 2.6 -1.2 1.4 1.7 2.0
YoY 2.1 1.5 1.7 1.9 2.7 2.5 2.3 1.6 1.1 1.0
Exports SAAR 7.5 19.1 3.9 4.9 5.1 5.6 5.1
YoY 7.9 6.7 5.5 7.1 10.3 7.7 8.7 8.1 4.9 5.2 Imports SAAR -2.7 4.4 0.3 0.3 -1.2 2.1 -0.8
YoY 2.0 0.5 1.8 2.0 1.7 1.4 0.5 0.9 0.4 0.1 CPI YoY 2.9 3.6 2.0 2.7 2.4 4.0 4.2 3.7 3.6 2.8 Core CPI YoY 2.3 2.5 2.0 2.3 2.1 2.3 2.5 2.6 2.5 2.4 Unemployment Rate % 4.6 5.4 5.9 4.5 4.7 4.8 5.1 5.3 5.6 5.7 Govt Balance (Fiscal Year) % of GDP -1.1 -3.0 -3.0 — — — — — — — Assumed WTI Spot Price US$ 72.3 91.6 89.2 65.0 75.5 90.9 93.2 91.6 91.0 90.4 Current Account US$bn -751 -693 -607 -756 -714 -748 -743 -700 -682 -647
% of GDP -5.4 -4.8 -4.1 -5.5 -5.1 -5.3 -5.3 -4.9 -4.7 -4.4 S&P 500 Profits (US$ Per Share) YoY -1.7 -0.6 5.0 9.4 -5.7 -19.2 -9.7 -11.5 1.8 22.4
Notes: F Citi forecast. YoY Year-to-year percent change. SAAR Seasonally adjusted annual rate.
Sources: Bureau of Economic Analysis, Bureau of Labor Statistics, I/B/E/S, Treasury Department, Wall Street Journal, and Citi. Robert V. DiClemente
(1-212) 816-9894 robert.diclemente @citi.com
21
Japan
We expect Japan’s economic growth to stabilize near the potential growth rate of the economy (slightly below 2%) this year after a bumpy ride in 2007. Last year, higher input costs including energy costs, the resulting deterioration in the profit outlook for small firms, and the enforcement of the revised Building Standard Law temporarily distorted economic growth. However, real GDP advanced at an annualized 3.7% in the fourth quarter, reflecting strong export and business investment growth.
Major demand components are likely to expand. Private consumption will likely maintain modest but stable expansion on somewhat higher income growth in 2008. Business investment likely will increase amid capacity shortages and healthy profits at large firms, but investment at small firms should be soft. The negative impact of the revised Building Standard Law on housing has already come to an end. Finally, exports are likely to maintain slower but solid growth because Japan’s exports are now much more diversified than in the past. For example, exports to oil-producing countries alone are pushing up overall exports by almost three percentage points. Exports to Asia will likely slow gradually as the negative impact of the U.S. slowdown dampens growth in the region.
Underlying inflation will likely remain low in 2008. While year-to-year changes in core CPI are expected to reach the 1% mark in coming months, this is mostly attributable to surging energy and manufactured food prices. Core inflation adjusted for energy and food will likely remain low against the backdrop of near-trend growth and persistent declines in unit labor costs. Core inflation probably will slip again to about 0.3% by the end of 2008.
[image:21.612.55.566.453.701.2]We expect the next rate hike by the Bank of Japan (BoJ) to be delayed until the end of 2008 or early 2009. Continued uncertainties surrounding the U.S. economy and global financial markets, combined with ambiguity regarding domestic growth prospects, will likely continue to dissuade the BoJ from raising policy rates until after the release of its October economic outlook. BoJ Governor Fukui will step down in March, but the basic thrust of monetary policy (that is, policy normalization) will be maintained.
Figure 26. Japan — Economic Forecast, 2007-09F
2007 2008
2007F 2008F 2009F 2Q 3Q 4Q 1QF 2QF 3QF 4QF
Real GDP YoY 2.1% 1.9% 1.7% 1.7% 1.9% 1.8% 1.4% 2.2% 2.3% 1.9% SAAR -1.4 1.3 3.7 2.0 2.0 1.5 2.0 Domestic Demand YoY 1.0 1.2 1.4 0.7 0.8 0.4 0.2 1.2 1.7 1.6
SAAR -1.9 -0.7 2.1 1.5 1.8 1.5 1.7 Private Consumption YoY 1.5 1.0 1.3 1.1 2.0 1.1 0.8 0.9 1.1 1.1
SAAR 0.7 0.5 0.8 1.0 1.3 1.2 1.0 Business Investment YoY 2.5 4.2 2.5 0.4 0.7 2.1 3.0 5.3 5.2 3.1
SAAR -6.0 4.5 12.1 2.1 2.9 4.0 3.4 Housing Investment YoY -9.3 0.4 4.8 -3.0 -11.4 -21.4 -13.5 -5.0 6.1 17.8 Public Investment YoY -2.3 -4.6 -3.3 -1.9 1.0 -1.8 -7.0 -4.7 -3.3 -3.3 Exports YoY 8.7 6.6 4.2 7.9 8.6 10.8 8.5 8.2 5.8 3.9
SAAR 4.6 12.1 12.1 5.5 3.3 2.4 4.3 Imports YoY 1.7 1.9 3.0 1.4 1.5 1.9 1.4 1.5 2.3 2.6
SAAR 2.2 -0.5 1.9 2.0 2.5 2.9 2.9 Core CPI YoY 0.0 0.7 0.3 -0.1 -0.1 0.4 0.9 0.8 0.7 0.5 Nominal GDP YoY 1.3 1.4 1.8 1.2 1.1 0.7 0.3 1.5 1.8 2.0 Current Account ¥ tn 25.0 25.0 27.9 26.1 24.9 26.3 26.1 25.2 23.8 24.8
% of GDP 4.8 4.8 5.2 5.1 4.8 5.1 5.0 4.8 4.5 4.7 Unemployment Rate % 3.9 3.9 3.7 3.8 3.8 3.9 3.9 3.9 3.9 3.8 Industrial Production YoY 2.9 2.3 2.5 2.3 2.7 2.8 3.0 3.4 1.7 1.2
Corporate Profits (Fiscal Year) YoY 6.0 4.0 5.0 General Govt. Balance (Fiscal Year) % of GDP -2.8 -3.0 -3.1
F Citi forecast. SAAR Seasonally adjusted annual rate. YoY Year-on-year percentage change. Corporate profits are TSE-I non-financials consolidated recurring profits. Source: Citi. Kiichi Murashima
22
Euro Area
Our GDP growth forecast continues to inch down, following the deterioration in retail sales and many confidence indicators in late 2007 and early this year. The economy entered into a period of slightly subtrend growth, which will extend at least into the third quarter. In addition to worsening global growth prospects, the downward revisions to GDP growth — and the persistence of downside risks — mainly reflect the disappointing performance of consumer spending in recent months. Tightening financial conditions, aggravated since last summer by rising risk premia and the impact of higher food prices on real incomes, is weighing on consumer outlays across the euro area. We also look for slowing export demand and a correction from the tax-induced rise in business fixed investment in Germany.
Unfavorable base effects and the late-2007 jump in food prices are proving more protracted than expected. Headline inflation probably will remain above 2% until late 2008, assuming these prices recede only gradually. Despite some well-publicized sizable pay deals, signs of broad-based wage acceleration are absent, and worsening labor market conditions reduce the probability of a major upturn. The strong euro also is limiting import price inflation. Thus, we still expect inflation to settle below 2% late this year and in 2009, but this forecast is subject to relatively high uncertainty.
[image:22.612.43.559.438.685.2]Following the admission that downside risks to growth are materializing, the ECB has opened the door for an eventual rate cut if inflation starts to slow and wage restraint prevails. The ECB probably will maintain its key policy rate at 4% for now, but we expect some easing later this year, probably by 50 basis points, with a first 25-basis-point cut in the second quarter. The ECB staff’s new economic projections (to be released on March 6) likely will downgrade GDP growth this year to somewhat below trend and keep the 2009 inflation projection below target. This combination would be an indication that the ECB is ready to lower rates if activity indicators continue to weaken in coming months.
Figure 27. Euro Area — Economic Forecast, 2007-09F
2007 2008F
2007F 2008F 2009F 2Q 3Q 4QF 1Q 2Q 3Q 4Q
Real GDP YoY 2.6% 1.7% 1.8% 2.5% 2.6% 2.2% 1.7% 1.7% 1.4% 1.6% SAAR 1.2 2.9 1.7 1.1 1.1 1.8 2.4 Final Domestic Demand YoY 2.2 1.6 1.8 2.2 2.3 1.8 1.6 1.6 1.5 1.8 Private Consumption YoY 1.4 1.4 1.5 1.5 1.6 1.0 1.5 1.3 1.2 1.6 Government Consumption YoY 1.9 1.5 1.4 2.0 2.1 1.7 1.4 1.5 1.4 1.8 Fixed Investment YoY 4.8 2.3 2.9 4.2 4.3 3.6 2.1 2.6 2.2 2.3
- Business Equipment YoY 5.1 1.7 2.8 4.3 4.9 4.9 2.8 2.2 1.2 0.6 - Construction YoY 4.5 2.9 2.8 4.2 3.7 2.5 1.5 3.1 3.3 3.8 Stocks (contrib. to GDP) YoY -0.1 0.1 0.0 -0.4 -0.2 0.2 0.0 0.2 0.1 0.1 Exports YoY 6.1 4.0 4.7 5.8 7.3 4.8 4.7 4.2 3.2 3.7 Imports YoY 5.3 4.3 4.9 4.8 5.9 4.3 4.1 4.8 3.7 4.5 CPI YoY 2.1 2.3 1.8 1.9 1.9 2.9 3.0 2.3 2.1 1.7 Core CPI YoY 2.0 1.9 1.8 1.9 2.0 2.3 2.3 1.9 1.8 1.6 Unemployment Rate (s.a.) % 7.4 7.3 7.3
Current Account Balance €€ bn 15 15 25
% of GDP 0.2 0.2 0.3
General Gov’t Balance €€ bn -90 -115 -115 % of GDP -1.0 -1.3 -1.2
Public Debt % of GDP 68.0 67.8 67.3
Gross Operating Surplus YoY 6.4 4.0 4.5
Oil Prices (Brent) $/barrel 72.6 94.1 91.1
F Citi forecast. SAAR Seasonally adjusted annual rate. YoY Year-to-year growth rate. The annual forecasts for GDP and its components are consistent with the quarterly (seasonally and work-day adjusted) figures. Sources: Eurostat, national government sources, and Citi.
23
Euro Area
Germany
While German consumption disappointed again at the end of 2007, recent activity and confidence data suggest solid growth in the manufacturing sector. With ongoing job creation and rising wages, we continue to forecast a modest recovery in private
consumption in 2008. However, we do not expect excessive wage gains that would be a threat to price stability. The recently negotiated 5% wage gain in the steel sector probably will not be the pattern for other sectors, although there is a chance that public sector trade unions will get a big increase from their 8% wage claim. With the shift to the left in the recent state elections, the grand coalition probably will ease fiscal policy somewhat and is unlikely to implement structural reforms before the 2009 general election.
France
The moderation in French GDP growth at the end of 2007 was in line with expectations, but final domestic demand surprised to the upside due to a pickup in capital spending growth. Buoyant construction activity is likely to boost investment growth at the beginning of 2008, but tighter financing conditions probably will lead to moderation in the rest of the year. However, the plunge in consumer confidence suggests that private consumption growth is likely to moderate further in early 2008. Furthermore, sluggish export growth probably will cap GDP growth in 2008. As the French government is unlikely to find support for
undermining the value of the euro, President Nicolas Sarkozy’s administration probably will have to ease fiscal policy to keep growth from moderating, which could lead to further deterioration of the government’s public support.
Italy
Italian GDP growth probably sank into negative territory in the fourth quarter, prompting us to lower our 2008 forecast to well below trend. The expansion continues to
[image:23.612.51.555.514.704.2]underperform that of the euro area, reflecting worsening export performance and weak consumption. Political uncertainty — the government had to call snap elections after losing a confidence vote — is also making a dent in business and consumer confidence, and has virtually eliminated the chances of new reforms in the near term. The 2008 budget proposal was less ambitious than that of 2007. The implementation of the welfare accord is postponed, fiscal consolidation is diluted, and spending cuts are delayed. On a positive note, unemployment reached a record low in 2007.
Figure 28. Germany, France, and Italy — Economic Forecast, 2007-09F
Germany France Italy
2007F 2008F 2009F 2007F 2008F 2009F 2007F 2008F 2009F
Real GDP YoY 2.6% 1.6% 1.9% 1.9% 1.6% 1.6% 1.6% 0.8% 1.4% Final Domestic Demand YoY 1.2 1.0 1.4 2.3 1.8 2.0 1.7 1.2 1.3 Private Consumption YoY -0.5 1.0 1.2 2.0 1.6 1.9 1.8 0.8 1.4 Fixed Investment YoY 5.3 1.1 2.6 3.9 3.0 3.1 2.9 2.3 2.2 Exports YoY 8.0 5.2 6.0 2.7 1.1 2.8 2.1 0.6 3.2 Imports YoY 5.0 4.0 5.9 3.6 2.1 3.7 2.3 1.5 2.9 CPI YoY 2.1 1.8 1.6 1.5 2.2 1.4 2.2 2.5 1.8 Unemployment Rate % 8.4 7.8 7.6 8.1 8.0 8.0 6.0 6.1 6.1 Current Account bn 160.8 170.8 174.3 -23.5 -28.3 -30.3 -30.5 -25.0 -25.0
% of GDP 6.6 6.8 6.8 -1.5 -1.7 -1.6 -2.0 -1.5 -1.5 General Govt. Balance bn 0.4 -12.7 -17.6 -48.2 -55.8 -55.5 -35.7 -43.5 -48.0
% of GDP 0.0 -0.5 -0.7 -2.6 -2.9 -2.8 -2.3 -2.7 -2.9 General Govt. Debt % of GDP 62.7 61.3 60.6 66.8 67.6 68.1 104.5 103.0 102.4 Gross Trading Profits YoY 6.9 3.5 6.5 4.1 2.6 3.8 5.0 3.5 3.6
F Citi forecast. YoY Year-to-year growth rate. Note: The German annual figures are derived from quarterly Bundesbank data, and thus, adjusted for working days. The forecasts for GDP and its components are calendar adjusted. Sources: Deutsche Bundesbank, Statistisches Bundesamt, and Citi.
Jürgen Michels (44-20) 7986-3294 juergen.michels @citi.com
Jürgen Michels (44-20) 7986-3294 juergen.michels @citi.com
24
Euro Area: Others
Spain
Spanish GDP growth remained surprisingly strong at 0.8% in the fourth quarter (not annualized). However, a number of activity indicators declined sharply in December and January, suggesting a significant loss of momentum, particularly of domestic demand. Residential construction continues to moderate and probably will be a drag on overall GDP growth later this year. Higher mortgage rates, which impinge on elevated household indebtedness, also are limiting spending power by consumers. On the favorable side, exports remain relatively dynamic (especially to emerging markets). In addition, the government achieved a budget surplus of 2.2% of GDP last year, providing some room for the automatic stabilizers to cushion the economic downturn and, perhaps, for some
expansionary measures after the March 9 elections.
Benelux
Thanks to a strong increase in net exports, Dutch GDP growth surprised again on the upside in the fourth quarter. Furthermore, consumption accelerated at the end of last year, and ongoing job creation, in combination with some wage acceleration, is likely to support consumption in 2008. However, private consumption growth will be overstated this year by about one-half percentage point due to reform of the public health plan. Facing tighter financial conditions, investment growth is likely to slow and exports should moderate. In Belgium, the government crisis has not had substantial negative repercussions for the economy so far. While the interim government has managed to propose a 2008 budget, targeting a balanced position, the country’s large parties made some progress in reforming the constitution. However, if these talks fail, the political crisis probably will escalate again at the end of March.
Finland
[image:24.612.46.554.525.683.2]The pace of Finnish growth is expected to ease further this year, in line with the global growth slowdown, as consumer demand is capped by intensifying price pressures and less stimulus from the housing market. The tight labor market is fueling wage pressures, suggesting upside inflation risks. The government will continue to strive for a prudent fiscal policy stance, with the focal point being an improvement of long-term growth prospects via enhanced job creation and tax cuts. However, high pay increases in recent wage agreements pose a minor setback to planned income tax cuts.
Figure 29. Spain, Belgium, the Netherlands, and Finland — Economic Forecast, 2007-09F
Spain Belgium The Netherlands Finland
2007F 2008F 2009F 2007F 2008F 2009F 2007F 2008F 2009F 2007F 2008F 2009F
Real GDP YoY 3.8% 2.1% 2.2% 2.6% 1.7% 1.9% 3.5% 2.8% 1.8% 4.3% 2.5% 2.9% Final Dom. Demand YoY 4.4 2.4 1.6 2.8 2.1 2.3 2.9 2.5 1.7 3.7 3.2 2.3 Public Consumption YoY 5.1 4.5 4.4 1.7 1.8 1.8 2.9 2.0 1.6 1.5 1.7 1.4 Private Consumption YoY 3.1 1.8 1.7 2.5 1.9 1.9 2.1 2.4 1.2 3.9 3.3 2.6 Investment (excl. Stocks) YoY 6.3 2.3 2.3 5.0 2.9 3.8 4.9 3.3 2.9 5.3 4.4 2.4 Exports YoY 5.3 4.1 4.0 4.6 4.2 3.7 6.4 4.6 3.7 6.2 4.5 4.9 Imports YoY 6.6 4.5 3.9 4.9 4.6 4.2 5.6 4.7 3.9 3.5 4.1 3.8 CPI (Average) YoY 2.7 3.4 2.3 1.8 2.6 1.8 1.6 2.1 2.5 2.5 2.8 2.1 Unemployment Rate % 8.1 8.4 8.8 7.5 7.2 7.1 4.6 4.5 4.5 6.8 6.3 6.0 Current Account % of GDP -9.6 -8.9 -7.5 3.0 2.5 2.4 7.6 7.3 7.2 6.1 5.7 5.4 General Govt. Balance % of GDP 2.2 1.2 0.0 -0.2 -0.3 -0.3 -0.2 0.2 0.7 4.4 4.5 4.3 General Govt. Debt % of GDP 37.3 35.8 34.4 83.7 80.0 77.9 45.7 43.5 41.0 36.5 34.0 33.0
F Citi forecast. YoY Year-on-year growth rate. The forecasts for GDP and its component