69
VOTING OF ARTIFICIAL NEURAL NETWORK
PARTICLE SWARM OPTIMIZATION BICLASSIFIER
USING GAIN RATIO FEATURE SELECTION
a
Fetty Tri Anggraeny,
bMonica Widiasri
aTeknik Informatika Universitas Pembangunan Nasional “Veteran” Jawa Timur
Jl. Raya Rungkut Madya Gunung Anyar Surabaya Indonesia a
Universitas Surabaya Jawa Timur Jl. Raya Kalirungkut Surabaya Indonesia
E-Mail: [email protected]
Abstrak
Seleksi fitur merupakan tahapan penting dalam proses klasifikasi. Proses ini menganalisa data (fitur) sehingga menghasilkan fitur yang berperan atau kurang berperan dalam proses klasifikasi. Fitur yang kurang berperan dapat tidak digunakan dalam proses klasifikasi. Peranan sebuah fitur dalam klasifikasi dapat dikalkulasi dengan suatu rumusan, dalam penelitian ini digunakan metode gain ratio untuk mendapatkan bobot atribut dalam proses klasifikasi. Gain ratio pengembangan dari information gain yang digunakan untuk membangun pohon keputusan (decision tree). Metode seleksi fitur gain ratio menggunakan pendekatan seleksi fitur filter, karena dilakukan terlepas dari mesin klasifikasi. Mesin klasifikasi yang digunakan adalah Artificial Neural Network Particle Swarm Optimization (ANNPSO), dimana mesin ini menggabungkan konsep kecerdasan buatan saraf manusia (neural networks) dengan kecerdasan hewan (particle swarm intelligence). Metode yang diusulkan akan diuji coba terhadap 3 dataset UCI, antara lain iris, breast Wisconsin dan dermatology. Uji coba dengan variasi nilai batas gain ratio fitur menunjukkan nilai akurasi yang cukup tinggi terhadap 3 dataset yaitu 97,6%, 96,41%, dan 99,29%.
Kata kunci: Gain Ratio, klasifikasi suara terbanyak, ANNPSO biclassifier..
Abstract
Feature selection is an important step in classification process, it analyze the data (features) resulting role each features in the classification process. The role of a feature in the classification can be calculated with a formula, in this research the gain ratio method is used to get the attribute/feature weights. Gain ratio is the development of information gain. Information gain is used to form the induction of decision tree (ID3). Gain ratio feature selection method using the filter feature selection approach, as is done separately from classification engine. Classification engine used is Voting of Artificial Neural Network Particle Swarm Intelligence (ANNPSO) Biclassifier, where this engine combines the concept of artificial intelligence human nerve (neural network) with animal intelligence (particle swarm intelligence). The proposed method is tested on three datasets of UCI, including iris, breast wisconsin and dermatology. Trials with the variation of the boundary gain ratio feature showed a high accuracy of the three datasets are 97.6%, 96.41%, and 99.29%.
INTRODUCTION
In the classification process require analyze features of the object. If a data object has a lot of features, the classification engine will need more time to create a dividing line between classes. Feature selection is used as a preprocessing stage classification that aims to reduce the dimension of the features. So we can know which from a series of features are strong features or weak features.
Feature selection in previous studies Fetty [1] is a biclass adaptive feature selection discriminant ratio (between 2 pair classes). If there are n classes, then we get n*(n-1)/2 sets of features. Each pair of classes has a different set of features that identify a feature weight in the data belonging to a particular class.
In this research will be applied one feature selection process for all classes, aim to improve the overall classification accuracy of classification. Same classification method, Voting of Artificial Neural Network Particle Swarm Intelligence (ANNPSO) Biclassifier, is used in Fetty [1].
VOTING OF ARTIFICIAL NEURAL
NETWORK PARTICLE SWARM
OPTIMIZATION BICLASSIFIER
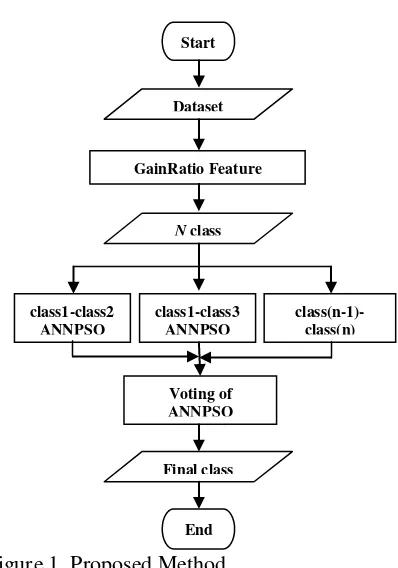
The overall research methodology can be seen in Figure 1. Start from dataset input, then the feature selection using the software WEKA 3-6-9. Output of WEKA is used as the basis of features rank and will be used in the classification engine Voting of ANNPSO Biclassifier. Classification engine that is formed in the first running time is n*(n-1)/2, each assigned to a class. Since there are some classification engines, it would require a vote to determine the final class of each data by a majority vote.
Iris, breast wisconsin, and dermatology dataset are used in this research, datasets from UCI database [2]. The characteristics of each dataset can be seen in Table 1.
Table 1. Dataset characteristic [2].
Dataset feature class ∑ data
Iris 4 3 150
Breast Wisconsin 9 2 699
Dermatology 34 15 366
Figure 1. Proposed Method.
Result of feature selection using WEKA 3.6.9 for each dataset can be seen in Figure 2, Figure 3, and Figure 4.
Figure 2. Result of Feature Selection for Iris Dataset.
Feature Selection
Feature selection is divided into two approaches, namely the wrapper approaches and filter approaches [3]. Filter approach of feature selection is done separately with classification engine, or in other words, the selection of features is used as a data preprocessing before it is input into the classification engine. Some methods of filter approach of feature selection are gain ratio [3], particle swarm intelligence (PSO) [4,5], differential evolution [6], etc.
=== Attribute Selection on all input data === Search Method: Attribute ranking.
Attribute Evaluator (supervised, Class (nominal): 5 class): Gain Ratio feature evaluator
Ranked attributes: 0.871 4 petalwidth 0.734 3 petallength 0.381 1 sepallength 0.242 2 sepalwidth Selected attributes: 4,3,1,2 : 4
Start
GainRatio Feature Selection using WEKA
N class
class1-class2 ANNPSO
class1-class3 ANNPSO
class(n-1)-class(n)
Voting of ANNPSO
Final class
Figure 3. Result of Feature Selection for Breast Wisconsin Dataset.
Classification engine will be trained and tested with feature set, if the addition of a feature lowers the accuracy, then it will be remove from feature set. The engine will process feature set and not use the other feature that will weaken the accuracy of the system. For example some methods in this approach are Ant Colony Optimization (ACO) [7], Sequential Forward Floating Selection (SFFS) [8], etc.
Based on this description, it appears that the filter approach is much simpler than the filter wrapper approach. In addition, the time required to filter approach is faster than the wrapper approach. But by using a wrapper approach, the classification engine will be optimized based on the features.
In this research, we used filter approach and use WEKA 3.6.9 with Gain Ratio Evaluator (WEKA) as feature selection stage [9].
Feature Selection Gain Ratio
Decision tree is a tree structure where each node represents the internal features and external node (leaf) represents the data class.
The greater the information gain, the greater role of the feature in determining the output produced bias, information gain prefers
features with many variations of feature values rather than pick a bit of variety though more informative value [3].
Figure 4. Result of Feature Selection for Dermatology Dataset.
For example, a unique feature in the data such as student_id in the student table database. Separation using student_id make very large partitions, because each data record has a unique value which the student_id [10].
Suppose S is the set of data samples and m with the conclusion classi.
For instance, A has value as v variation. Sij example is the number of samples in a class Ci and subset Sj. Sj comprised of samples in S that have value aj of A. So entropy based on the
=== Attribute Selection on all input data === Search Method: Attribute ranking.
Attribute Evaluator (supervised, Class (nominal): 35 class): Gain Ratio feature evaluator
Ranked attributes:
0.7715 31 perifollicular_parakeratosis
0.7254 27 vacuolisation_and_damage_of_basal_layer 0.7237 33 band-like_infiltrate
0.7221 6 polygonal_papules
0.7111 29 saw-tooth_appearance_of_retes 0.7094 12 melanin_incontinence
0.7019 15 fibrosis_of_the_papillary_dermis 0.6829 25 focal_hypergranulosis
0.6741 8 oral_mucosal_involvement 0.628 30 follicular_horn_plug
0.6012 22 thinning_of_the_suprapapillary_epidermis 0.5919 20 clubbing_of_the_rete_ridges
0.5303 21 elongation_of_the_rete_ridges 0.5297 34 Age
0.527 7 follicular_papules
0.438 9 knee_and_elbow_involvement 0.4291 24 munro_microabcess 0.3993 10 scalp_involvement 0.3707 28 spongiosis 0.3251 14 PNL_infiltrate 0.325 16 exocytosis
0.3171 26 disappearance_of_the_granular_layer 0.2941 23 spongiform_pustule
0.2911 11 family_history 0.2674 5 koebner_phenomenon 0.1978 3 definite_borders 0.1769 2 scaling 0.1687 19 parakeratosis
0.1599 13 eosinophils_in_the_infiltrate 0.1491 4 itching
0.098 1 erythema 0.0959 18 hyperkeratosis 0.0833 17 acanthosis
0.0598 32 inflammatory_monoluclear_inflitrate Selected attributes:
31,27,33,6,29,12,15,25,8,30,22,20,21,34,7,9,24,10,28,14,16, 26,23,11,5,3,2,19,13,4,1,18,17,32 : 34
=== Attribute Selection on all input data === Search Method: Attribute ranking.
Attribute Evaluator (supervised, Class (nominal): 10 Class): Information Gain Ranking Filter
Ranked attributes:
0.675 2 Cell_Size_Uniformity 0.66 3 Cell_Shape_Uniformity 0.564 6 Bare_Nuclei
0.543 7 Bland_Chromatin 0.505 5 Single_Epi_Cell_Size 0.466 8 Normal_Nucleoli 0.459 1 Clump_Thickness 0.443 4 Marginal_Adhesion 0.198 9 Mitoses
division into subsets of attributes A is shown in shown in Equation (3).
Gain(A)I(S)E(A) (3) C4.5 uses the gain ratio by applying normalization to information gain with the value obtained from Equation (4).
Si S
Si S
Gain ratio is calculated using the formula from Equation (5).
GainRatio(A)Gain(A)/SplitInfo(S) (5)
Attribute with the highest gain value ratio was selected as the separator attribute (splitting attribute).
ANNPSO BICLASSIFIER
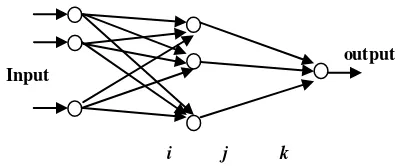
This research used a classification engine Artificial Neural Network optimized with Particle Swarm. ANNPSO Biclassifier is ANNPSO which classify the data into two classes. If the dataset has n classes and n>2, it will form n*(n-1)/2 ANNPSO Biclassifier [1], see Table 2.
Table 2. ANNPSO Biclassifier each dataset.
Dataset ∑ class ∑ANNPSO Biclassifier
Iris 3 3 number of features used in classification, there is only one output node because it is used to distinguish between two classes (class 0 and class 1). PSO is used to fix the tissue weight to minimum classification error, with 40 particles.
Evaluation Criteria
The classifier in this research, ANNPSO Biclassifier, is a function that given an instance and assign it to one of target class [10]. Using confusion matrix, we get four set results, they are true positive (TP), false negative (FN), true negative (TN), and false positif (FP).
Figure 5. Topology of ANNPSO Biclassier.
An instance is counted as TP if it is positive and it is classified as positive. An instance is counted as FN if it is positive and it is classified as negative. An instance is counted as TN if it is negative and it is classified as
Table 3. Characteristic of Gain Ratio Dataset.
Dataset
Breast Wisconsin 0.4450 0.198 0.675
dermatology 0.4255 0.0598 0.7715
RESULT AND DISCUSSION
Table 3 displays the average value, minimum and maximum gain ratio of each dataset. We did two test scenarios:
a. Scenario 1, the classification engine trial conducted with a variety values of limitRank. Features with gain ratio greater or equal to limitRank are used as input data of ANNPSO biclassifier. The trial will result in a comparison of accuracy and computational time with variation values of limitRank.
b. Scenario 2, comparing the proposed method with previous research [1, 11, 12].
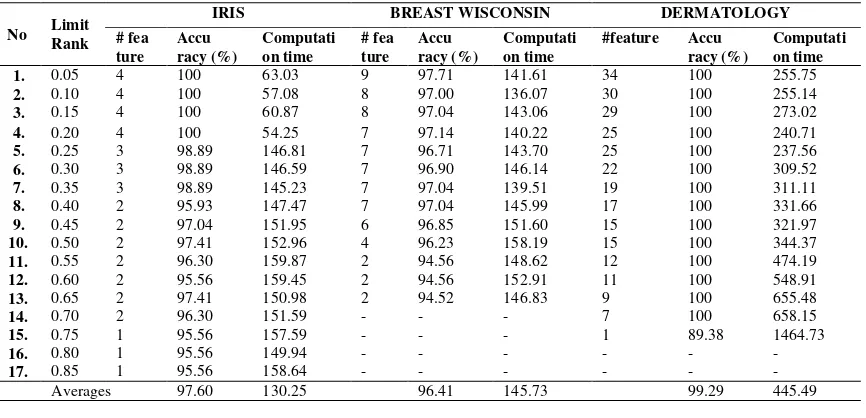
Based on Table 4, the petal width feature in iris dataset is very dominant. This is shown by the value of the classification accuracy of the engine using only these features is quite high is 95.56% ( see lines 15-17, Table 4 column accuracy of iris dataset). While the dermatology dataset, use 1 feature with the highest gain value ratio is good enough in accuracy, with accuracy 89.38% . This is because the value of the gain ratio between the features of the 4th and 3rd in the iris dataset has a considerable margin, 0.137 % (obtained from 0.871 minus 0.734). While dermatology dataset, 7 (seven) features with the highest gain ratio values has small margin, averaging about 0.01%. While the breast-w dataset generally has decreased accuracy with greater limitRank value, but the difference in accuracy between the use of all the features and feature only differs at least slightly, 3.19%. While the iris dataset and dermatology are 4.44 % and 10.62%.
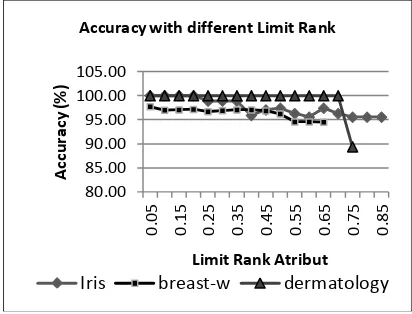
Figure 6 shows that the accuracy of dermatology dataset fallen sharply, while the iris dataset and breast-w gradually decreased accuracy. Computing time are relative equal to accuracy (see Figure 7). Dermatology dataset with 1 feature needs more time caused
classification engine difficult to reach convergence.
The second scenario, carried out with the aim of knowing the accuracy of the proposed method and previous studies [1, 11, 12]. Table 5 shows that the proposed method in general has better accuracy than previous methods except on MLPANN [10]. Based on the tests that have been conducted, the proposed method in general can improve the accuracy.
CONCLUSION
Based on test has been done can be concluded that the proposed method has a high enough degree of accuracy by using some of the features with the highest value of gain ratio. Computation time required with a small number of features is lower than using large number of features, this is because the process of gaining weight with minimum error configuration requires more iterations.
Classification accuracy by using features that has gain ratio greater than 0.5 is worth 95% for 3 test dataset. This already indicates that limitRank 0.5 can be used as the minimum threshold gain ratio features in classification process. In addition, the computational time required is not too long for 3 datasets about 3.64 minutes.
Table 4. Averages of accuracy and computation time.
No Limit Rank
IRIS BREAST WISCONSIN DERMATOLOGY
# fea ture
Accu racy (%)
Computati on time
# fea ture
Accu racy (%)
Computati on time
#feature Accu racy (%)
Computati on time 1. 0.05 4 100 63.03 9 97.71 141.61 34 100 255.75
2. 0.10 4 100 57.08 8 97.00 136.07 30 100 255.14
3. 0.15 4 100 60.87 8 97.04 143.06 29 100 273.02
4. 0.20 4 100 54.25 7 97.14 140.22 25 100 240.71
5. 0.25 3 98.89 146.81 7 96.71 143.70 25 100 237.56
6. 0.30 3 98.89 146.59 7 96.90 146.14 22 100 309.52
7. 0.35 3 98.89 145.23 7 97.04 139.51 19 100 311.11
8. 0.40 2 95.93 147.47 7 97.04 145.99 17 100 331.66
9. 0.45 2 97.04 151.95 6 96.85 151.60 15 100 321.97
10. 0.50 2 97.41 152.96 4 96.23 158.19 15 100 344.37
11. 0.55 2 96.30 159.87 2 94.56 148.62 12 100 474.19
12. 0.60 2 95.56 159.45 2 94.56 152.91 11 100 548.91
13. 0.65 2 97.41 150.98 2 94.52 146.83 9 100 655.48
14. 0.70 2 96.30 151.59 - - - 7 100 658.15
15. 0.75 1 95.56 157.59 - - - 1 89.38 1464.73
16. 0.80 1 95.56 149.94 - - - -
17. 0.85 1 95.56 158.64 - - - -
Averages 97.60 130.25 96.41 145.73 99.29 445.49
Table 5. Averages o f Accuracy.
Dataset Proposed Method ANNPSO-AFS Biclass [1] PSO [10] MPLANN[10] PSOLDA[11]
Iris 97.6% 98.05% 94.74% 100% 97%
Breast-w 96.41% 99.9% 96.51% 97.07% 96.5%
Dermatology 99.29% 86.01% 93.92% 96.74% 98.4%
Figure 6. Accuracy with Different LimitRank Artificial Neural Network,” in Proceedings of Bali International Seminar on Science and Technology, Denpasar, 2011.
[2] C.L. Blake, C.J. Merz, University of California. University of California at Irvine Repository of Machine Learning Databases. [online]. Available http://www.ics.uci.edu/mlearn/MLReposit ory.html [Accessed : August 2011].
[3] A. G. Karegowda, A. S. Manjunath, M. A. Jayaram, “Comparative Study of Attribute Selection Using Gain Ratio Correlation based feature selection,” International Journal of Information Technology and Knowledge Management, vol. 2, no. 2, pp. 271-277, 2010.
[4] C.L. Huang, J.F. Dun, “A distributed PSO–SVM hybrid system with feature selection and parameter optimization,” Applied Soft Computing, vol.8, pp. 1381– 1391, 2008.
[5] H. C. Yang, S. B. Zhang, K. Deng, P. Du,
“Research into a Feature Selection Method for Hyperspectral Imagery Using PSO and SVM,” Journal of China University of Mining & Technology, vol. 17, no. 4, pp. 0473–0478, 2007.
[6] K. Rami, A. Ahmed, A. Adel, “Feature subset selection using differential evolution and a statistical repair mechanism,” Expert Systems with
Applications, vol. 38, no. 9, pp. 11515– 11526, 2011.
[7] K. H. Rashidy, F. Karim, “An improved feature selection method based on ant colony optimization (ACO) evaluated on face recognition system,” Applied Mathematics and Computation, vol. 205, no. 2, pp. 716–725, 2008.
[8] L. T. Warren, “Feature Extraction and Selection from Acoustic Emission Signals with an Application in Grinding Wheel Condition Monitoring,” Engineering Applications of Artificial Intelligence, vol. 23, no.1, pp. 74–84, 2010. Selection Techniques for High Dimensional Data”, Masters Theses, Western Kentucky University, 2012.
[11]F. I. De, C. A. Della, E. Tarantino,
“Facing Classification Problems with Particle Swarm Optimization,” Applied Soft Computing, vol. 7, no. 3, pp. 652– 658, 2007.
[12]S. W. Lin, S. Chen, “PSOLDA: A particle Swarm Optimization Approach for Enhancing Classification Accuracy Rate of Linear Discriminant Analysis,” Applied Soft Computing, vol. 9, no. 3, pp.1008– Accuracy with different Limit Rank
Iris breast-w dermatology
0 Computatiton time with different Limit
Rank