Critical Success Factor (CFA) for Palm Plantation
Land Suitability Oil Using PCA
Rahmad Abdillah1, Siska Kurnia Gusti2
Teknik Informatika, Fakultas Sains & Teknologi, Universitas Islam Negeri Sultan Syarif Kasim Riau Jl. H.R. Soebrantas Km. 15 Panam Pekanbaru, Telp. 0761-8359937
1
[email protected], 2 [email protected]
Abstract
Pelalawan Regency has more than 380 hectares of oil palm plantation areas with 42 private managing companies. Determining the suitability of land and climate will affect the oil palm plantations and the quality that will be produced. The PCA (Principal Component Analysis) method is used to process 8 criteria consisting of temperature, rainfall, irradiation, humidity, C-Organic, H2O pH, into the soil and Slope. The source of the data used comes from agencies that manage the land and climate of Pelalawan Regency, Riau Province. Existing data is processed and analyzed against 8 criteria to determine the most dominant factors. Based on the results of the research conducted, the priority criteria for planting oil palm are soil depth, rainfall, organic matter, H2O pH, slope, irradiation, humidity and temperature. Therefore, recommendations from this study will be further developed for land and climate suitability classifications for plant oil palm.
Keywords: Climate, Land, Palm Oil, PCA, Significant Factor
1. Introduction
In Pelalawan Regency, land evaluation for the oil palm plantation use is conducted after the areas has been surveyed to determine the nature of the land resources. This is usually done by the Centre for Soil and Agriclimate Department in Pelalawan Regency. The products of such surveys are Soil and Climate Survey Report, which contains an evaluation of the suitability of land for oil palm plantation. Based on the survey, every area in Pelalawan regency has different land and climate condition then production of oil palm to be unstable.
However, critical success factor (CFA) of land suitability is very important in agriculture, especially to knowing productivity of oil palm yield. In this study, the CFA of the soil and climate in Pelalawan district is carried out to be determined which factors are suitable for the cultivation particular type of soil and climate data. Therefore, it’s a technique that is able to accurately compare factors land suitability based on soil and climate data.
This study was conducted on correlation of land suitability with soil and climate data using Principal Component Analysis (PCA). PCA has objective to reduce large number of variables to smaller, to aim at summarizing the real covariance structure of the multivariate data that is attained by transforming to new variables set (Filzmoser et al., 2007).
2. Research Method 2.1. Land suitability
Land suitability is the fitness of a given type of land for a defined use. The land may be considered in its present condition or after improvements. The process of land suitability classification is the appraisal and grouping of specific areas of land in terms of their suitability for defining uses.
This study also used one class under not suitable (N). The criteria of land suitability classification for oil palm based at The Centre for Soil and Agroclimate Research (2003) are shown in Table 1. For the purpose of this study, the potential land suitability of the area was determined for oil palm.
Table 1. Criteria for Actual and Potential Suitability of the Lands for Oil Palm
Land Characteristics Criteria for actual and potential suitability of the lands for oil palm
S1 S2 S3 N
Temperature (C) 25 - 28 22 - 25 20 - 22 <20
28 - 32 32 - 35 >35
Rainfall (mm/year) 1.700 - 2.500 1.450 - 1.700 1.250 - 1.450 <1.250
Land Characteristics Criteria for actual and potential suitability of the lands for oil palm
S1 S2 S3 N
Slope (%) <8 8 – 16 16 – 30 >30
pH (H2O) 5.0 - 6.5 4.2 - 5.0 <4.2 -
6.5 - 7.0 >7.0
Soil depth (cm) > 100 75 - 100 50 - 75 <50
Irradiation (hours) ≥6 ≥6 <6 <6
Humidity (%) ≥80 ≥80 <80 <80
C-Organic (%) >0.8 ≤0.8 - -
2.2. Soil
As noted by Bhargavi and Jyothi (2011), soil classification is the most important one. It influences many other properties and significance of land use and management. The Soil texture is an important property for agriculture soil classification, for example, fertility, drainage, water holding capacity, aeration, tillage, and strength of soils. Soil classification deals with the systematic categorization of soils based on distinguishing characteristics as criteria that dictate choices in use for agriculture. Soil classification is a dynamic subject, from the structure of the system itself, to the definitions of classes, and finally in the application in the field. Soil classification can be approached from the perspective of soil as a material and soil as a resource.
According to research by Bhargavi and Jyothi (2010), the soils are classified into different orders, suborders, great groups, sub-groups, families and finally into the series as per USDA Soil Taxonomy. The solid phase of soil can be divided into mineral matter and organic matter. The classes of soil particles according to size are Sand, Silt, Clay and the proposition of Sand, Silt, and Clay present in soil determines its texture.
The type of soil in the study area in general is podzolic soil yellow and red soils. Parent material forming the ground in this area dominated by sedimentary rocks such as sandstone and clay, and partly by the deposition of alluvium and organic materials from the remnants of vegetation. In some locations there are basins (backswamp, inland swamp) are always pooled with impeded drainage conditions to be severely hampered.
2.3. Climate
The climate, perhaps to be the most important ambient factor in soil profile development is presented below:
1. As the pointed out in weathering, temperature and precipitation have great influence on the weathering.
2. The amount of precipitation affects how much various materials are leached from the soil, thereby affecting soil fertility.
3. Climate affects the type of plant and animal life present.
Climate components that influence the growth of palm oil is the air temperature, precipitation and humidity. The location of this dissertation is located between 0°7’12” - 0°1’48” south latitude and between 102°7’12” - 102°15’0” east longitude which affect the number of and the pattern of the climate component.
Annual rainfall average in the study area during the last ten years (2000-2009) was 2,430 with an average of 95 days of rain per year, 9 months and 1 month wet dry. According to the classification from Schmidth-Ferguson, climate the plantation is grouped into types A, namely the very wet areas with tropical rain forest vegetation.
2.4. Principal component analysis (PCA)
Principal component analysis (PCA) is probably the oldest and best known of the techniques for dimensionality reduction, and a chapter on the subject may be found in numerous texts on multivariate analysis (Chen; Serneelsa and Verdonck, 2008). It was first introduced by Pearson (1901), and developed independently by Hotelling (1993). PCA can be applied in many applications include data compression, image processing, visualization, exploratory data analysis, pattern recognition and time series prediction (Chen, 2008).
the multivariate data, and for dimension reduction that is attained by transforming to new variables set (Filzmoser et al., 2007)
The algorithms of PCA are following (Smith, 2002) as follow:
1. Identification of Data
The first step is
identification of data into a matrix.
Which X= all data, X11- Xnp = Sequence of data
2. Compute the mean, standard deviation (SD), variance
The data have been complete, then calculate the mean, SD and variance. The mean is average across each dimension. The formula is:
=
∑
(2) Where = mean, n = data, Xi = all the numbers of data.
Standard Deviation (SD) is the average distance from the mean of the data set to point. The way to calculate it as a formula:
∑
Variance is another measure of the spread of data in a data set. Actually, it is almost identical to the SD. The formula is this:
= ∑( )
(4)
( )3. Compute the covariance
Before calculating the covariance, the variables must be standardized. Formula standardized of variables as follow:
Where: Zi is standardized of variables used.
Covariance is always measured between two dimensions, thus the covariance matrix will be 2 × 2. The formula for covariance is very similar with variance. The formula for variance
can also be written like this. (
If a case has a data set with more than two dimensions (like 3 dimensions), there is
4. Compute the Eigen Vectors and Eigen Values of the Covariance
Eigenvector can only be fined for square matrices and not every square matrix has
eigenvectors. Given a n x n matrix that does have Eigenvectors, there are n of them. Given 3 x 3 matrix, there are 3 Eigen vectors.
Eigenvector is calculated in a way iteration of matrix correlation, then normalized using
formula (2.10) as follows:
AI
AIJ
AI
2
...
AJ
2
(9)
All the Eigenvectors of a matrix are perpendicular or orthogonal. This is important because it means that you can express the data in terms of these perpendicular eigenvectors, instead of expressing them in terms of the x and y axes.
Eigenvalues are closely related to eigenvectors. Thus, we can see that eigenvectors and Eigenvalues always come in pairs.
5. Select components and forming a feature vector
In fact, the eigenvector with the highest Eigenvalues is the principle component of the data set. Once eigenvectors are found from covariance matrix, the next step is to order those Eigenvalues, highest to lowest. Feature vector is constructed by taking the eigenvectors that we want to keep from the list of the eigenvectors and forming a matrix with these eigenvectors in the columns.
Feature vector = (eig1, eig2,…,eign) (10)
6. Deriving the new data set
This is the final step in the PCA. Once we have chosen the components (eigenvectors) that we wish to keep in our data and formed a feature vector, we simply take the transpose of the vector and multiply it on the left of the original data set, transposed.
Final data = Row Feature Vector × Row Data Adjust (11)
Where Row Feature Vector is the matrix with the eigenvectors in the columns transposed
thus the eigenvectors are now in the rows, with the most significant eigenvector at the top. While, Row Data Adjust is the mean adjusted data transposed.
2.5. Data Definition and Collection
The data definition and collection activity involves how the data is acquired and processed until the data can be used to classify land suitability based on soil and climate characterized. The data of land suitability criteria were adopted from the Land Suitability for Agriculture Plants by the Centre for Soil and Agroclimate Research Bogor (2003) is shown in Table 1 There are four variables for oil palm classification, namely: slope, soil depth, C-organic and pH (H2O) of soil properties. Four variables, namely on climate characteristic are annual
rainfall, irradiation, humidity and temperature. For the purpose of this dissertation, the actual and potential land suitability of the area was determined for oil palm in Pelalawan regency.
In this study, soil samples were taken from the area based on afdeling zone. The eighty block in oil palm plantation areas with soil samples were analysed to get physical characteristics such as slope, soil depth, C-organic and pH (H2O). The rainfall, humidity, temperature and
2.6. Determine The Significant Factor using PCA
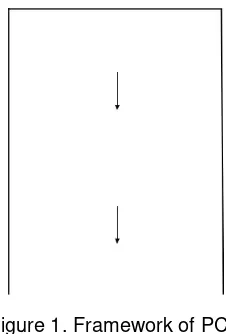
This phase describes about the determine the significant factor using the PCA technique. In this study, PCA is used to select the best variables. The framework of PCA showed in Figure 1 as follows.
Figure 1. Framework of PCA
In this study, PCA in figure 1 used for selected variables for obtaining best variables. The first process starts from data collection with soil and climate data and analysing the original variables, namely eight variables. The data have been measured based on variables, then continued for reduction variables of original using PCA and will be selected best variables. The processes of PCA are consisting identify data; calculate mean and standard deviation (SD). After that, calculate covariance matrix, eigenvector and eigenvalue, and the last are calculated percentage of the PC for each variable. The result of percentage of PC has been obtained and then will be selected the best PC-score, which is devoted to choosing the best variables than others. Every variable sorted from percentage of PC highest.
3. Results and Analysis 3.1. Data Definition
Data for land suitability was collected from the Centre for Soil and Agro climate Department in Pelalawan Regency. A number of data used 80 data from 3 afdeling oil palm plantation areas, namely OS, OO and OP which consist of soil samples and climate data. Total variables used are eight variables and data sample is shown in Table 3.
Table 3. Data sample of soil and climate
TP RF IR HM CO pH SD SL
No Afdeling Block
(C) (mm/year) (hour/day)
(%) (%) H₂O
(cm) (%)
1 OS 001 26.2 2430.4 6 82 0.8 4.9 99 2
2 OS 002 28.0 2430.4 6 80 0.7 5.3 100 2
... ... ... ... ... ... ... ... ... ... ...
79 OP 14A 26.7 2199.9 6 81 0.7 4.6 98 18
80 OP 22A 26.6 2199.9 6 82 0.7 4.7 98 18
3.2. Data Transformation
Firstly, the transform data into a matrix is the first step of PCA. Data of Table 3 is transformed into a matrix using Equation (1). The result of the transformation process in the matrix is as shown in the matrix X as shown in figure 2.
X =
Figure 2. MATRIX XTRANSFORMATION
3.3. Calculate Mean, Standard Deviation (SD) and Variance
Calculate mean, Standard Deviation (SD) and variance are calculated after matrix transformation done. Using Equation (3), Mean, SD and variance was calculated. There are 80 data and 8 variables shown in the Table 3 and every column were summed and divided by all data. The result of mean, SD and variance is shown in Table 4.
Table 4. Mean, Standard Deviation, and Variance of Soil and Climate Data
No TP RF IR HM CO pH SD SL
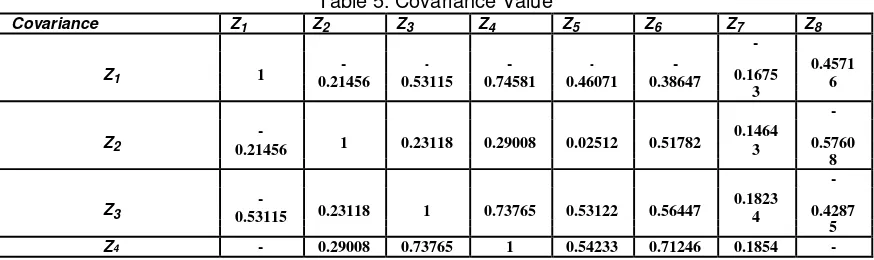
Before calculating covariance matrix, variables must be standardized. Standardized variables are addressed to compare to measurement of variables which is transformation of original variables to standard variables. The standardized of variables using formula (6) in Research Method Section, namely subtract each data with mean of the each variable, and then divided with SD of each variable. After that, calculated mean, SD, and variance. Mean value is expected near 0 or equal 0, whereas SD value expected is near 1 or equal 1. Next, in third step the mean, SD and variance are calculated.
Covariance Z1 Z2 Z3 Z4 Z5 Z6 Z7 Z8
0.74581 5 0.6685
7
-
- -
Z5 0.46071 0.02512 0.53122 0.54233 1 0.33348 0.0297 0.2113
1 7
- 0.2570
-
Z6 0.38647 0.51782 0.56447 0.71246 0.33348 1 3 0.6933
3
- - -
Z7 0.16753 0.14643 0.18234 0.18545 0.02971 0.25703 1 0.2843
5
- - - - -
-
Z8 0.45716 0.57608 0.42875 0.66857 0.21137 0.69333 0.2843 1
5
The obtained covariance matrix is then used to calculate eigenvector and eigenvalue that are discussed in next section.
3.5. Calculate Eigenvector and Eigenvalue
This step are calculate eigenvector and eigenvalue to reduce the dimensionality. The eigen decomposition needs to be obtained. Eigenvectors are set up as columns in a matrix. obtained eigenvector is
0.369 −0.258 − 0.393 − 0.461 − 0.284 − 0.412 −0.156 0.395
After eigenvector is obtained, then eigenvalue is computed in away as follows.
0,369(1 −λ ) + (−0,258R1 2) + (−0,393R13) + (−0,461R1 4) + (−0,284R1 5) + (−0,412R1 6) + (−0,156R1 7) + (0,395R18) = 0 0,369λ= 0,369 + (−0,258(−0,214)) + (−0,393(−0,531)) + (−0,461(−0,746)) + (−0,284(−0,461)) + (−0,412(−0,386))
+ (−0.156(−0,167)) + 0.395(0.457))
1,473
λ1=
0,369
λ1=3,996
Thus, in the same way to calculate λ2. λ3. λ4. λ5. λ5. λ6. λ7. and λ8. Eigenvalue were obtained
3.996; -5.699; -3.751; -3.198; -5.186; -3.574; -9.462; 3.728. For eigenvalue, the value will be chosen is always up to 1. But, for this case, all of eigenvalue will be used for the next step.
3.6. Calculate Percentage of PC-score on Variable
From obtained the eigenvalue (percentage of PC-score on each variable) be computed.
From the calculation of PC-score above shows result the percentage of each variable.
3.7. Sequence of Best Variables
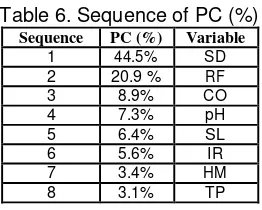
In this step is shown percentages of PC-score on each variable was obtained and sorted from high score. The sequence of PC-score is shown in Table 6 below.
Table 6. Sequence of PC (%)
Sequence PC (%) Variable
1 44.5% SD
2 20.9 % RF
3 8.9% CO
4 7.3% pH
5 6.4% SL
6 5.6% IR
7 3.4% HM
8 3.1% TP
Table 6 shows the ranking of each variable from result of PC-score. There are 8 variables, there are 2 variables from climate data and 6 variables from soil data. The result from PC-score are 44.5% (SD), 20.9% (RF), 8.9% (CO), 7.3% (pH), 6.4% (SL), 5.6% (IR), 3.4% (HM) and the last is 3.1% (TP). Therefore, the ranking sequence of the best variables is SD, RF, CO, pH, SL, IR, HM and TP because the result sorted from highest score.
According to the previous study (Wigena, et al, 2009), to analyses of land suitability in Kampar, Riau used annual rainfall, temperature, and humidity for climate data. Then, C-Organic, Nitrogen content, P2O5 content and availability of Sulfur for soil data. Next previous
study of (Rahmawaty et al, 2012), to classify of land suitability in Besitang, North Sumatra used slope, soil depth, temperature, texture, cation exchangeable capacity (CEC), saturation, pH, Na-exchange oxygen availability (drainage), nutrient retention, flood hazard, and root zone medium. Therefore, in this study to classify land suitability is different from previous study because used soil depth, rainfall, C-Organic, pH (H2O), slope, humidity, temperature and irradiation. The
variables is use based on condition of land in Pelalawan Regency.
4. Conclusion
The process of PCA are data definition; calculate mean, SD and variance; calculate eigenvector and eigenvalue; and calculate the percentage of PC-score on each variable. The result of percentage of PC-score on each variable, then sorted from highest score. In this study to classify land suitability is different from previous study because used soil depth, rainfall, C-Organic, pH (H2O), slope, humidity, temperature and irradiation. This variables use based on
condition of land in Pelalawan Regency.
References
[1] Bhargavi, P and Jyothi, S. 2011. “ Soil Classification Using Data Mining Techniques : A
Comparative Study. International Journal of Engineering Trends and Technology. July to Aug Issue 2011.
[2] Bhargavi, P and Jyothi, Dr.S,. 2010. Soil Classification Using GATree. International journal of computer science & informationTechnology (IJCSIT) Vol.2, No.5, October 2010.
[3] Bezdek. 1981. Pattern Recognition with Fuzzy Objective Function Algorithms. Plenum Press, New York.
[4] Dunn, J. C. 1974. A Fuzzy Relative of the ISODATA Process and Its Use in Detecting Compact Well-Separated Clusters. Journal of Cybernetics 3: 32-57.
[5] Hsieh, Kun-Lin, et al.,2006. Incoporating PCA and FCM into Organism Classification Based on Codon Usage. Proceedings of The Sixth IEEE International Conference on Computer and
Information Technology (CIT’06).
[6] Malhi, Arnas., Gao X, Robert. 2004. PCA-Based Feature Selection Scheme for Machine Defect Classification. IEEE Transactions on Instrumentation and Measurement, Vol. 53, Pp. No.6., December 2004.
[7] Pal N.R, Pal K, Keller J.M. and Bezdek J.C,. 2005. A Possibilistic Fuzzy c-Means Clustering Algorithm. IEEE Transactions on Fuzzy Systems, Vol. 13, No. 4, Pp. 517–530.
[8] Rahmawaty, et al. 2012. Land Suitability for Oil Palm in Besitang Watershed, North Sumatra, Indonesia. Science Journal of Agricultural Research and Management. Science Journal Publication.