! " ## $ ! % ! $ " & & $ '
$ $ ' " $ ! ' ! ! ! (
$ " & & $
$! & $
) $ # $
&
% * µµµµ% + %
! " #
! $%# σ &σ &σ & &σ
,
' " ( #
- # - ' #' " (
*
2/) ' 7 0 % & & $ &
$% & & & &2 $+ & 1 & &32 $) & 1 & &3D
E/" ! " 7 . ! ! # .
% & , & % & - $% & & %:%(%%%2 &2?E?5@@@ + , & + - $+ & %(%%%2 &CE5EEE
D/ 7 ,
! & % & , - + , & (%%%28 ( &2A53B3
?/ & )
& ) $ ! " !
) $ %
%:%(%%% %(%%%
(%%% 8 (
+-32*2
& ; 8%(%%%
B/4 7 , ! & ! ' α α α α * @5@?
= & ( & ( α&%(8 &E5FC
A/ $ . $ "
! > = ( # ?%(% :( ; > (98
@ µµµµ - & *µµµµ; 0 * µµµµ; 0 < ! '
,
5 6 ( /'4 '( /'4 . #
. F/" '
! ( ) ( ' #
' - & ; 0 ; 0 <
% 9%
- & %
; 0 % %
; 0 < 9% %
( ) 213120
/ 0 1232.
4 # 5
5 6
,
5 6 /'4 '( 5 6
/'4 .( /'4 ' /'4 .
/
/'4 .
$ " & #
' G 4. $
5 # 5 $ $$ (
3
6 7 #
! ' ' ! $ 6 7#H-I Iαααα
6 & & 3*
@ µµµµ3*µµµµ2 ! '5 H 6 H-I Iαααα
+
−
=
2 1 2 1
1
1
2
n
n
MS
x
x
q
9
: .
4 ) D4 =D 88 : 0 ; " , < ( '
: D
.$( E '( 5 F. 89; , $ =
D. 0 6 G 0
>
TABLE
Critical values of Student's t distribution*
Level of significance for one-tailed test
.10 .05 .025 01 .005 .0005 Level of significance for two-tailed test
df
.20 .10 .05 .02 .01 .001
1 3.078 6.314 12.706 31.821 63.657 636.619 2 1.886 2.920 4.303 6.965 9.925 31.598 3 1.638 2.353 3.182 4.541 5.841 12.941 4 1.533 2.132 2.776 3.747 4.604 8.610 5 1.476 2.015 2.571 3.365 4.032 6.859
6 1.440 .1.943 2.447 3.143 3.707 5.959 7 1.415 1.895 2.365 2.998 3.499 5.405 8 1.397 1.860 2.306 2.896 3.355 5.041 9 1.383 1.833 2.262 2.821 3.250 4.781 10 1.372 1.812 2.228 2.764 3.169 4.587
11 1.363 1.796 2.201 2.718 3.106 4.437 12 1.356 1.782 2.179 2.681 3.055 4.318 13 1.350 1.771 2.160 2.650 3.012 4.221 14 1.345 1.761 2.145 2.624 2.977 4.140 15 1.341 1.753 2.131 2.602 2.947 4.073
16 1.337 1.746 2.120 2.583 2.921 4.015 17 1.333 1.740 2.110 2.567 2.898 3.965 18 1.330 1.734 2.101 2.552 2.878 3.922 19 1.328 1.729 2.093 2.539 2.861 3.883 20 1.325 1.725 2.086 2.528 2.845 3.850
21 1.323 1.721 2.080 2.518 2.831 3.819 22 1.321 1.717 2.074 2.508 2.819 3.792 23 1.319 1.714 2.069 2.500 2.807 3.767 24 1.318 1.711 2.064 2.492 2.797 3.745 25 1.316 1.708 2.060 2.485 2.787 3.725
26 1.315 1.706 2.056 2.479 2.779 3.707 27 1.314 1.703 2.052 2.473 2.771 3.690 28 1.313 1.701 2.048 2.467 2.763 3.674 29 1.311 1.699 2.045 2.462 2.756 3.659 30 1.310 1.697 2.042 2.457 2.750 3.646
40 1.303 1.684 2.021 2.423 2.704 3.551 60 1.296 1.671 2.000 2.390 2.660 3.460 120 1.289 1.658 1.980 2.358 2.617 3.373
∞ 1.282 1.645 1.960 2.326 2.576 3.291
?
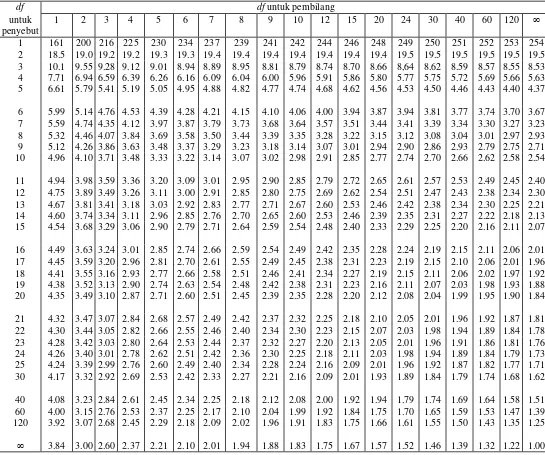
TABEL DISTRIBUSI F, untuk Tingkat Kemaknaan (αααα) = 0.05
df df untuk pembilang
untuk penyebut
1 2 3 4 5 6 7 8 9 10 12 15 20 24 30 40 60 120 ∞
1 161 200 216 225 230 234 237 239 241 242 244 246 248 249 250 251 252 253 254 2 18.5 19.0 19.2 19.2 19.3 19.3 19.4 19.4 19.4 19.4 19.4 19.4 19.4 19.5 19.5 19.5 19.5 19.5 19.5 3 10.1 9.55 9.28 9.12 9.01 8.94 8.89 8.95 8.81 8.79 8.74 8.70 8.66 8,64 8.62 8.59 8.57 8.55 8.53 4 7.71 6.94 6.59 6.39 6.26 6.16 6.09 6.04 6.00 5.96 5.91 5.86 5.80 5.77 5.75 5.72 5.69 5.66 5.63 5 6.61 5.79 5.41 5.19 5.05 4.95 4.88 4.82 4.77 4.74 4.68 4.62 4.56 4.53 4.50 4.46 4.43 4.40 4.37
6 5.99 5.14 4.76 4.53 4.39 4.28 4.21 4.15 4.10 4.06 4.00 3.94 3.87 3.94 3.81 3.77 3.74 3.70 3.67 7 5.59 4.74 4.35 4.12 3.97 3.87 3.79 3.73 3.68 3.64 3.57 3.51 3.44 3.41 3.39 3.34 3.30 3.27 3.23 8 5.32 4.46 4.07 3.84 3.69 3.58 3.50 3.44 3.39 3.35 3.28 3.22 3.15 3.12 3.08 3.04 3.01 2.97 2.93 9 5.12 4.26 3.86 3.63 3.48 3.37 3.29 3.23 3.18 3.14 3.07 3.01 2.94 2.90 2.86 2.93 2.79 2.75 2.71 10 4.96 4.10 3.71 3.48 3.33 3.22 3.14 3.07 3.02 2.98 2.91 2.85 2.77 2.74 2.70 2.66 2.62 2.58 2.54
11 4.94 3.98 3.59 3.36 3.20 3.09 3.01 2.95 2.90 2.85 2.79 2.72 2.65 2.61 2.57 2.53 2.49 2.45 2.40 12 4.75 3.89 3.49 3.26 3.11 3.00 2.91 2.85 2.80 2.75 2.69 2.62 2.54 2.51 2.47 2.43 2.38 2.34 2.30 13 4.67 3.81 3.41 3.18 3.03 2.92 2.83 2.77 2.71 2.67 2.60 2.53 2.46 2.42 2.38 2.34 2.30 2.25 2.21 14 4.60 3.74 3.34 3.11 2.96 2.85 2.76 2.70 2.65 2.60 2.53 2.46 2.39 2.35 2.31 2.27 2.22 2.18 2.13 15 4.54 3.68 3.29 3.06 2.90 2.79 2.71 2.64 2.59 2.54 2.48 2.40 2.33 2.29 2.25 2.20 2.16 2.11 2.07
16 4.49 3.63 3.24 3.01 2.85 2.74 2.66 2.59 2.54 2.49 2.42 2.35 2.28 2.24 2.19 2.15 2.11 2.06 2.01 17 4.45 3.59 3.20 2.96 2.81 2.70 2.61 2.55 2.49 2.45 2.38 2.31 2.23 2.19 2.15 2.10 2.06 2.01 1.96 18 4.41 3.55 3.16 2.93 2.77 2.66 2.58 2.51 2.46 2.41 2.34 2.27 2.19 2.15 2.11 2.06 2.02 1.97 1.92 19 4.38 3.52 3.13 2.90 2.74 2.63 2.54 2.48 2.42 2.38 2.31 2.23 2.16 2.11 2.07 2.03 1.98 1.93 1.88 20 4.35 3.49 3.10 2.87 2.71 2.60 2.51 2.45 2.39 2.35 2.28 2.20 2.12 2.08 2.04 1.99 1.95 1.90 1.84
21 4.32 3.47 3.07 2.84 2.68 2.57 2.49 2.42 2.37 2.32 2.25 2.18 2.10 2.05 2.01 1.96 1.92 1.87 1.81 22 4.30 3.44 3.05 2.82 2.66 2.55 2.46 2.40 2.34 2.30 2.23 2.15 2.07 2.03 1.98 1.94 1.89 1.84 1.78 23 4.28 3.42 3.03 2.80 2.64 2.53 2.44 2.37 2.32 2.27 2.20 2.13 2.05 2.01 1.96 1.91 1.86 1.81 1.76 24 4.26 3.40 3.01 2.78 2.62 2.51 2.42 2.36 2.30 2.25 2.18 2.11 2.03 1.98 1.94 1.89 1.84 1.79 1.73 25 4.24 3.39 2.99 2.76 2.60 2.49 2.40 2.34 2.28 2.24 2.16 2.09 2.01 1.96 1.92 1.87 1.82 1.77 1.71 30 4.17 3.32 2.92 2.69 2.53 2.42 2.33 2.27 2.21 2.16 2.09 2.01 1.93 1.89 1.84 1.79 1.74 1.68 1.62
40 4.08 3.23 2.84 2.61 2.45 2.34 2.25 2.18 2.12 2.08 2.00 1.92 1.94 1.79 1.74 1.69 1.64 1.58 1.51 60 4.00 3.15 2.76 2.53 2.37 2.25 2.17 2.10 2.04 1.99 1.92 1.84 1.75 1.70 1.65 1.59 1.53 1.47 1.39 120 3.92 3.07 2.68 2.45 2.29 2.18 2.09 2.02 1.96 1.91 1.83 1.75 1.66 1.61 1.55 1.50 1.43 1.35 1.25
∞ 3.84 3.00 2.60 2.37 2.21 2.10 2.01 1.94 1.88 1.83 1.75 1.67 1.57 1.52 1.46 1.39 1.32 1.22 1.00
2
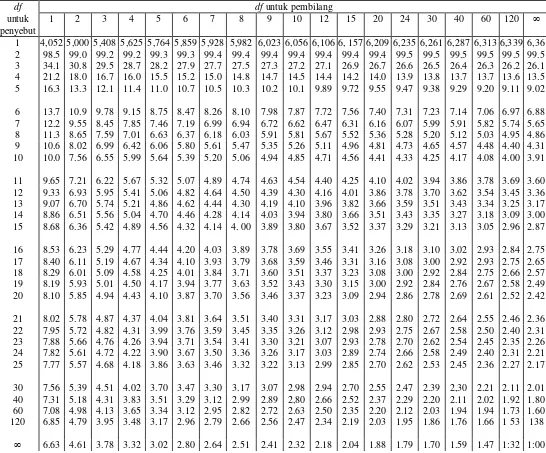
TABEL DISTRIBUSI F, untuk Tingkat Kemaknaan (αααα) = 0.05
df df untuk pembilang
untuk penyebut
1 2 3 4 5 6 7 8 9 10 12 15 20 24 30 40 60 120 ∞
1 4,052 5,000 5,408 5,625 5,764 5,859 5,928 5,982 6,023 6,056 6,106 6, 157 6,209 6,235 6,261 6,287 6,313 6,339 6,36 2 98.5 99.0 99.2 99.2 99.3 99.3 99.4 99.4 99.4 99.4 99.4 99.4 99.4 99.5 99.5 99.5 99.5 99.5 99.5 3 34.1 30.8 29.5 28.7 28.2 27.9 27.7 27.5 27.3 27.2 27.1 26.9 26.7 26.6 26.5 26.4 26.3 26.2 26.1 4 21.2 18.0 16.7 16.0 15.5 15.2 15.0 14.8 14.7 14.5 14.4 14.2 14.0 13.9 13.8 13.7 13.7 13.6 13.5 5 16.3 13.3 12.1 11.4 11.0 10.7 10.5 10.3 10.2 10.1 9.89 9.72 9.55 9.47 9.38 9.29 9.20 9.11 9.02
6 13.7 10.9 9.78 9.15 8.75 8.47 8.26 8.10 7.98 7.87 7.72 7.56 7.40 7.31 7.23 7.14 7.06 6.97 6.88 7 12.2 9.55 8.45 7.85 7.46 7.19 6.99 6.94 6.72 6.62 6.47 6.31 6.16 6.07 5.99 5.91 5.82 5.74 5.65 8 11.3 8.65 7.59 7.01 6.63 6.37 6.18 6.03 5.91 5.81 5.67 5.52 5.36 5.28 5.20 5.12 5.03 4.95 4.86 9 10.6 8.02 6.99 6.42 6.06 5.80 5.61 5.47 5.35 5.26 5.11 4.96 4.81 4.73 4.65 4.57 4.48 4.40 4.31 10 10.0 7.56 6.55 5.99 5.64 5.39 5.20 5.06 4.94 4.85 4.71 4.56 4.41 4.33 4.25 4.17 4.08 4.00 3.91
11 9.65 7.21 6.22 5.67 5.32 5.07 4.89 4.74 4.63 4.54 4.40 4.25 4.10 4.02 3.94 3.86 3.78 3.69 3.60 12 9.33 6.93 5.95 5.41 5.06 4.82 4.64 4.50 4.39 4.30 4.16 4.01 3.86 3.78 3.70 3.62 3.54 3.45 3.36 13 9.07 6.70 5.74 5.21 4.86 4.62 4.44 4.30 4.19 4.10 3.96 3.82 3.66 3.59 3.51 3.43 3.34 3.25 3.17 14 8.86 6.51 5.56 5.04 4.70 4.46 4.28 4.14 4.03 3.94 3.80 3.66 3.51 3.43 3.35 3.27 3.18 3.09 3.00 15 8.68 6.36 5.42 4.89 4.56 4.32 4.14 4. 00 3.89 3.80 3.67 3.52 3.37 3.29 3.21 3.13 3.05 2.96 2.87
16 8.53 6.23 5.29 4.77 4.44 4.20 4.03 3.89 3.78 3.69 3.55 3.41 3.26 3.18 3.10 3.02 2.93 2.84 2.75 17 8.40 6.11 5.19 4.67 4.34 4.10 3.93 3.79 3.68 3.59 3.46 3.31 3.16 3.08 3.00 2.92 2.93 2.75 2.65 18 8.29 6.01 5.09 4.58 4.25 4.01 3.84 3.71 3.60 3.51 3.37 3.23 3.08 3.00 2.92 2.84 2.75 2.66 2.57 19 8.19 5.93 5.01 4.50 4.17 3.94 3.77 3.63 3.52 3.43 3.30 3.15 3.00 2.92 2.84 2.76 2.67 2.58 2.49 20 8.10 5.85 4.94 4.43 4.10 3.87 3.70 3.56 3.46 3.37 3.23 3.09 2.94 2.86 2.78 2.69 2.61 2.52 2.42
21 8.02 5.78 4.87 4.37 4.04 3.81 3.64 3.51 3.40 3.31 3.17 3.03 2.88 2.80 2.72 2.64 2.55 2.46 2.36 22 7.95 5.72 4.82 4.31 3.99 3.76 3.59 3.45 3.35 3.26 3.12 2.98 2.93 2.75 2.67 2.58 2.50 2.40 2.31 23 7.88 5.66 4.76 4.26 3.94 3.71 3.54 3.41 3.30 3.21 3.07 2.93 2.78 2.70 2.62 2.54 2.45 2.35 2.26 24 7.82 5.61 4.72 4.22 3.90 3.67 3.50 3.36 3.26 3.17 3.03 2.89 2.74 2.66 2.58 2.49 2.40 2.31 2.21 25 7.77 5.57 4.68 4.18 3.86 3.63 3.46 3.32 3.22 3.13 2.99 2.85 2.70 2.62 2.53 2.45 2.36 2.27 2.17
30 7.56 5.39 4.51 4.02 3.70 3.47 3.30 3.17 3.07 2.98 2.94 2.70 2.55 2.47 2.39 2,30 2.21 2.11 2.01 40 7.31 5.18 4.31 3.83 3.51 3.29 3.12 2.99 2.89 2,80 2.66 2.52 2.37 2.29 2.20 2.11 2.02 1.92 1.80 60 7.08 4.98 4.13 3.65 3.34 3.12 2.95 2.82 2.72 2.63 2.50 2.35 2.20 2.12 2.03 1.94 1.94 1.73 1.60 120 6.85 4.79 3.95 3.48 3.17 2.96 2.79 2.66 2.56 2.47 2.34 2.19 2.03 1.95 1.86 1.76 1.66 1 53 138
∞ 6.63 4.61 3.78 3.32 3.02 2.80 2.64 2.51 2.41 2.32 2.18 2.04 1.88 1.79 1.70 1.59 1.47 1:32 1:00