Other resources from O’Reilly
Related titles
Apache Cookbook™ Apache 2 Pocket Reference Building Scalable Web Sites High Performance MySQLHigh Performance Web Sites
Optimizing Oracle Performance Website Optimization
oreilly.com
oreilly.com is more than a complete catalog of O’Reilly books. You’ll also find links to news, events, articles, weblogs, sample chapters, and code examples.oreillynet.comis the essential portal for developers interested in open and emerging technologies, including new plat-forms, programming languages, and operating systems.
Conferences
O’Reilly brings diverse innovators together to nurture the ideas that spark revolutionary industries. We specialize in documenting the latest tools and systems, translating the innovator’s knowledge into useful skills for those in thetrenches. Visit conferences.oreilly.com for our upcoming
events.
Safari Bookshelf (safari.oreilly.com) is the premier online
Beijing • Cambridge • Farnham • Köln • Sebastopol • Taipei • Tokyo
The Art of Capacity Planning
The Art of Capacity Planning by John Allspaw
Copyright © 2008 Yahoo! Inc. All rights reserved. Printed in the United States of America. Published by O’Reilly Media, Inc. 1005 Gravenstein Highway North, Sebastopol, CA 95472 O’Reilly books may be purchased for educational, business, or sales promotional use. Online editions are also available for most titles (safari.oreilly.com). For more information, contact our corporate/institutional sales department: (800) 998-9938 or c[email protected].
Editor: Andy Oram
Production Editor: Rachel Monaghan Production Services: Octal Publishing, Inc. Indexer: Angela Howard
Cover Designer: Mark Paglietti Interior Designer: Marcia Friedman Illustrator: Robert Romano
Printing History:
September 2008: First Edition.
The O’Reilly logo is a registered trademark of O’Reilly Media, Inc.The Art of Capacity Planning and related trade dress are trademarks of O’Reilly Media, Inc. Many of the designations used by manufacturers and sellers to distinguish their products are claimed as trademarks. Where those designations appear in this book, and O’Reilly Media, Inc. was aware of a trademark claim, the designations have been printed in caps or initial caps.
While every precaution has been taken in the preparation of this book, the publisher and author assume no responsibility for errors or omissions, or for damages resulting from the use of the information contained herein.
This book uses RepKover™, a durable and flexible lay-flat binding.
vii
C O N T E N T S
PREFACE ix
1 GOALS, ISSUES, AND PROCESSES IN
CAPACITY PLANNING 1
Quick and Dirty Math 3
Predicting When Your Systems Will Fail 3
Make Your System Stats Tell Stories 4
Buying Stuff: Procurement Is a Process 6 Performance and Capacity: Two Different Animals 6 The Effects of Social Websites and Open APIs 8
2 SETTING GOALS FOR CAPACITY 11
Different Kinds of Requirements and Measurements 12
Architecture Decisions 15
3 MEASUREMENT: UNITS OF CAPACITY 23
Aspects of Capacity Tracking Tools 24
Applications of Monitoring 31
API Usage and Its Effect on Capacity 59
Examples and Reality 60
Summary 61
4 PREDICTING TRENDS 63
Riding Your Waves 64
Procurement 80
The Effects of Increasing Capacity 83
Long-Term Trends 84
Iteration and Calibration 88
Summary 90
5 DEPLOYMENT 93
Automated Deployment Philosophies 93
Automated Installation Tools 96
Automated Configuration 98
viii C O N T E N T S
A VIRTUALIZATION AND CLOUD COMPUTING 105
B DEALING WITH INSTANTANEOUS GROWTH 121
C CAPACITY TOOLS 127
ix
Chapter
Preface
S
OMEWHERE AROUND3
A.
M.
ONJ
ULY7
TH, 2005,
MY COWORKER, C
ALH
ENDERSON,
ANDI
WERE FINISHING up some final details before moving all of the traffic for our website, Flickr.com, to its new home: a Yahoo! data center in Texas. The original infrastructure in Vancouver was becom-ing more and more overloaded, and sufferbecom-ing from serious power and space constraints. Since Yahoo! had just acquired Flickr, it was time to bring new capacity online. It was about an hour after we changed DNS records to point to our shiny new servers that Cal happened to glance at the news. The London subway had just been bombed.Londoners responded with their camera phones, among other things. Over the next 24 hours, Flickr saw more traffic than ever before, as photos from the disaster were uploaded to the site. News outlets began linking to the photos, and traffic on our new servers went through the roof.
x P R E F A C E
Capacity planning has been around since ancient times, with roots in everything from economics to engineering. In a basic sense, capacity planning is resource management. When resources are finite, and come at a cost, you need to do some capacity planning.
When a civil engineering firm designs a new highway system, it’s planning for capacity, as is a power company planning to deliver electricity to a metropolitan area. In some ways, their concerns have a lot in common with web operations; many of the basic concepts and concerns can be applied to all three disciplines.
While systems administration has been around since the 1960s, the branch focused on serving websites is still emerging. A large part of web operations is capacity planning and management. Those areprocesses, nottasks, and they are composed of many different parts. Although every organization goes about it differently, the basic concepts are the same:
• Ensure proper resources (servers, storage, network, etc.) are available to handle expected and unexpected loads.
• Have a clearly defined procurement and approval system in place.
• Be prepared to justify capital expenditures in support of the business.
• Have a deployment and management system in place to manage the resources once they are deployed.
Why I Wrote This Book
One of my frustrations as an operations engineering manager was not having somewhere to turn to help me figure out how much equipment we’d need to keep running. Existing books on the topic of computer capacity planning were focused on the mathematicaltheory of resource planning, rather than the practicalimplementation of the whole process.
A lot of literature addressed only rudimentary models of website use cases, and lacked specific information or advice. Instead, they tended to offer mathematical models designed to illustrate the principles of queuing theory, which is the foundation of traditional capac-ity planning. This approach might be mathematically interesting and elegant, but it doesn’t help the operations engineer when informed he has a week to prepare for some unknown amount of additional traffic—perhaps due to the launch of a super new fea-ture—or seeing his site dying under the weight of a link from the front page of Yahoo!, Digg, or CNN.
I’ve found most books on web capacity planning were written with the implied assump-tion that concepts and processes found in non-web environments, such as manufacturing or industrial engineering, applied uniformly to website environments as well. While some of the theory surrounding such planning may indeed be similar, the practical application of those concepts doesn’t map very well to the short timelines of website development.
P R E F A C E xi new code is deployed and the usage characteristics have likely already changed
dramati-cally. Or some other technological, social, or real-world event occurs, making all of the modeling and simulations irrelevant.
What I’ve found to be far more helpful, is talking to colleagues in the industry—people who come up against many of the same scaling and capacity issues. Over time, I’ve had contact with many different companies, each employing diverse architectures, and each experiencing different problems. But quite often they shared very similar approaches to solutions. My hope is that I can illustrate some of these approaches in this book.
Focus and Topics
This book is not about building complex models and simulations, nor is it about spending time running benchmarks over and over. It’s not about mathematical concepts such as Lit-tle’s Law, Markov chains, or Poisson arrival rates.
What this book is about ispracticalcapacity planning and management that can take place in the real world. It’s about using real tools, and being able to adapt to changing usage on a website that will (hopefully) grow over time. When you have a flat tire on the highway, you could spend a lot of time trying to figure out the cause, or you can get on with the obvious task of installing the spare and getting back on the road.
This is the approach I’m presenting to capacity planning: adaptive, not theoretical.
Keep in mind a good deal of the information in this book will seem a lot like common sense—this is a good thing. Quite often the simplest approaches to problem solving are the best ones, and capacity planning is no exception.
This book will cover the process of capacity planning for growing websites, including mea-surement, procurement, and deployment. I’ll discuss some of the more popular and proven measurement tools and techniques. Most of these tools run in both LAMP and Windows-based environments. As such, I’ll try to keep the discussion as platform-agnostic as possible.
Of course, it’s beyond the scope of this book to cover the details of every database, web server, caching server, and storage solution. Instead, I’ll use examples of each to illustrate the process and concepts, but this book is not meant to be an implementation guide. The intention is to be as generic as possible when it comes to explaining resource manage-ment—it’s the process itself we want to emphasize.
For example, a database is used to store data and provide responses to queries. Most of the more popular databases allow for replicating data to other servers, which enhances redun-dancy, performance, and architectural decisions. It also assists the technical implementa-tion of replicaimplementa-tion with Postgres, Oracle, or MySQL (a topic for other books). This book covers what replication means in terms of planning capacity and deployment.
xii P R E F A C E
Audience for This Book
This book is for systems, storage, database, and network administrators, engineering man-agers, and of course, capacity planners.
It’s intended for anyone who hopes (or perhaps fears) their website will grow like those of Facebook, Flickr, MySpace, Twitter, and others—companies that underwent the trial-by-fire process of scaling up as their usage skyrocketed. The approaches in this text come from real experience with sites where traffic has grown both heavily and rapidly. If you expect the popularity of your site will dramatically increase the amount of traffic you experience, then please read this book.
Organization of the Material
Chapter 1,Goals, Issues, and Processes in Capacity Planning, presents the issues that arise over and over on heavily trafficked websites.
Chapter 2,Setting Goals for Capacity, illustrates the various concerns involved with plan-ning for the growth of a web application, and how capacity fits into the overall picture of availability and performance.
Chapter 3,Measurement: Units of Capacity, discusses capacity measurement and monitoring.
Chapter 4,Predicting Trends, explains how to turn measurement data into forecasts, and how trending fits into the overall planning process.
Chapter 5,Deployment, discusses concepts related to deployment; automation of installation, configuration, and management.
Appendix A,Virtualization and Cloud Computing, discusses where virtualization and cloud services fit into a capacity plan.
Appendix B,Dealing with Instantaneous Growth, offers insight into what can be done in capacity crisis situations, and some best practices for dealing with site outages.
Appendix C,Capacity Tools, is an annotated list of measurement, installation, configuration, and management tools highlighted throughout the book.
Conventions Used in This Book
The following typographical conventions are used in this book:
Italic
Indicates new terms, URLs, filenames, Unix utilities, and command-line options.
Constant width
P R E F A C E xiii
Constant width bold
Shows commands or other text that should be typed literally by the user, and parts of code or files highlighted to stand out for discussion.
Constant width italic
Shows text that should be replaced with user-supplied values.
Using Code Examples
This book is here to help you get your job done. In general, you may use the code in this book in your programs and documentation. You do not need to contact us for permission unless you’re reproducing a significant portion of the code. For example, writing a pro-gram that uses several chunks of code from this book does not require permission. Selling or distributing a CD-ROM of examples from O’Reilly booksdoes require permission. Answering a question by citing this book and quoting example code does not require per-mission. Incorporating a significant amount of example code from this book into your product’s documentationdoes require permission.
We appreciate, but do not require, attribution. An attribution usually includes the title, author, publisher, and ISBN. For example: “The Art of Capacity Planningby John Allspaw. Copyright 2008 Yahoo! Inc., 978-0-596-51857-8.”
If you feel your use of code examples falls outside fair use or the permission given above, feel free to contact us at[email protected].
We’d Like to Hear from You
Please address comments and questions concerning this book to the publisher:
O’Reilly Media, Inc.
1005 Gravenstein Highway North Sebastopol, CA 95472
800-998-9938 (in the United States or Canada) 707-829-0515 (international or local)
707-829-0104 (fax)
We have a web page for this book, where we list errata, examples, and any additional information. You can access this page at:
http://www.oreilly.com/catalog/9780596518578
To comment or ask technical questions about this book, send email to:
For more information about our books, conferences, Resource Centers, and the O’Reilly Network, see our website at:
xiv P R E F A C E
Safari
®
Books Online
When you see a Safari®Books Online icon on the cover of your favorite
technology book, that means the book is available online through the O’Reilly Network Safari Bookshelf.
Safari offers a solution that’s better than e-books. It’s a virtual library that lets you easily search thousands of top tech books, cut and paste code samples, download chapters, and find quick answers when you need the most accurate, current information. Try it for free athttp://safari.oreilly.com.
Acknowledgments
It’s simply not possible to thank everyone enough in this single, small paragraph, but I will most certainly mention their names. Most of the material in this book was derived from experiences in the trenches, and there are many people who have toughed it out in those trenches alongside me. Peter Norby, Gil Raphaelli, Kevin Collins, Dathan Pattishall, Cal Henderson, Aaron Cope, Paul Hammond, Paul Lloyd, Serguei Mourachov and Chad Dick-erson need special thanks, as does Heather Champ and the entire Flickr customer care team. Thank you Flickr development engineering: you all think like operations engineers and for that I am grateful. Thanks to Stewart Butterfield and Caterina Fake for convincing me to join the Flickr team early on. Thanks to David Filo and Hugo Gunnarsen for forcing me to back up my hardware requests with real data. Major thanks go out to Kevin Murphy for providing so much material in the automated deployment chapter. Thanks to Andy Oram and Isabel Kunkle for editing, and special thanks to my good friend Chris Colin for excellent pre-pre-editing advice.
Thanks to Adam Jacob, Matt St. Onge, Jeremy Zawodny, and Theo Schlossnagle for the super tech review.
Much thanks to Matt Mullenweg and Don MacAskill for sharing their cloud infrastructure use cases.
1
Chapter 1
C H A P T E R O N E
Goals, Issues, and Processes in
Capacity Planning
T
HIS CHAPTER IS DESIGNED TO HELP YOU ASSEMBLE AND USE THE WEALTH OF TOOLS AND TECHNIQUES presented in the following chapters. If you do not grasp the concepts introduced in this chap-ter, reading the remainder of this book will be like setting out on the open ocean without knowing how to use a compass, sextant, or GPS device—you can go around in circles forever.When you break them down, capacity planning and management—the steps taken to organize the resources your site needs to run properly—are, in fact, simple processes. You begin by asking the question: what performance do you need from your website?
First, define the application’s overall load and capacity requirements usingspecificmetrics, such as response times, consumable capacity, and peak-driven processing. Peak-driven processing is the workload experienced by your application’s resources (web servers, data-bases, etc.) during peak usage. The process, illustrated in Figure 1-1, involves answering these questions:
1. How well is the current infrastructure working?
2 C H A P T E R O N E
2. What do you need in the future to maintain acceptable performance?
Predict the future based on what you know about past system performance then marry that prediction with what you can afford, and a realistic timeline. Determine what you’ll need andwhen you’ll need it.
3. How can you install and manage resources after you gather what you need?
Deploy this new capacity with industry-proven tools and techniques.
4. Rinse, repeat.
Iterate and calibrate your capacity plan over time.
Your ultimate goal lies between not buying enough hardware and wasting your money on too much hardware.
Let’s suppose you’re a supermarket manager. One of your tasks is to manage the schedule of cashiers. Your challenge is picking the right number of cashiers working at any moment. Assign too few, and the checkout lines will become long, and the customers irate. Schedule too many working at once, and you’re spending more money than neces-sary. The trick is finding the right balance.
Now, think of the cashiers as servers, and the customers as client browsers. Be aware some cashiers might be better than others, and each day might bring a different amount of cus-tomers. Then you need to take into consideration your supermarket is getting more and more popular. A seasoned supermarket manager intuitively knows these variables exist, and attempts to strike a good balance between not frustrating the customers and not pay-ing too many cashiers.
Welcome to the supermarket of web operations.
G O A L S , I S S U E S , A N D P R O C E S S E S I N C A P A C I T Y P L A N N I N G 3
Quick and Dirty Math
The ideas I’ve just presented are hardly new, innovative, or complex. Engineering disci-plines have always employed back-of-the-envelope calculations; the field of web opera-tions is no different.
Because we’re looking to make judgments and predictions on a quickly changing land-scape, approximations will be necessary, and it’s important to realize what that means in terms of limitations in the process. Being aware of when detail is needed and when it’s not is crucial to forecasting budgets and cost models. Unnecessary detail means wasted time. Lacking the proper detail can be fatal.
Predicting When Your Systems Will Fail
Knowing when each piece of your infrastructure will fail (gracefully or not) is crucial to capacity planning. Capacity planning for the web, more often than one would like to admit, looks like the approach shown in Figure 1-2.
Including this information as part of your calculations is mandatory, not optional. How-ever, determining the limits of each portion of your site’s backend can be tricky. An easily segmented architecture helps you find the limits of your current hardware configurations. You can then use those capacity ceilings as a basis for predicting future growth.
For example, let’s assume you have a database server that responds to queries from your frontend web servers. Planning for capacity means knowing the answers to questions such as these:
• Taking into account the specific hardware configuration, how many queries per second (QPS) can the database server manage?
• How many QPS can it serve before performance degradation affects end user experience?
Adjusting for periodic spikes and subtracting some comfortable percentage of headroom (or safety factor, which we’ll talk about later) will render a single number with which you can characterize that database configuration vis-à-vis the specific role. Once you find that “red line” metric, you’ll know:
4 C H A P T E R O N E
• The load that will cause the database to fail, which will allow you to set alert thresholds accordingly.
• What to expect from adding (or removing) similar database servers to the backend.
• When to start sizing another order of new database capacity.
We’ll talk more about these last points in the coming chapters. One thing to note is the entire capacity planning process is going to be architecture-specific. This means the calcu-lations you make to predict increasing capacity may have other constraints specific to your particular application.
For example, to spread out the load, a LAMP application might utilize a MySQL server as a master database in which all live data is written and maintained, and use a second, repli-cated slave database for read-only database operations. Adding more slave databases to scale the read-only traffic is generally an appropriate technique, but many large websites (including Flickr) have been forthright about their experiences with this approach, and the limits they’ve encountered. There is a limit to how many read-only slave databases you can add before you begin to see diminishing returns as the rate and volume of changes to data on the master database may be more than the replicated slaves can sus-tain, no matter how many you add. This is just one example where your architecture can have a large effect on your ability to add capacity.
Expanding database-driven web applications might take different paths in their evolution toward scalable maturity. Some may choose to federate data across many master data-bases. They may split up the database into their own clusters, or choose to cache data in a variety of methods to reduce load on their database layer. Yet others may take a hybrid approach, using all of these methods of scaling. This book is not intended to be an advice column on database scaling, it’s meant to serve as a guide by which you can come up with your own planning and measurement process—one that is right for your environment.
Make Your System Stats Tell Stories
Server statistics paint only part of the picture of your system’s health. Unless they can be tied to actual site metrics, server statistics don’t mean very much in terms of characterizing your usage. And this is something you’ll need to know in order to track how capacity will change over time.
For example, knowing your web servers are processingX requests per second is handy, but it’s also good to know what thoseX requests per second actually mean in terms of your users. MaybeXrequests per second representsYnumber of users employing the site simultaneously.
G O A L S , I S S U E S , A N D P R O C E S S E S I N C A P A C I T Y P L A N N I N G 5 providing service to the users. In the examples above, the ability to generate a comment
within the application might consume more resources than simply browsing the site, but it consumes less when compared to uploading a photo. Having some idea of which features tax your capacity more than others gives you context in which to decide where you’ll want to focus priority attention in your capacity planning process. These observations can also help drive any technology procurement justifications.
Quite often, the person approving expensive hardware and software requests is not the same person making the requests. Finance and business leaders must sometimes trust implicitly that their engineers are providing accurate information when they request capi-tal for resources. Tying system statistics to business metrics helps bring the technology closer to the business units, and can help engineers understand what the growth means in terms of business success. Marrying these two metrics together can therefore help the awareness that technology costs shouldn’t automatically be considered a cost center, but rather a significant driver of revenue. It also means that future capital expenditure costs have some real context, so even those non-technical folks will understand the value tech-nology investment brings.
For example, when presenting a proposal for an order of new database hardware, you should have the systems and application metrics on hand to justify the investment. But if you had the pertinent supporting data, you could say something along the lines of “…and if we get these new database servers, we’ll be able to serve our pagesX percent faster, which means our pageviews—and corresponding ad revenues—have an opportunity to increase up toY percent.” Backing up your justifications in this way can also help the busi-ness development people understand what success means in terms of capacity management.
MEASURE, MEASURE, MEASURE
Engineers like graphs for good reason: they tell a story better than numbers can by themselves, and let you know exactly how your system is performing. There are some industry-tested tools and tech-niques used in measuring system statistics, such as CPU, memory, and disk usage. A lot of them can be reused to measure anything you need, including application-level or business metrics.
Another theme in this book is measurement, which should be considered a necessity, not an option. You have a fuel gauge on your car’s dashboard for a reason. Don’t make the mistake of not installing one on your systems.
6 C H A P T E R O N E
Buying Stuff: Procurement Is a Process
After you’ve completed all your measurements, made snap judgments about usage, and sketched out future predictions, you’ll need to actually buy things: bandwidth, storage appliances, servers, maybe eveninstances of virtual servers. In each case, you’ll need to explain to the people with the checkbooks why you need what you think you need, and why you need it when you think you need it. (We’ll talk more about predicting the future and presenting those findings in Chapter 4.)
Procurement is a process, and should be treated as yet another part of capacity planning. Whether it’s a call to a hosting provider to bring new capacity online, a request for quotes from a vendor, or a trip to your local computer store, you need to take this important seg-ment of time into account.
Smaller companies, while usually a lot less “liquid” than their larger bretheren, can really shine in this arena. Being small often goes hand-in-hand with being nimble. So while you might not be offered the best price on equipment as the big companies who buy in massive bulk, you’ll likely be able to get it faster, owing to a less cumbersome approval process.
Quite often the person you might need to persuade is the CFO, who sits across the hall from you. In the early days of Flickr, we used to be able to get quotes from a vendor and simply walk over to the founder of the company (seated 20 feet away), who could cut and send a check. The servers would arrive in about a week, and we’d rack them in the data center the day they came out of the box. Easy!
Yahoo! has a more involved cycle of vetting hardware requests that includes obtaining many levels of approval and coordinating delivery to various data centers around the world. Purchases having been made, the local site operation teams in each data center then must assemble, rack, cable, and install operating systems on each of the boxes. This all takes more time than when we were a startup. Of course, the flip side is, with such a large company we can leverage buying power. By buying in bulk, we can afford a larger amount of hardware for a better price.
In either case, the concern is the same: the procurement process should be baked into your larger planning exercise. It takes time and effort, just like all the other steps. There is more about this in Chapter 4.
Performance and Capacity: Two Different Animals
G O A L S , I S S U E S , A N D P R O C E S S E S I N C A P A C I T Y P L A N N I N G 7 Let’s face it: tuning is fun, and it’s addictive. But after you spend some time tweaking
val-ues, testing, and tweaking some more, it can become a endless hole, sucking away time and energy for little or no gain. There are those rare and beautiful times when you stumble upon some obvious and simple parameter that can make everything faster—you find the one MySQL configuration parameter that doubles the cache size, or realize after some test-ing that those TCP window sizes set in the kernel can really make a difference. Great! But as illustrated in Figure 1-3, for each of those rare gems you discover, the amount of obvi-ous optimizations you find thereafter dwindles pretty rapidly.
Capacity planning must happenwithout regard to what you might optimize. The first real step in the process is to accept the system’scurrentperformance, in order to estimate what you’ll need in the future. If at some point down the road you discover some tweak that brings about more resources, that’s a bonus.
COMMON SENSE STEPS AND METHODS
Real-world observations are worth more than any theoretical measurement. Capacity planning— and the predictions that drive it—should come from theempirical observation of your site’s usage, not benchmarks made in artificial environments. Benchmarking and performance research have value, but shouldn’t be used as the sole indicators of capacity.
8 C H A P T E R O N E
Here’s a quick example of the difference between performance and capacity. Suppose there is a butcher in San Francisco who prepares the most delectable bacon in the state of California. Let’s assume the butcher shop has an arrangement with a store in San Jose to sell their great bacon there. Every day, the butcher needs to transport the bacon from San Francisco to San Jose using some number of trucks—and the bacon has to get there within an hour. The butcher needs to determine what type of trucks, and how many of them he’ll need to get the bacon to San Jose. The demand for the bacon in San Jose is increasing with time. It’s hard having the best bacon in the state, but it’s a good problem to have.
The butcher has three trucks that suffice for the moment. But he knows he might be dou-bling the amount of bacon he’ll need to transport over the next couple of months. At this point, he can either:
• Make the trucks go faster
• Get more trucks
You’re probably seeing the point here. While the butcher might squeeze some extra horsepower out of the trucks by having them tuned up—or by convincing the drivers to break the speed limit—he’s not going to achieve the same efficiency gain that would come from simply purchasing more trucks. He has no choice but to accept the performance of each truck, and work from there.
The moral of this little story? When faced with the question of capacity, try to ignore those urges to make existing gear faster, and focus instead on the topic at hand: finding out what you need, and when.
One other note about performance tuning and capacity: there is no silver bullet formula to tell you when tuning is appropriate and when it’s not. It may be that simply buying more hardware is the correct thing to do, when weighed against engineering time spent on tun-ing the existtun-ing system. Striktun-ing this balance between optimization and capacity deploy-ment is a challenge and will differ from environdeploy-ment to environdeploy-ment.
The Effects of Social Websites and Open APIs
G O A L S , I S S U E S , A N D P R O C E S S E S I N C A P A C I T Y P L A N N I N G 9 Providing web services via open APIs introduces a another ball of wax altogether, as your
application’s data will be accessed by yet more applications, each with their own usage and growth patterns. It also means users have a convenient way to abuse the system, which puts more uncertainty into the capacity equation. API usage needs to be monitored to watch for emerging patterns, usage edge cases, and rogue application developers bent on crawling the entire database tree. Controls need to be in place to enforce the guidelines orTerms of Service(TOS), which should accompany any open API web service (more about that in Chapter 3).
In my first year of working at Flickr, we grew from 60 photo uploads per minute to 660. We expanded from consuming 200 gigabytes of disk space per day to 880, and we bal-looned from serving 3,000 images a second to 8,000. And that was just in the first year.
Capacity planning can become very important, very quickly. But it’s not all that hard; all you need to do is pay a little attention to the right factors. The rest of the chapters in this book will show you how to do this. I’ll split up this process into segments:
1. Determining your goals (Chapter 2)
2. Collecting metrics and finding your limits (Chapter 3)
3. Plotting out the trends and making forecasts based on those metrics and limits (Chapter 4)
4. Deploying and managing the capacity (Chapter 5)
ARCHITECTURE AND ITS EFFECT ON CAPACITY
Your driving style affects your car’s mileage. A similar principle can be applied to web architectures. One of the recurring themes in this book will be how your website’s architecture can have a signifi-cant impact on how you use, consume, and manage capacity. Design has greater effect on the effective use of your capacity than any tuning and tweaking of your servers and network. Design also plays a large role in how easily and flexibly you can add or subtract capacity as the need arises.
11
Chapter 2
C H A P T E R T W O
Setting Goals for Capacity
Y
OU WOULDN’
T BEGIN MIXING CONCRETE BEFORE YOU KNEW WHAT YOU WERE BUILDING. S
IMILARLY,
you shouldn’t begin planning for capacity before you determine your site’s requirements. Capacity planning involves a lot of assumptions related to why you need the capacity. Some of those assumptions are obvious, others are not.For example, if you don’t know that youshould be serving your pages in less than three seconds, you’re going to have a tough time determining how many servers you’ll need to satisfy that requirement. More important, it will be even tougher to determine how many servers you’ll need to add as your traffic grows.
Common sense, right? Yes, but it’s amazing how many organizations don’t take the time to assemble a rudimentary list of operational requirements. Waiting until users complain about slow responses or time-outs isn’t a good strategy.
12 C H A P T E R T W O
Different Kinds of Requirements and Measurements
Now that we’re talking about requirements—which might be set by others, external to your group—we can look at the different types you’ll need to deal with. Your managers, your end-users, and your clients running websites with you, all have varying objectives and measure success in different ways. Ultimately, these requirements, or capacity goals, are interrelated and can be distilled into the following:
• Performance
— External service monitoring
— Business requirements
— User expectations
• Capacity
— System metrics
— Resource ceilings
Interpreting Formal Measurements
Your site should be available not only to your colleagues performing tests on your website from a facility down the road, but also to real visitors who may be located on other conti-nents with slow connections. Some large companies choose to have site performance (and availability) constantly monitored by services such as Keynote (http://keynote.com) or Gomez (http://gomez.com). These commercial services deploy worldwide networks of machines that constantly ping your web pages to record the return time. Servers then keep track of all these metrics and build you a handy-dandy dashboard to evaluate how your site performance and uptime appears from many locations around the world. Because Keynote and Gomez are deemed “objective” third parties, those statistics can be used to enforce or guide Service Level Agreements (SLAs) arranged with partner compa-nies or sites (we’ll talk more about SLAs later). Keynote and Gomez can be considered enterprise-level services. There are also plenty of low-cost alternatives, including PingDom (http://pingdom.com), SiteUptime (http://siteuptime.com), and Alertra (http://alertra.com).
It’s important to understand exactly what these services measure, and how to interpret the numbers they generate. Since most of them are networks ofmachinesrather than peo-ple, it’s essential to be aware of how those web pages are being requested. Some things to consider when you’re looking at service monitoring systems include:
• Are they simulating human users?
• Are they caching objects like a normal web browser would? Why or why not?
• Can you determine how much time is spent due to network transfer versus server time, both in the aggregate, and for each object?
S E T T I N G G O A L S F O R C A P A C I T Y 13 If you believe your service monitoring systems are testing in a manner representative of
your users when they visit your site, you have good reasons to trust the numbers. Also keep in mind, the metrics you use for capacity planning or site performance measurement might ultimately find their way onto an executive dashboard somewhere, viewed by a non-technical audience.
CFOs, CTOs, business development folks, and even CEOs can become addicted to qualita-tive assessments of operations. This can be a double-edged sword. On the one hand, you’re being transparent about failures, which can help when you’re attempting to justify expenditures and organizational changes to support capacity. On the other hand, you’re also giving a frequently obsessive crowd more to obsess about, so when there are any anomalies in this data, you should be prepared to explain what they mean.
Service Level Agreements
So what exactly is an SLA? It’s an instrument that makes business people comfortable, much like insurance. But in broader, less anxious terms, an SLA is a metric that defines how a service should operate within agreed-upon boundaries. It puts some financial mus-cle into the metric by establishing a schedule of credits for meeting goals, or possibly pen-alties if the service does not achieve them. With websites, SLAs cover mostlyavailability andperformance.
Some SLAs guarantee a service will available for a pre-established percentage of time, such as 99.99%. What this means is that 0.01% of the time, the service can be unavail-able, and it will still be within the bounds of the SLA. Other SLAs require that demand for a service stay within reasonable limits; request rate limits or storage and upload limits are typical parameters.
For example, you might find a web hosting company with something like verbiage below in its “Terms of Service” document:
Acme Hosting, Inc. will use commercially reasonable efforts to make the SuperHostingPlan available with a Monthly uptime percentage (defined below) of at least 99.9% during any monthly billing cycle. In the event Acme Hosting, Inc. does not meet this commitment, you will be eligible to receive a service credit as described below.
Looks pretty reassuring, doesn’t it? The problem is, 99.9% uptime stretched over a month isn’t as great a number as one might think:
30 days = 720 hours = 43,200 minutes 99.9% of 43,200 minutes = 43,156.8 minutes 43,200 minutes – 43,156.8 minutes = 43.2 minutes Monthly uptime percentage Credit percentage
14 C H A P T E R T W O
This means for 43.2 minutes every month, this service can go down without penalty. If your site generates $3,000 worth of sales every minute, you could easily calculate how much money any amount of downtime will cost you (along with the less measurable con-sequence of disgruntled customers). Table 2-1 shows percentages of uptime on a yearly basis.
The termfive-nines is commonly heard in discussions about SLAs and availability. This refers to 99.999% availability, and it is used in marketing literature at least as much as it is in technical literature. Five-nines is usually used to indicate your site or system is deemed to behighly available.
These SLA availability numbers aim to provide a level of confidence in a website’s service, but also imply you can equate downtime to lost revenue. I don’t believe this is actually accurate, as the straight math will bear out. If your service is unavailable for 10 minutes and it normally produces $3,000 of revenue every minute, then you might assume your business has lost $30,000. In reality, customers might just pick up where they left off and buy what they were in the process of buying when the outage occurred. Your business might be spending extra money on the customer service side to make up for an outage that has no impact on your earnings.
The point is, while a true and accurate financial representation of an outage may be nei-ther true nor accurate, the importance of availability should be clear.
Business Capacity Requirements
The use ofweb servicesis becoming more and more prevalent in today’s Web 2.0 mashup-y world. While most web services offer open APIs for individual application developers to build upon, business-to-business relationships depend on them as well. Therefore, compa-nies usually tie revenue streams to having unfettered access to an API. This could mean a business relationship relies on a certain level of availability, or performance of your API, measured in a percentage uptime (such as 99.99%) or an agreed-upon rate of API requests.
T A B L E 2 - 1.SLA percentages and acceptable downtimes
Uptime SLA Downtime per year
S E T T I N G G O A L S F O R C A P A C I T Y 15 Let’s assume your website provides postal codes, given various inputs to the API you’ve
built. You might allow only one API call per minute to a regular or non-commercial user, but a shipping company might enter into a contract permitting it to call your API up to 10 times persecond. Website capacity planning is as much about justifying capital expendi-tures as it is about technical issues, such as scaling, architecexpendi-tures, software, and hardware. Because capacity concerns can have such a large impact onbusiness operations, they should be considered early in the process of development.
User Expectations
Obviously, the end goal of capacity planning is a smooth and speedy experience for your users. Several factors can affect the user’s experience beside capacity. It’s possible to have plenty of capacity but a slow website nonetheless. Designing fast web pages is beyond the scope of this book, but you can find a lot of great information in Steve Souders’ excellent book,High Performance Web Sites (O’Reilly).
Even though capacity is only one part of making the end-user experience fast, that experi-ence is still one of the real-world metrics that we’ll want to measure and track in order to make forecasts.
For example, when serving static web content, you may reach an intolerable amount of latency at high volumes before any system-level metrics (CPU, disk, memory) raise a red flag. Again, this can have more to do with the construction of the web page than the capacity of the servers sending the content. But as capacity is one of the more expensive pieces to change, it warrants investigation. Perceived slowness of a web pagecould be the result of a page that is simply too heavy, and not from a lack of capacity. (This is one of the fundamentals of Souders’ book.) It’s a good idea to determine whether this is the case when any user-perceived slowness is analyzed. The problem can be solved by either 1) adding capacity, or, 2) changing the page weight. The first solution can sometimes involve more cost than solution two.
At Flickr, we serve tens of thousands of photos per second. Each photo server can serve a known and specific rate of images before reaching its maximum. We don’t define this maximum in terms of disk I/O, or CPU, or memory, but in terms of how many images we can serve without the “time to serve” for each image exceeding the specified amount of time.
Architecture Decisions
16 C H A P T E R T W O
Your architecture affects nearly every part of performance, reliability, and management. Establishing good architecture almost always translates to easier effort when planning for capacity.
Providing Measurement Points
Both for measurements purposes as well as for rapid response to changing conditions, you want your architecture to be designed so you can easily split it into parts that perform dis-crete tasks. In an ideal world, each component of the backend should have a single job to do, but it could still do multiple jobs well, if needed. At the same time, its effectiveness on each job should be easy to measure.
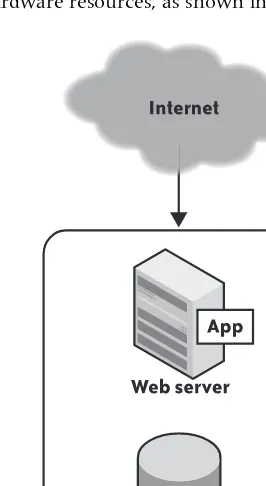
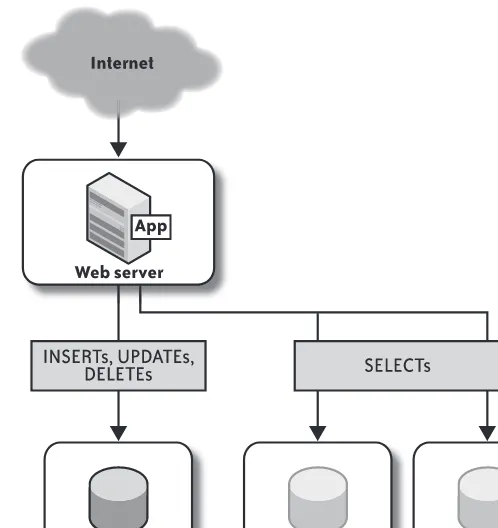
For instance, let’s look at a simple, database-driven web application just starting on its path toward world domination. To get the most bang for our buck, we have our web server and our database residing on the same hardware server. This means all the moving parts share the same hardware resources, as shown in Figure 2-1.
Let’s suppose you’ve already read Chapter 3 (cheating, are we?) and you have configured measurements for both system and application-level statistics for your server. You can measure the system statistics of this server viasarorrrdtool, and maybe even application-level measurements such as web resource requests or database queries-per-second.
S E T T I N G G O A L S F O R C A P A C I T Y 17 The difficulty with the setup in Figure 2-1 is you can’t easily distinguish which system
sta-tistics correspond with the different pieces of the architecture. Therefore, you can’t answer basic questions that are likely to arise, such as:
• Is the disk utilization the result of the web server sending out a lot of static content from the disk, or rather, the database’s queries being disk-bound?
• How much of the filesystem cache, CPU, memory, and disk utilization is being con-sumed by the web server, and how much is being used for the database?
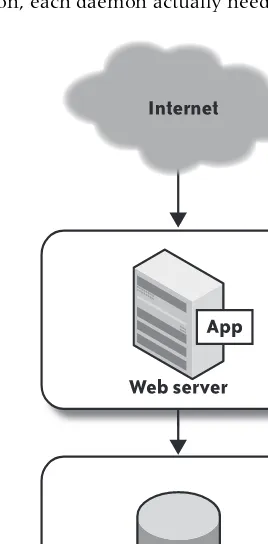
With careful research, you can make some estimates about which daemon is using which resource. In the best case, the resource demands of the different daemons don’t contend with one another. For example, the web server might be bound mostly by CPU and not need much memory, whereas the database might be memory-bound without using much CPU. But even in this ideal scenario, if usage continues to grow, the resource contention will grow to warrant splitting the architecture into different hardware components (Figure 2-2). At that point, you’d really like to know how much CPU, cache, disk space, bus bandwidth, and so on, each daemon actually needs.
18 C H A P T E R T W O
Splitting the nodes in this fashion makes it easier to understand the capacity demands, as the resources on each server are now dedicated to each piece of the architecture. It also means you can measure each server and its resource demands more distinctly. You could come to conclusions with the single-component configuration, but with less ease and accuracy. Of course, this division of labor also produces performance gains, such as pre-venting frontend client-side traffic from interfering with database traffic, but let’s forget about performance for the moment.
If we’re recording system and application-level statistics, you can quantify what each unit of capacity means in terms of usage. With this new architecture, you can answer a few questions that you couldn’t before, such as:
Database server
How do increases in database queries-per-second affect the following?
• Disk utilization
• I/O Wait (percent of time the database waits due to network or disk operations)
• RAM usage
• CPU usage
Web server
How do increases in web server requests-per-second affect the following?
• Disk utilization
• I/O Wait
• RAM usage
• CPU usage
Being able to answer these questions is key to establishing how (and when) you’ll want to add more capacity to each piece.
Providing Scaling Points
Now that you have a good idea of what’s required for each piece of this simple architec-ture, you can get a sense for whether you’ll want different hardware configurations.
At Flickr, for the most part, our MySQL database installations happen to be disk-bound, so there’s no compelling reason to buy two quad-core CPUs for each database box. Instead, we spend money on more disk spindles and memory to help with filesystem performance and caching. We know this to be our ideal database hardware configuration—for our data-base. We have different configurations for our image serving machines, our web servers, and our image processing machines; all according to what in-box resources they rely on most.
S E T T I N G G O A L S F O R C A P A C I T Y 19 Each server in our example possesses a finite amount of the following hardware resources:
• Disk throughput
• Disk storage
• CPU
• RAM
• Network
High loads will bump against the limits of one or more of those resources. Somewhere just below that critical level is where you’ll want to determine yourceiling for each piece of your architecture. Your ceiling is the critical level of a particular resource (or resources) that cannot be crossed without failure. Armed with your current ceilings, you can start to assemble your capacity plan. We’ll talk more about examples of ceilings in Chapter 3.
As you can see, changing architecture in simple ways can help you understand for what purposes your capacity is being used. When thinking about architecture design, keep in mind the division of labor and the “small pieces, loosely joined” theory can go a long way toward giving you clues as to how your site is being used. We’ll touch more on architec-ture decisions throughout the book, and particularly in Chapter 3.
Hardware Decisions (Vertical, Horizontal, and Diagonal Scaling)
Choosing the right hardware for each component of your architecture can greatly affect costs. At the very least, when it comes to servers, you should have a basic idea (gleaned from measurement and usage patterns) of where you want to invest your money.
Before perusing your vendor’s current pricing, be aware of what you’re trying to achieve. Will this server be required to do a lot of CPU work? Will it need to perform a lot of mem-ory work? Is it a network-bound gateway?
Today, the difference between horizontal and vertical scaling architectures are quite well known in the industry, but it bears reviewing in order to put capacity planning into context.
Being able to scalehorizontally means having an architecture that allows for adding capac-ity by simply adding similarly functioning nodes to the existing infrastructure. For instance, a second web server to share the burden of website visits.
Being able to scaleverticallyis the capability of adding capacity by increasing the resources internal to a server, such as CPU, memory, disk, and network.
20 C H A P T E R T W O
The danger of relyingsolely on vertical scaling is, as you continue to upgrade components of a single computer, the cost rises dramatically. You also introduce the risk of asingle point of failure (SPOF).
Horizontal scaling involves the more complex issue of increasing the potential failure points as you expand the size of the server farm. In addition, you inherently introduce some challenges surrounding any synchronization you’ll need between the nodes.
Diagonal scaling (a term coined by myself) is the process of vertically scaling the horizon-tally scaled nodes you already have in your infrastructure. Over time, CPU power and RAM become faster, cheaper, and cooler, and disk storage becomes larger and less expen-sive, so it can be cost effective to keep some vertical scaling as part of your plan, but applied to horizontal nodes.
What this all boils down to is, for all of your nodes bound on CPU or RAM, you can “upgrade” to fewer servers with more CPU and RAM. For disk-bound boxes, it can also mean you may be able to replace them with fewer machines that have more disk spindles.
As an example, I’ll take a recent Flickr upgrade.
Initially, we had 67 dual-CPU, 4 GB RAM, single SATA drive web servers. For the most part, our frontend layer is CPU-bound, handling requests from client browsers, making backend database calls, and taking photo uploads. These 67 machines were equipped with Intel Xeon 2.80 GHz CPUs running Apache and PHP.
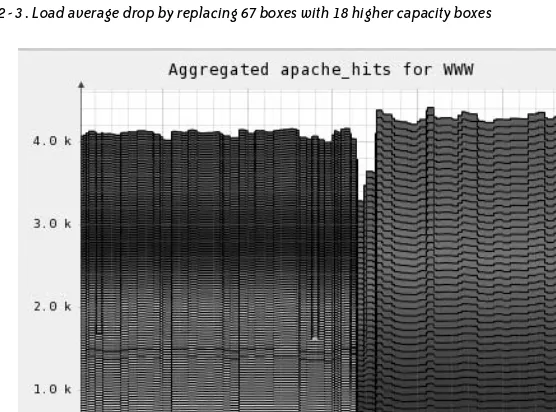
When it was time to add capacity, we decided to try the new Quad Core CPU boxes. We found the dual quad core machines had roughly three times the processing power of the existing dual CPU boxes. With 8 CPU cores of Intel Xeon L5320 1.86 GHz CPUs, we were able to replace 67 existing boxes with only 18 new boxes. Figure 2-3 illustrates how much the server load average (across the entire cluster) dropped as a result.
Figure 2-3 shows the reduction in load average when the 67 machines were removed from the production pool and the 18 new boxes were allowed to take over for the same production load. This certainly makes for a very dramatic-looking graph, but load average might not be the best metric to illustrate this diagonal scaling exercise.
Figure 2-4 represents the same time period as Figure 2-3, except it details the number of apache requests-per-second when the older servers were replaced. The shades of lines on the graph represent a single server, allowing you to clearly see when the newer servers took over. Note the amount of apache requests-per-second actually went up by as much as 400 after the replacement, implying the older machines were very close to their own bottlenecks.
S E T T I N G G O A L S F O R C A P A C I T Y 21
F I G U R E 2 - 3.Load average drop by replacing 67 boxes with 18 higher capacity boxes
F I G U R E 2 - 4.Serving more traffic with fewer servers T A B L E 2 - 2.Comparing server architectures
Servers CPU RAM Disk
Power (kW) at 60% of peak usage
22 C H A P T E R T W O
Based on traffic patterns, if we assume the servers are working at an average of about 60 percent of their peak, this means we’re using roughly 30 percent of the electrical power we were using previously. We’ve also saved 49U of rack space because each server needs only 1U of space. That’s more than one full, standard 42U rack emptied as a result of diag-onal scaling. Not bad.
Disaster Recovery
Disaster recovery is saving business operations (along with other resources, such as data, which we won’t consider in this book) after a natural or human-induced catastrophe. By catastrophe, I’m not implying the failure of a single server, but a complete outage that’s usually external to the operation of the website infrastructure.
Examples of such disasters include data center power or cooling outages, as well as physi-cal disasters, such as earthquakes. It can also include incidents, such as construction acci-dents or explosions that affect the power, cooling, or network connectivity relied upon by your site. Regardless of the cause, the effect is the same: you can’t serve your website. Continuing to serve traffic under failure conditions is obviously an important part of web operations and architecture design. Contingency planning clearly involves capacity man-agement.Disaster recovery (DR) is only one part of what is termedBusiness Continuity Planning (BCP), which is the larger logistical plan to ensure continuity of business in the face of different failure event scenarios.
In most cases, the solution is to deploy complete architectures in two (or more) separate physical locations, which means multiplying your infrastructure costs. It also means multi-plying the nodes you’ll need to manage, doubling all of the data replication, code, and configuration deployment, and multiplying all of your monitoring and measurement applications by the number of data centers you deploy.
23
Chapter 3
C H A P T E R T H R E E
Measurement: Units of Capacity
The only man who behaves sensibly is my tailor; he takes my measurements anew every time he sees me, while all the rest go on with their old measurements and expect me to fit them.
—George Bernard Shaw
I
F YOU DON’
T HAVE A WAY TO MEASURE YOUR CURRENT CAPACITY,
YOU CAN’
T CONDUCT CAPACITY planning—you’ll only be guessing. Fortunately, a seemingly endless range of tools is avail-able for measuring computer performance and usage. I’m willing to bet that moments after the first computer program was written, another one was written to measure and record how fast the first one performed.Most operating systems come with some basic built-in utilities that can measure various performance and consumption metrics. Most of these utilities usually provide a way to record results as well. Additional popular open source tools are easy to download and run on virtually any modern system. For capacity planning, your measurement tools should provide, at minimum, an easy way to:
• Record and store data over time
• Build custom metrics
• Compare metrics from various sources
24 C H A P T E R T H R E E
As long as you choose tools that can in some way satisfy this criteria, you don’t need to spend much time pondering which to use. What is more important is what metrics you choose to measure, and what metrics to which you pay particular attention.
In this chapter, I’ll discuss the specific statistics you’ll want to measure for different pur-poses, and show the results in graphs to help you better interpret them. There are plenty of other sources of information on how to set up particular tools to generate the measure-ments; most professional system administrators already have such tools installed.
Aspects of Capacity Tracking Tools
This chapter is about automatically and routinely measuring server behavior over a pre-defined amount of time. By monitoring normal behavior over days, weeks, and months, you’ll be able to see both patterns that recur regularly, and trends over time that help you predict when you need to increase capacity.
We’ll also discuss deliberately increasing the load through artificial scaling using methods that closely simulate what will happen to your site in the future. This will also help you predict the need to increase capacity.
For the tasks in this chapter, you need tools that collect, store, and display (usually on a graph) metrics over time. They can be used to drive capacity predictions as well as prob-lem resolution.
ACCEPTING THE OBSERVER EFFECT
Measuring your systems introduces yet another task your server will be asked to perform in order to function properly. Some system resources are going to be consumed for the purposes of collection and transfer of metrics. Good monitoring tools make an effort to be lightweight and not get in the way of a server’s primary work, but there will always be some amount of overhead. This means simply measuring your system’s resources will in some small way (hopefully, very small) affect the system’s behavior, and by extension, the very measurements you end up recording. This is commonly known as the “observer effect.”
M E A S U R E M E N T : U N I T S O F C A P A C I T Y 25 Examples of these tools include:
Cacti (http://cacti.net)
Munin (http://munin.projects.linpro.no/) Ganglia (http://ganglia.info)
Hyperic HQ (http://hyperic.com)
The tools don’t need to be fancy. In fact, for some metrics, I still simply load them into Excel and plot them there. Appendix C contains a more comprehensive list of capacity planning tools.
It’s important to start out by understanding the types of monitoring to which this chapter refers. Companies in the web operations field use the termmonitoring to describe all sorts of operations—generating alerts concerning system availability, data collection and its analysis, real-world and artificial end user interaction measurement—the list goes on and on. Quite often this causes confusion. I suspect many commercial vendors who align on any one of those areas exploit this confusion to further their own goals, much to our det-riment as end users.
This chapter isnotconcerned with system availability, the health of your servers, or notifi-cation management—the sorts of activities offered by Nagios, Zenoss, OpenNMS, and other popular network monitoring systems. Some of these tools do offer some of the fea-tures we need for our monitoring purposes, such as the ability to display and store metrics. But they exist mostly to help you recognize urgent problems and avoid imminent disas-ters. For the most part, they function a lot like extremely complex alarm clocks and smoke detectors.
Metric collection systems, on the other hand, act more like court reporters, who observe and record what’s going on without taking any action whatsoever. As it pertains to our goals, the term monitoring refers to metric collection systems used to collect, store, and display system and application-level metrics of your infrastructure.
Fundamentals and Elements of Metric Collection Systems
Nearly every major commercial and open source metric collection system employs the same architecture. As depicted in Figure 3-1, this architecture usually consists of anagent that runs on each of the physical machines being monitored, and a singleserverthat aggre-gates and displays the metrics. As the number of nodes in your infrastructure grows, you will probably have more than a single server performing aggregation, especially in the case of multiple data center operations.
26 C H A P T E R T H R E E
Round-Robin Database and RRDTool
RRDTool is probably the most commonly used utility for storing system and network data—at least for those using the LAMP stack. I’m only going to offer you an overview here, but you can find a full description of it on the “about” page and in the tutorials of its RRDTool website athttp://rrdtool.org.
The key characteristics of system monitoring data concern its size: there’s a lot of it, and it’s constantly increasing. Thus, ironically, you need to do capacity planning just for the data you’re collecting for capacity planning! The Round-Robin Database (RRDTool) utility solves that by making an assumption that you’re interested in fine details only for the recent past. As you move backward in the stored data, it’s acceptable to lose some of the details. After some maximum time defined by the user (say, a year), you let data disappear completely. This approach sets a finite limit on how much data you’re storing, with the tradeoff being the degree of detail as time moves on.
RRDTool can also be used to generate graphs from this data and show views on the vari-ous time slices for which you’ve recorded data. It also contains utilities to dump, restore, and manipulate RRD data, which come in handy when you drill down into some of the nitty-gritty details of capacity measurement. The metric collection tools mentioned earlier in “Aspects of Capacity Tracking Tools” are frontends to RRDTool.
Ganglia
The charts in this chapter were generated by Ganglia (http://ganglia.info). I had several rea-sons for choosing this frontend to present examples and illustrate useful monitoring practices. First, Ganglia is the tool we currently use for this type of monitoring at Flickr.
M E A S U R E M E N T : U N I T S O F C A P A C I T Y 27 We chose it based partly on some general reasons that might make it a good choice for you
as well: it’s powerful (offering good support for the criteria I listed at the beginning of the chapter) and popular. But in addition, Ganglia was developed originally as a grid manage-ment and measuremanage-ment mechanism aimed at high performance computing (HPC) clus-ters. Ganglia works well for Flickr’s infrastructure because our architecture is similar to HPC environments, in that our backend is segmented into different clusters of machines that each play a different role.
The principles in this chapter, however, are valuable regardless of which monitoring tool you use. Fundamentally, Ganglia works similarly to most metric collection and storage tools. Its metric collection agent is calledgmond and the aggregation server piece is called gmetad. The metrics are displayed using a PHP-based web interface.
SNMP
The Simple Network Management Protocol (SNMP) is a common mechanism for gather-ing metrics for most networkgather-ing and server equipment. Think of SNMP as a standardized monitoring and metric collection protocol. Most routers, switches, and servers support it.
SNMP collects and sends more types of metrics than most administrators choose to mea-sure. Because most networking equipment and embedded devices are closed systems, you can’t run user-installed applications, such as a metric collection agent likegmond. How-ever, as SNMP has long been a standard for networking devices, it provides an easy way to extract metrics from those devices without depending on an agent.
Treating Logs As Past Metrics
Logs are a great way to inject metrics into your measurement systems, and it underscores one of our criteria for being able to create custom metrics within your monitoring system.
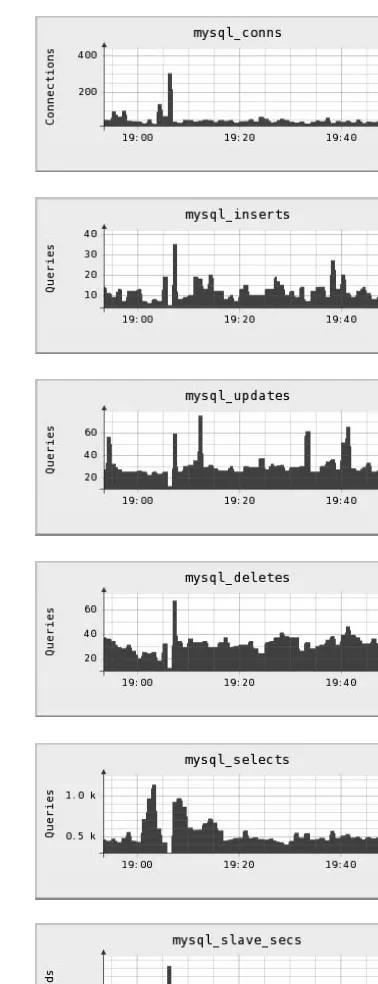
Web servers can log a wealth of information. When you see a spike in resources on a graph, you can often drill down to the access and error logs to find the exact moment those resources jumped. Thus, logs make problem identification easier. Most databases have options to log queries that exceed a certain amount of time, allowing you to identify and fix those slow-running queries. Almost everything you use—mail servers, load bal-ancers, firewalls–has the ability to create logs, either directly or via a Unix-style syslog facility. As an example, at Flickr we count the number of web server error and access log lines per minute and include those metrics into Ganglia’s graphs.
Monitoring As a Tool for Urgent Problem Identification
28 C H A P T E R T H R E E
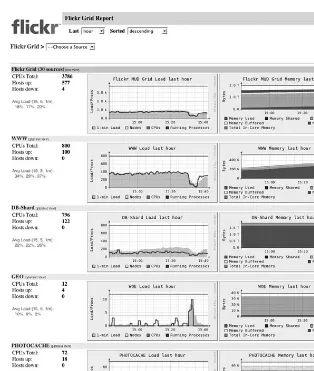
Figure 3-2 shows some anomalous behavior we once discovered on Flickr through Gan-glia. It represents several high-level views of some of Flickr’s clusters.
Without even looking into the details, you can see from the graphs on the left that some-thing unusual has just happened. These graphs cover the load and running processes on the cluster, whereas the groups on the right display combined reports on the memory usage for those clusters. The X axes for all of the graphs correspond to the same time period, so it’s quite easy to see the number of running processes (notably in the WWW cluster) dip in conjunction with the spike in the GEO cluster.
The WWW cluster obviously contains Apache frontend machines serving flickr.com, and our GEO cluster is a collection of servers that perform geographic lookups for features such as photo geotagging. By looking at this one web page, I can ascertain where the prob-lem originated (GEO) and where its effects were felt (all other clusters). As it turns out,
M E A S U R E M E N T : U N I T S O F C A P A C I T Y 29 this particular event occurred when one of our GEO servers stalled on some of its requests.
The connections from our web servers accumulated as a result. When we restarted the GEO server, the web servers gradually recovered.
When faults occur with your website, there is tremendous value in being able to quickly gather status information. You want to be able to get fast answers to the following questions:
• What was the fault?
• When did the fault occur?
• What caused the fault?
In this example, Figure 3-2 helped us pinpoint the source of the trouble because we could correlate the event’s effects (via the timeline) on each of our clusters.
Network Measurement and Planning
Capacity planning goes beyond servers and storage to include the network to which they’re all connected. The implementation details of routing protocols and switching architectures are not within the scope of this book, but your network is just like any of your other resource: finite in capacity, and well worth measuring.
Networks are commonly viewed as plumbing for servers, and the analogy is apt. When your network is operating well, data simply flows. When it doesn’t, everything comes to a grinding halt. This isn’t to say that subtle and challenging problems don’t crop up with networking: far from it. But for the most part, network devices are designed to do one task well, and their limits should be clear.
Network capacity in hosted environments is often a metered and strictly controlled resource; getting data about your usage can be difficult, depending on the contract you have with your network provider. As a sanity check on your inbound and outbound net-work usage, aggregate your outward-facing server netnet-work metrics and compare them with the bill you receive from your hosting provider.
When you own your own racks and switches, you can make educated decisions about how to divide the hosts across them according to the network capacity they’ll need. For example, at Flickr, our photo cache servers demand quite a bit from their switches, because all they do is handle requests for downloads of photos. We’re careful not to put too many of them on one switch so the servers have enough bandwidth.
Routers and switches are like servers in that they have various metrics that can be extracted (usually with the SNMP protocol) and recorded. While their main metrics are the bytesinandoutper second (or packets in and out if the payloads are small), they often expose other metrics as well, such as CPU usage and current network sessions.
30 C H A P T E R T H R E E
mean you’re not nearing CPU usage ceilings on those devices—all of those metrics should be monitored with alerting thresholds as well.
Load Balancing
Load balancers have been a source of much joy and pain in the field of web operations. Their main purpose is to distribute load among pools, or cluste