APPLICATION OF SURFACE MATCHING FOR IMPROVED MEASUREMENTS OF
HISTORIC GLACIER VOLUME CHANGE IN THE ANTARCTIC PENINSULA
M. Kunza,*, J. P. Millsa, P. E. Millera, M. A. Kinga, A. J. Foxb, S. Marshc a
School of Civil Engineering and Geosciences, Newcastle University, UK (*[email protected]) b
British Antarctic Survey, Cambridge, UK c
British Geological Survey, Keyworth, UK
Commission VIII, WG VIII/10
KEY WORDS: Glaciology, Glacier Change, DEM/DTM, Photogrammetry, Surface Matching
ABSTRACT:
Climate records show that the Antarctic Peninsula is rapidly warming. Dramatic changes in ice shelf and glacier extent have been recorded over the last few decades. Mapping recent changes in the Antarctic Peninsula is relatively straightforward, as increased amounts of earth observation data become readily available for scientific purposes. However, long term measurements of volumetric changes within the region are rare and less is known of changes which have occurred over the second half of the 20th Century. Nonetheless, historical observations are available in the form of archival aerial stereo-photography. However, extracting information from historical data, i.e. to compare it to recent data, is not trivial, and to-date, this data source remains largely untapped, despite its rich potential. Often such imagery is stored in non-digital format and may have degraded over time. Other problems relate to insufficient metadata or ground control. Typically these difficulties result in poor registration of multi-temporal DEMs, which degrade subsequent measurements of surface change. This is one of the fundamental limitations of accessing archival datasets. In this research a least squares surface matching technique is introduced to overcome these challenges and achieve reliable registration of multi-temporal DEMs. Historical imagery acquired in the 1960s for two Antarctic Peninsula glaciers is processed to extract DEMs, which are subsequently compared to DEMs derived from modern ASTER satellite data and aerial photography. Through the surface matching approach, it is shown that the registration accuracy of the historical and modern-day datasets can be improved significantly. This enables precise quantification of glacier elevation changes on a multi-decadal time scale. Frontal glacier surface lowering of up to 50 m was observed over the last ~4 decades. Results of this study allow a better understanding of historical volumetric glacier changes of the Antarctic Peninsula and provide an efficient and automated method for improved DEM co-registration.
1. INTRODUCTION
The Antarctic Peninsula (AP) is one the fastest warming regions of the planet, and has been shown to be particularly susceptible to the effects of global warming. Increased air and sea surface temperatures have led to dramatic changes in glacier and ice-shelf extent in recent decades (Meredith and King, 2005; Cook and Vaughan, 2010). Over the last 50 years more than 85 % of 244 observed glaciers showed retreat (Cook et al., 2005). An assessment of ice mass changes in the AP is very important to
derive estimates of the region’s recent and future contribution to
sea-level rise. However, records of long-term glacier mass balance of the AP are rare, and are generally excluded from global projections of sea-level rise (Lemke et al., 2007).
Repeated direct glaciological measurements are difficult given the harsh polar environment and mountainous terrain. However, airborne and satellite remote sensing offers an alternative tool for mapping of inaccessible areas. In particular, it has been noted that high-resolution satellite imagery, together with digital elevation models (DEM) derived from such imagery are well suited for the monitoring of glaciers (Oerlemans, 1998). In order to facilitate change analysis over extended time periods, a combination of historical and present-day stereo-imagery is ideal.
The British Antarctic Survey (BAS) and the United States Geological Survey (USGS) hold large archives of historical aerial stereo-photography of Antarctica, which have been acquired since the 1920s, and which include extensive portions of the AP. The full potential of these historical datasets, spanning several decades, has not yet been explored, despite the demand for multi-decadal observations. This is primarily due to the substantial challenge of reconciling source, multi-temporal and multi-resolution datasets in a manner which enables reliable change measurement and avoids the introduction of biases. Uncertainties, which may be introduced due to lack of ground control and other sources, will propagate into subsequent elevation measurements, leading to decreased accuracy in the assessment of elevation change.
of applications (e.g. Mitchell and Chadwick, 1998; Mills et al., 2005). This is an automated technique which minimises differences between overlapping DEMs by establishing point-to-point or point-to-surface correspondences. Previous research at Newcastle University has resulted in the development of a robust matching algorithm, which has been shown to perform well in the context of glacier change estimation in the Svalbard archipelago, Norway (Miller et al., 2009). The scale-stability of DEMs derived from ASTER satellite imagery appears to offer a solution for the registration of DEMs extracted from archival aerial imagery, overcoming the requirement for ground control and, at the same time, allows for historical ice volume change to be robustly determined (Miller et al., 2009).
In the research presented here, DEMs extracted from USGS archive stereo-photography of the AP are registered to DEMs derived from modern ASTER data and aerial photography by means of robust surface matching. A case study examining multi-decadal glacial volume change for two glaciers within the AP is presented, and the results are assessed to evaluate the potential of this approach for wider implementation through future work.
2. DATASETS AND TEST SITES
The USGS Earth Resources and Observation and Science (EROS) Data Centre holds a collection of over 330,000 single frame records of Antarctica from 1946-present. The data is freely available online via EarthExplorer (earthexplorer.usgs.gov). From this archive a minimum of three overlapping images was selected, for two sites in the western Antarctic Peninsula, with sufficient image contrast and clearly identifiable stable terrain to optimise the reliability of subsequently extracted DEMs.
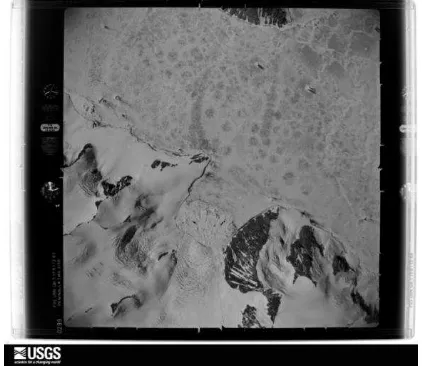
Figure 1: Antarctica Single Frame Record from January 1969 (nadir image, © USGS)
Most of these archive images were acquired by the U.S. Navy with a trimetrogon sensor configuration. This configuration is highly suited to rapid topographic mapping and consists of one nadir looking photograph, which is of particular interest here
(Figure 1), and two oblique looking photographs, with all three acquired simultaneously. To enable their use within modern digital photogrammetric workstations and to preserve information for future generations these single frame images have been scanned and converted to digital image format by the EROS Data Center. In this study the highest resolution scans, 25 microns (1000 dpi), were utilised. The original format size is approximately 9 x 9 inches. Metadata information is available but limited. Each frame has associated information relating to the focal length, lens type and acquisition date. Although the calibrated focal length and lens distortion parameters were available, more detailed camera calibration information was lacking. The only available calibration information was that found in a report on the calibration of military cameras (Spriggs, 1966). Ground control points (GCPs) were not available. Hence, the photogrammetric processing of this data is not straightforward.
The selected USGS image frames cover the front of Nemo glacier (January 1969; Figure 1), located approximately 67.33 °W and 67.71 °S on Pourquoi Pas Island, and the front of Leonardo glacier (November 1968), located approximately 61.91 °W and 64.68 °S. Both glaciers can be classified as marine terminating glaciers and are highly crevassed at the front. The surrounding terrain is steep and mountainous, which is typically for most of the Antarctic Peninsula.
As reference data for the for the Leonardo glacier site, modern ASTER satellite imagery (November 2001) was used. ASTER provides a favourable source of data for glaciological studies because it allows mapping in the visible, the near-infrared and the thermal parts of the electromagnetic spectrum. Importantly, it provides near global coverage, to ± 82° latitude which makes ASTER particularly attractive for polar studies. With a spatial resolution of up to 15 m, ASTER also offers relatively detailed analysis of surface processes. Utilising the along-track nadir viewing (band 3N) and backward viewing (band 3B, 27.7° off-nadir) imagery in the near-infrared portion of the spectrum, DEMs can be generated and ortho-images directly extracted.
The ASTER data was downloaded from NASA’s Land
Processes Distributed Active Archive Center (LP DAAC). For Nemo glacier present-day (February 2005) aerial stereo-photography with an accompanying 2 m DEM was available and provided by BAS. For this data, full camera calibration information was available.
3. DEM EXTRACTION
Additionally, an ortho-image was produced using the extracted DEM. Processing of the ASTER data was relatively straightforward compared to the archive imagery.
For the photogrammetric processing (interior, exterior, and absolute orientation) of the USGS aerial imagery, BAE Systems SOCET SET 5.5.0 was used. For automated DEM extraction the SOCET SET NGATE module was used. Individual frames and image blocks for each site were processed using the multi-sensor triangulation (MST) module within SOCET SET. The interior orientation of the USGS imagery is not trivial as fiducial mark coordinates were not available. However, the focal length and lens distortion parameters were known. The radial lens distortion parameters for the two Metrogon USGS camera lenses pertaining to the selected imagery are detailed in Spriggs (1966) and plotted graphically in Figure 2. The USGS frames contain four observable fiducial marks in the centre of each image side. For their reconstruction the image coordinates for each fiducial mark were measured using Adobe PhotoShop CS2 and the centre of the image was determined as the intersection between lines of opposing fiducial marks. The principle point was assumed to be located at (0,0) and the calculated intersection point gave the respective offsets to reduce the fiducial mark coordinates. The final fiducial marks coordinates were then calculated as the average of the reduced fiducial marks. The described lack of calibration information is not uncommon in studies that include archive imagery. The work-around as described here has been successfully adopted in other studies (Miller et al., 2007; Fox and Czifersky, 2008; Dornbusch et al., 2010). A new camera calibration file was created and the final interior orientation RMS was within 0.5 pixel.
Figure 2: Lens distortion for the two Metrogon T11 lenses
For the exterior orientation, at least 25, regularly distributed tie points per image per were measured automatically using the automatic tie point matching facility within SOCET SET. The resulting tie points were manually examined and adjusted or deleted if necessary. Additional points at varying elevations were added to strengthen the orientation solution. Distinctive features such as mountain ridges, rock outcrops or features on stable sea-ice were utilised. This produced a final exterior orientation RMS value of less than one pixel.
Because no ‘true’ GCPs were available, the absolute orientation
of the historical image strips proceeded by using information from the ASTER data and 2005 aerial photography. To achieve
an approximate absolute orientation, at least six ‘artificial’
GCPs were extracted from the present-day ortho-imagery and DEMs, at the location of distinct surface features. After achieving a successful absolute orientation solution, TIN-based DEMs were extracted from the historical imagery. Point extraction on a grid basis was avoided because oversampling can occur in areas with low image contrast such as snow covered areas (Fox, 1997). Depending on the reference data accuracy, the RMSxyz values of the absolute orientation of the historical DEMs were within ± 30 m when initiated by ASTER and ± 10 m for the modern aerial imagery.
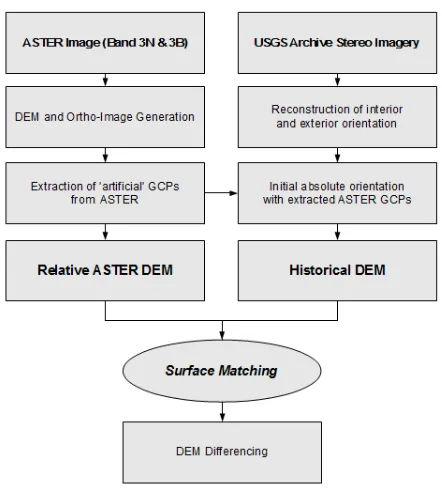
Figure 3: Workflow of DEM production and assessment using ASTER imagery and historical archive stereo-photography
without ground control.
However, despite the successful extraction of DEMs, the initial fit between the historic and the modern DEMs is too poor for the precise measurement of volumetric glacier change. This is because it is only possible to extract a minimal number of artificial GCPs from the present-day ASTER/aerial imagery, and the accuracy of the extracted points is relatively low in comparison to that which would be achieved through field survey. Consequently, the absolute orientation of the archival imagery using these points results in only an approximate alignment of the datasets. To overcome this limitation and to correct for remaining offsets between the DEMs a robust surface matching technique was applied. The complete workflow is summarised in Figure 3.
4. SURFACE MATCHING
2005; Zhang et al., 2006; Miller et al., 2009). This presents new challenges for how such datasets should be reliably combined, particularly under scenarios where direct access to the region of interest can prove difficult in terms of collecting control data. The goal of surface matching is to register an uncontrolled surface, in this case the historic DEM, to a reference surface in a way that differences between them are minimized (Mills et al., 2005).
In this research, a surface matching algorithm developed at Newcastle University is used to reconcile the DEM surfaces. This was initially developed for assessment of coastal change (Mills et al., 2005) and was subsequently applied to estimate glacier volume change in the Arctic (Miller et al., 2009). The underlying concept is that one surface is selected as the fixed
reference surface, while the other surface provides the ‘floating’
matching surface. The goal of the algorithm is to recover the unknown transformation parameters which will allow the matching surface to be rigorously aligned with the reference surface (Mills et al., 2005). The algorithm globally minimises the distance between points on the matching surface and corresponding patches on the reference surface through iterative least squares adjustment. The solution, which is applied to the matching surface, is a seven parameter 3D Helmert
transformation (Tx, Ty, Tz, ω, φ, κ, s). In this research, the
algorithm was further enhanced to facilitate minimisation of Euclidian distances (as well as vertical distances). Furthermore, a capacity to extend the transformation to nine parameters to account for independent scale distortions has also been implemented Such distortions may occur in the form of elevation dependent biases (Nuth and Kääb, 2010). Robustness of the solution is achieved by applying an M-estimator to the residuals, allowing outliers to be detected and down-weighted accordingly.
The matching was performed only for DEM regions which coincided with stable terrain, i.e. rock outcrops. Glacier or snow covered areas were excluded from the matching as they would bias the result due to a likely surface change. Convergence was achieved within less than 10 iterations and the final transformation parameters where then applied to all surface points for the archival DEMs. Finally, the surface elevation differences were computed and glacier change could be assessed. The accuracy and precision can be directly estimated from the matching statistics.
5. RESULTS
5.1. Surface Matching Performance
The surface matching was successfully applied between the historic and modern DEMs and resulted in a significant improvement in the accuracy. This is evidenced through the histograms of pre- and post-match elevation differences for points over stable terrain (Figure 4) at the Nemo glacier site. This indicates that following surface matching, mean difference value have been reduced to close to zero and are normally distributed, suggesting that systematic biases have been
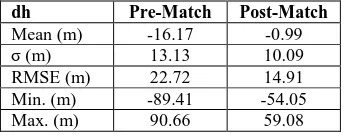
removed. Figure 4 also details the final transformation parameters which were applied to align the 1969 DEM with the 2005 surface. Table 1 details the difference statistics, and further supports this conclusion, with a mean elevation offset of -16.17 m prior to matching reduced to close to zero after the match. The remaining differences are attributed to the different spatial resolutions and random errors.
Figure 4: Histogram of level differences for points over stable terrain, at Nemo glacier, between 1969 USGS and 2005 aerial
photography DEM before and after surface matching.
The final transformation parameters reflect the uncertainty which existed through the initial absolute orientation. In the case of registering the USGS data to the present-day aerial imagery, the translations were relatively small and the scale is relatively stable. The rotational offsets may reflect an imperfect
distribution of the ‘artificial’ GCPs. However, the matching
provides a very good fit with the reference data. The derived solution is highly rigorous and benefits from the redundancy achieved through utilising a large number of DEM points, as
well a solution which provides a global ‘best fit’ in a least
squares sense.
dh Pre-Match Post-Match
Mean (m) -16.17 -0.99
σ (m) 13.13 10.09
RMSE (m) 22.72 14.91
Min. (m) -89.41 -54.05
Max. (m) 90.66 59.08
Table 1: Statistics of elevation differences over stable terrain, at Nemo glacier, between 1969 USGS and 2005 BAS DEM before
and after surface matching.
Similar results were found for the matching of the historic DEM to the ASTER data at the Leonardo glacier site. The translations for the final registration in this case are larger due to the lower accuracy and spatial resolution provided by the ASTER data. Pre-match offsets of up to ± 50 m are not unusual but could be successfully corrected with the technique applied here. An elevation dependent bias in the ASTER DEM was not observed.
relief gradients. However, a particular advantage of one technique over the other was not found.
5.1. Glacier change assessment
The successful DEM co-registration allowed glacier change measurements to be made. Figure 5 shows an elevation profile along the glacier front of Leonardo glacier. Substantial surface lowering can be observed while the glacier front remains relatively stable. The lowering is higher near the front and reduces further upstream. Maximum elevation changes of up to 50 m are observable which translates into an annual lowering of ~1.5 m/yr over the period of 33 years (1968-2001). Similar results were found for Nemo glacier where a lowering of up to 30 m (~0.8 m/yr) at the glacier front was observed (1969-2005). While the front of Leonardo glacier remains relatively stable over the observed period (see Figure 6), the front of Nemo glaciers shows significant retreat of ~165 m between 1969 and 2005 (not shown here). The frontal retreat was measured perpendicular to the glacier front in the ortho-imagery for both epochs.
Figure 5: Surface elevation profiles (dotted line in Figure 6) for Leonardo glacier, western AP (61.91° W, 64.68° S) for 1968
and 2001
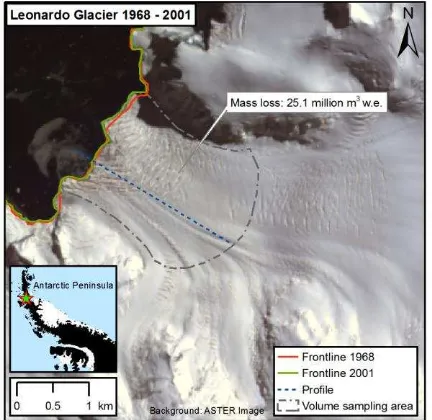
Figure 6: Satellite image of Leonardo glacier front in 2001 (dotted line represents profile in Figure 5)
DEM differencing also allowed the measurement of volumetric changes using ArcGIS. A glacier wide mass balance assessment was not possible because both glaciers were not completely covered by the imagery. However, it was possible to derive a specific surface mass balance, assuming an ice density of 0.917 kg/m3, for an area along the front of Leonardo and Nemo glacier. For Leonardo glacier (Figure 6) a mass loss of 25.1 ± 3.5 million m3 w.e. over an area of 3.6 km3 (1968-2001) was determined. The respective mass loss for Nemo glacier was 5.6 ± 0.6 million m3 over an area of 1.5 km2 (1969-2005). It should be noted, that higher elevation mass gains, due to increased accumulation of snow (Pritchard and Vaughan, 2007) might outbalance the observed loss. However, this aspect is yet to be examined. The overall trend from the results presented here is a mass loss along the glacier fronts.
6. DISCUSSION
The observed lowering is in agreement with observations of regional warming and glacier retreat in the AP over the last decades (Cook et al., 2005). The frontal lowering at Leonardo glacier (~64.7°S) is higher than at Nemo glacier (~67.7°S). If the observed glacier surface lowering is caused by atmospheric warming these differences could be explained by changes in the mean air and sea surface temperatures across the western AP (Meredith and King, 2005; Cook and Vaughan, 2010). The recently observed acceleration of glaciers in the AP (Pritchard and Vaughan, 2007) is likely to be connected to frontal thinning, as observed here.
Although, this study allowed the measurement of multi-decadal glacier change since the 1960s, the temporal resolution is too low for the assessment of changes between the decades till now. The glaciers studied here only represent a small section of the roughly 400 glaciers in the western AP. A better spatial and temporal resolution across the whole region is needed to answer the following questions:
When did the surface lowering begin to be significant? Is the lowering constant over time or has it changed at different rates?
Is the lowering evident for all glaciers in the AP and up to what altitude does the lowering occur?
What is the spatial pattern of change across the AP and how does it fit with climatic observations?
mass balance assessment remains difficult as most of the historical images do not cover entire glacier basins.
7. CONCLUSION
In this paper it has been demonstrated that surface matching is able to support and improve glacier elevation change measurements derived from multi-temporal, multi-resolution and multi-scale datasets. DEMs from archival aerial stereo-imagery from the 1960s were successfully extracted and co-registered to modern stereo-imagery and ASTER satellite data for sites within the Antarctic Peninsula. It was shown that the applied surface matching approach is particularly useful in studies without sufficient ground control or missing metadata. General surface lowering at the glacier fronts of up to 50 m over the last ~4 decades was observed. Given the extensive archives of historical aerial imagery which are yet to be explored, this work has the potential fill the gap of long-term glacier mass balance records for the Antarctic Peninsula.
ACKNOWLEDGEMENT
The authors would like to thank USGS for providing the ASTER data and camera calibration information for the historical imagery. This work was sponsored by British Geological Survey (BGS) and Natural Environment Research Council (NERC).
REFERENCES
Cook, A.J., Fox, A.J., Vaughan, D.G., and Ferrigno, J.G., 2005. Retreating glacier fronts on the Antarctic Peninsula over the past half-century. Science, 308(5721), pp. 541-544.
Cook, A.J. and Vaughan, D.G., 2010. Overview of areal changes of the ice shelves on the Antarctic Peninsula over the past 50 years. The Cryosphere. 4(1), pp. 77-98.
Dornbusch, U., Moses, C., Robinson, D.A., and Williams, R., 2010. Soft Copy Photogrammetry to Measure Shore Platform Erosion on Decadal Time Scales. Coastal and Marine Geospatial Technologies, 13(2), pp. 129-37.
Fox, A.J. and Nuttall, A.M., 1997. Photogrammetry as a research tool for glaciology. Photogrammetric Record, 15(89), pp. 725-737.
Fox, A.J. and Cziferszky, A., 2008. Unlocking the time capsule of historical aerial photography to measure changes in Antarctic Peninsula glaciers. Photogrammetric Record, 23(121), pp. 51-68.
Lemke, P., Ren, J., Alley, R.B., Carrasco, J., Flato, G., Fuji, Y., Kaser, G., Mote, P., Thomas, R.H., and Zhang, T., 2007. Observations: Changes in Snow, Ice and Frozen Ground. In: Climate Change 2007: The Physical Science Basis. Contribution of Working Group I to the Fourth Assessment
Report of the Intergovernmental Panel on Climate Change. Cambridge University Press, Cambridge, New York, pp. 337-383.
Meredith, M.P. and King, J.C., 2005. Rapid climate change in the ocean west of the Antarctic Peninsula during the second half of the 20th century. Geophysical Research Letters, 32, L19604. Miller, P.E., Mills, J. P., Edwards, S., Bryan, P., Marsh, S., Mitchell, H. & Hobbs, P., 2007. A robust surface matching technique for coastal geohazard assessment and management. ISPRS Journal of Photogrammetry & Remote Sensing, 63(5), pp. 529-542.
Miller, P.E., Kunz, M., Mills, J.P., King, M.A., Murray, T., James, T.D., and Marsh, S.H., 2009. Assessment of glacier volume change using ASTER-based surface matching of historical photography. IEEE Transactions on Geoscience and Remote Sensing, 47(7), pp. 1971-1979.
Mills, J. P., Buckley, S., Mitchell, H.L., Clarke, P., and Edwards, S., 2005. A geomatics data integration technique for coastal change monitoring. Earth Surface Processes and Landforms, 30(6), pp. 651-664.
Mitchell, H. L. and Chadwick, R. G., 1998. Mathematical shape matching as a tool in toothwear assessment - development and conduct. Journal of Oral Rehabilitation, 25(12), pp. 921-928.
Nuth, C. and Kääb, A., 2010. What's in an elevation difference? Accuracy and corrections of satellite elevation data sets for quantification of glacier changes. The Cryosphere Discussion, 4(4), pp. 2013-2077.
Pritchard, H.D and Vaughan, D.G., 2007. Widespread acceleration of tidewater glaciers on the Antarctic Peninsula. Journal of Geophysical Research, 112, F03S29.
Oerlemans, J., Anderson, B., Hubbard, A., Huybrecht, P., Johannesson, T., Knap, W.H., Schmeits, M., Stroeven, A.P., van de Wal, R.S.W., Wallinga, J., and Zou, Z., 1998. Modelling the response of glacier to climate warming. Climate Dynamics, 14(4), pp. 267-274.
Spriggs, R.M., 1966. The Calibration of Military Cartographic Cameras. U.S. Army Engineer Geodesy, Intelligence and Mapping R. & D. Agency, Technical Note, 66-2.
Zhang, T., Cen, M., Zhou, G., and Wu, X., 2006. A new method for debris flow detection using multi-temporal DEMs without ground control points. International Journal of Remote Sensing, 27(21), pp. 4911-4921.