STUDY OF WETLAND INFORMATION ENHANCEMENT APPROACH BASED ON
LANDSAT ETM DATA
Zhang Zhenhua a, *, Tian Shufangb,Dang Weic
a. China Aero Geophysical Survey & Remote Sensing Center for Land and Resources (AGRS),NO.31,Xueyuan Road,Haidian District,Beijing,100083,[email protected]
b. China University of Geosciences(Beijing) ,NO.29, Xueyuan Road,Haidian District,Beijing,100083,[email protected] c. Yunnan Bureau of Geological Survey,NO.87,Dongfeng Alley Dongfeng Road East,Kunming,Yunnan Province,
650051,[email protected]
KEY WORDS:Environment, Geology, Extraction,Landsat,Automation,Method
ABSTRACT:
Wetland is a versatile, rich biological diversity ecosystems on the planet which is one of the most important living environment of human beings. As the representative data of mid-resolution data, ETM data is widely used in Resources survey by its unique advantage in band set. Based on the analysis of water, terrestrial vegetation and aquatic vegetation’s spectral characteristic, this article uses ratio composite method (ETM band3/band5(R)、band2/band4(G)、band3/band7(B) to enhance water and wetland information combining with the band characteristics of ETM data. Practice has proved that this method has unique advantage in enhancing water and wetland information, and can improve the accuracy and efficiency in automatic Extraction of wetland information.
1. INSTRUCTION
Wetlands which are the planet’s most important ecosystem have high scientific research -value and will bring us both social and economic benefits. However, during to various natural and man made factors, more and more wetlands have converted to agricultural land and urban land. Now, the changes in wetlands’ area and quantity have caused public’s widespread concern. And wetland’s management and protection will benefit from the improvement of the wetland information abstraction’s precision. (
Pu Wang
and Wenxing Bao, 2011
)ETM data is used widely in wetland resources survey with its characteristics of moderate resolution, wide range cover, and band more, especially useful to large area and macro wetland monitoring. Improving the extraction precision and efficiency of the RS image is a difficult problem for many factors. Generally speaking, the most common method of enhancement currently is color composite. However, this method does not take full advantage of the spectral information of ETM data.In this paper, according to the characteristics of ETM data, we propose a new way to enhance wetland information in RS image on the basis of spectral analysis of water body, aquatic and terrestrial plants. This method improves the precision and efficiency of automatic extraction of wetland information.
2. OVERVIEW OF STUDY AREA
The study area-Lijiang-Dali area is located in western Yunnan province,99°45′E-100°45′E,25°30′N-27°N. The area’s terrain is large undulating, and landforms complex with mountains mainly. Humid climate, abundant rainfall. In the
combined effect of terrain and climate, many rivers and lakes developed which brings rich water resources. Because of the complex geological structure and the strong uplift in the recent Crustal movement, most rivers developed along the fault zone. High mountains and deep valleys, huge flow and large seasonal variation of water level made rivers have the characteristics of seasonal and plateau mountain. Most lakes of study area belong to highland lake, and the quantity is numerous, including Erhai Lake, Chenghai Lake, Jianhu and other major lakes. According to former study material, many wetland nature reserves have been established. (YangLan&Liheng, 2010)So; choose this area as study area is representative.
3. PRINCIPLE AND METHODS
3.1 Spectral Analysis of ETM Data
Landsat 7, launched on April 15, 1999, is the latest satellite of the Landsat program. Landsat 7's primary goal is to refresh the global archive of satellite photos, providing up-to-date and cloud-free images.Landsat 7 was designed to last for five years, and has the capacity to collect and transmit up to 532 images per day. The main instrument on board Landsat 7 is the Enhanced Thematic Mapper Plus (ETM+). (http://en.w-ikipedia.org/wiki/Landsat_7, 2009) Landsat 7 supplies high resolution visible and infrared imagery, with thermal imagery and a panchromatic image also available from the ETM+ sensor. Some of the parameters of this precision involve a scene’s radiometry, providing distinct characteristics to components of the image scene. These measures help determine what the images are good for, from a science perspective. For example, Bands 1, 2 and 3 are used together to approximate how the real
International Archives of the Photogrammetry, Remote Sensing and Spatial Information Sciences, Volume XXXVIII-4/W25, 2011 ISPRS Guilin 2011 Workshop, 20-21 October 2011, Guilin, China
world appears. Bands 4, 5 or 7 from ETM+ are used in combination with 1, 2 or 3 to demonstrate vegetation conditions. It is sometimes necessary to convert the radiometric values from the initial at-sensor measures, to compensate for atmospheric interference. (Global Land Cover Facility, 2004) But unfortunately, on May 31, 2003 the Scan Line Corrector (SLC) in the ETM+ instrument failed. The net effect is that approximately one-fourth of the data in a Landsat 7 scene is missing when acquired without a functional SLC. (http://en.wikipedia.org/wiki/Landsat_7, 2009)
Here, we should give more focus on band 7.This band is a geology band; the water show s black in this band. It is useful to geology and water application. The main parameters of ETM shows in the table 1.
Table1 the Main Parameters of ETM
3.2 Spectral Analysis of Water Body
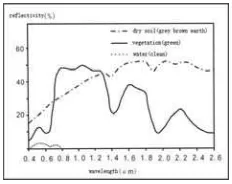
To the river and lake wetland, it can be considered as the water information extraction. The figure 1 is the Spectral curve of typical objects. From the figure and the band characteristic of ETM data, we can know that vegetation has higher reflectivity in band 4, band5 and band7, but lower in band 2 and band3.So in the group of band3/band5, band2/band4, band3/band7, the each ratio value of vegetation is much less than 1.But to water body, the results are just opposite. To rocks, the ratios are less than 1.From these, we can see that only the ratio results of water are much more than 1, and the water body shows white tone in RGB composite image(band3/band5(R) 、
band2/band4(G)、band3/band7(B)). In this way, the water body and the soil with water can be extracted exactly.
Figure 1. Spectral curve of typical objects
Figure 2. Spectral curve of aquatic and terrestrial plants
3.3
3.4
Spectral Analysis of Aquatic and Terrestrial Plants
Wetland is the transition region of water and land, so, how to determine the wetland boundaries in the remote sensing image is a difficulty in wetland information interpretation. Disting-uishing the aquatic and terrestrial plants is contributed to dete-rmine the wetland’s boundary because of their difference in species. Healthy green vegetation spectrum depends mainly on its leaves. In visible spectrum segment, the spectral characteris-tics of vegetation mainly dominated by the various pigments of leaves. In this band, the difference of spectral curve is not obvious between aquatic and terrestrial plants, aquatic plants’ reflectivity is little lower than terrestrial plants’ (figure 2). In near infrared spectrum segment, the spectral characteristics of vegetation mainly dominated by the cell structure in the leaves. The reflecting differences of plants in NIR are much more than in VIR because of the internal structure changes of different plants categories. From figure 2, we can see that the spectral curves of aquatic and terrestrial plants have significant differen-ces in near infrared band. For aquatic plants, the reflectivity is close in every band; the ratio results of band3/band5, ban-d2/band4, band3/band7 will be closer to 1, but much less than 1 for terrestrial plants. After histogram adjustment, the aquatic plants show bright red but dark purple to terrestrial plants in ratio composite image.
Enhancement approach
3.4.1 Data Processing:It’s very important to do radiometric correction processing to ETM data before band ratio, because it will influence the precision of information enhancement. Of course; orthorectification correction also should be done. This step can be done in ENVI.
3.4.2 Band Ratio Enhancement:According to the analysis above, we can see that the ratio composite image (ETM band3/band5(R)、band2/band4(G)、band3/band7(B)) has ad-vantage in highlighting water body and distinguishing between aquatic and terrestrial plants. We set ETM data of study area as an example to carry out study according to the approach described above and use band math and RGB composite in ENVI to done this step.
4. ENHANCED RESULTS ANALYSIS AND EVALUATION
The results show that water, aquatic and terrestrial plants are very clear in the ratio composite image, which are very important to automatic Extraction of wetland information.
International Archives of the Photogrammetry, Remote Sensing and Spatial Information Sciences, Volume XXXVIII-4/W25, 2011 ISPRS Guilin 2011 Workshop, 20-21 October 2011, Guilin, China
4.1 River and lake Wetland Results
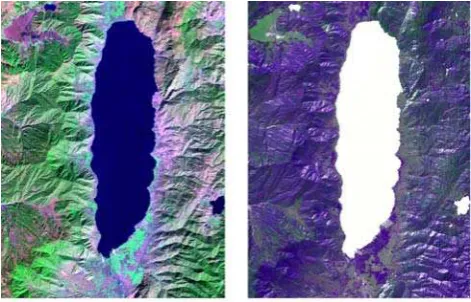
From figure 3, figure 4, we can see that the river and lake show white in ratio composite image because of rich water, and has significant difference with the surrounding surface features Although in the ETM 742 synthetic images, their characteristics are obvious, but in determining the rivers and lakes’ boundaries (inter-water line), the ratio enhanced image has a certain advantage.
Figure 3. River wetland enhanced results comparison
Figure 4. Lake wetland enhanced results comparison
4.2 Swamp WetlandResults
From figure 6, we can see that in ratio composite image, the aquatic plants show bright red that can be determined as swamp wetland easily and has significant difference with the surrounding surface features. In addition, we can determine the swamp wetland around the lake exactly, see figure 6.
Figure 5 Swamp wetland enhanced results comparison
Figure 6 Swamp wetland around the lake enhanced results comparison
5. CONCLUSIONS
Through the above experimental studies, it can be determined that this method can enhance the wetland information effectively, especially to distinguish swamp wetland, and has more advantages compared to the general enhancement method.
REFERENCES
[1] Pu Wang and Wenxing Bao, 2011.Wetland Information Ex-traction from RS Image Based on Wavelet Packet and the Active Learning Support Vector Machine. In: CCTA 2010, Part III, IFIP AICT 346, pp. 491–499.
[2] http://en.wikipedia.org/wiki/Landsat_7(accessed 15 July,20-11)
[3] Global Land Cover Facility,2004. Landsat Technical Guide. University of Maryland
[4] YangLan&Liheng, 2010. Wetland of Yunnan. China Forestry Publishing House,Beijing
International Archives of the Photogrammetry, Remote Sensing and Spatial Information Sciences, Volume XXXVIII-4/W25, 2011 ISPRS Guilin 2011 Workshop, 20-21 October 2011, Guilin, China