DEM EXTRACTION FROM CHANG’E-1 LAM DATA BY SURFACE SKINNING
TECHNOLOGY
Zhang Xiao-bin, Zhang Wu-ming *
State Key Laboratory of Remote Sensing Science, School of Geography, Beijing Normal University, 100875 Beijing,
China, Beijing Normal University, No. 19, XinJieKouWai St., HaiDian District, Beijing 100875, P. R. China
[email protected], and [email protected]
Commission IV, WG IV/7
KEY WORDS: DEM/DTM, Point Cloud, Surface Skinning, Chang’E-1, LAM
ABSTRACT:
DEM is a digital model or 3-D representation of a terrain's surface and it is created from terrain elevation data. The main models for DEM extraction based on Lidar data or Laser Altimeter data currently use the idea that point cloud is scattered, such as regular grid model, TIN model and contour model. Essentially, in these above methods, the discrete points are interpolated into regular grid data and irregular grid data. In fact, point cloud generated by Laser Altimeter is not totally scattered, but have some regularity. In this paper, to utilize this regularity, the proposed method adopts surface skinning technology to generate DEM from Chang’E-1 Laser Altimeter data. The surface skinning technology is widely used in the field of mechanical engineering. Surface skinning is the process of passing a smooth surface through a set of curves called sectional curves, which, in general, may not be compatible. In the process of generating section line, a need for attention is that it needs to use curvature method to get a set of characteristic points, and these feature points were used to subdivide segment; the next step is generating several curves on some key places. These curves describe the shape of the curved surface. The last step is to generate a curved surface that through these curves. The result shows that, this idea is feasible, useful and it provides a novel way to generate accurate DEM.
1. INTRODUCTION
A digital elevation model is a digital model or 3-D representation of a terrain's surface. Researchers have developed different methods for different applications. There are three most common models: regular grid model, irregular grid model and contour model. Among them, regular grid model can easily use the computer to process data, calculate some parameters like contour, and slope, and it has been the most widely used model; But, it cannot accurately describe the structure and details of terrain and the data amount is large, there are large amounts of data redundancy in the flat terrain. Irregular grid model change the sample density along with the change of the terrain, so it can reduce data redundancy and reflect the terrain change details. However, most of the existing methods use the idea that point cloud is scattered. In fact, sometimes, these points are not totally scattered, but have some regularity, such as curvature changes of point cloud and they are generated line by line.
In this paper, through the analysis of the characteristics of Chang’E-1 (CE-1) LAM data, we adopt surface skinning technology which is widely used in the field of mechanical engineering to generate DEM. We get the curvature changes of point cloud; and then generate series curves on some key places; at last, generate a curved surface that through these curves. This method uses curvature changes of point cloud and can more accurately describe details of terrain. What is more, the type of curve is B-Spline (Wang Wenke et al., 2008; Woodward C D et al., 1987) and we choose NURBS curved surface (Piegl L A, et al., 1996; Wang Chengxiang et al., 1996) to fit point cloud, as it has more function and we can use unified mathematical expression to describe various surface models. Compared accuracy of DEM generated by this method and DEM
generated by method that used in paper (Zou Xiao-duan, et al., 2011; LI ChunLai, et al., 2010), we can know that this method is feasible.
The paper is organized as follows. In next section, dataset and methods used in this paper is presented. Section 3 shows the result and discussion. Section 4 gives conclusions and the fifth part presents references.
LAM data:Laser altimeter is a main, effective payload on CE-1, and is used to measure the altitude of the whole Moon surface. About 9.12 million data were generated from November 28, 2007 to December 2008 and these data cover the whole surface of moon.
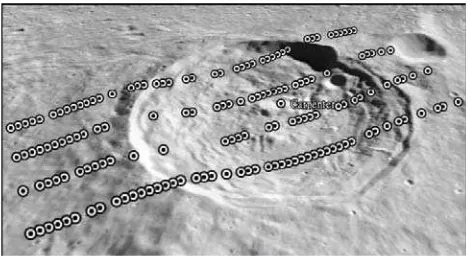
In this paper, we select the LAM data which covers “Carpenter” meteorite crater and surrounding area as the study area. The longitude and latitude of the centre of this meteorite crater is 69.40°N, 50.90°W. Figure 1 is the scene graph of the study area. This graph was captured from Google Moon.
In this paper, the coordinate system of original LAM data is moon-fixed coordinates system. Because the longitude ranges from 49 to 52 degree and the study area is located in the higher latitudes, so Gauss Kruger projection is used in this paper. Reference ellipsoid body is spherical with a radius of 1737400.0 meters. The central meridian is defined at 45 degree, and six degree method is chosen. What is more, to facilitate the calculation, the coordinates is centralized as data preprocessing. International Archives of the Photogrammetry, Remote Sensing and Spatial Information Sciences, Volume XXXVIII-4/W25, 2011
ISPRS Guilin 2011 Workshop, 20-21 October 2011, Guilin, China
Figure 2 shows point cloud that is processed by above processing step. Point cloud has four colours, and different colour representatives different scan line. There are altogether 4 track data in the study area.
Figure 1: Scene graph of the study area
Figure 2: Point cloud of study area
2.1.2 Validation data: DEM generated by method that used in lunar probing is used as the Validation data in this paper. After comparing and analysing the accuracy of different interpolation methods (Zou Xiao-duan, et al., 2011), it can be seen that Kriging method worked better than other methods in deriving DEM grid. Based on such a conclusion, we compared DEM generated in this paper with DEM generated by Kriging method (Oliver M A and Webster R, 1990). In addition, we used the same coordinate system in this data in order to compare with DEM generated in this paper. Figure 3 and Figure 4 shows the Validation data.
Figure 3: Point cloud that generated by Kriging method
Figure 4: Side view of point cloud that generated by Kriging method
2.2
2.2.1
2.2.2
Methods
Surface skinning is the process of passing a smooth surface through a set of curves called sectional curves, which, in general, may not be compatible. Detailed realization process is listed below:
Data preprocessing: It is necessary to have following operations in many cases, although these steps are omitted because of the characteristics of point cloud used in this paper(CAI Qing-hua, et al., 2003).
First of all, point cloud merging is needed. And then point cloud should be simplified, more points can be kept at the place that the curvature changes quickly and less points at the place that the curvature changes slowly. At last, quality control, for example, removing noise points is one of the necessary operations.
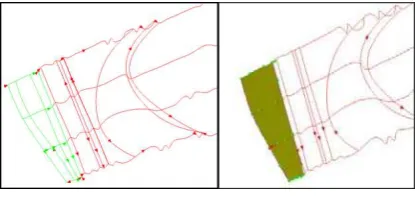
Curve fitting: When processing the point cloud, con-sideration of the characteristics of LAM data, firstly four main curves were generated along the scanning direction of point cloud. And all of them are B-Spline curves and they pass every point. Then, the curvature of every curve was calculated, and series key feature points where curvature changes were selected. And these feature points were used to divide 4 main curves into several sections. In the next step, according to the principle that degree of curvature change was similar, different sections that belong to 4 main curves were divided into different groups. At last, generating some necessary cross curves in each group, Figure 5 is a demo figure of fitting curve. Four green curves were classified to the same group and 3 red curves are cross curves in this group. From figure 6, we can see the final result of curves. From this figure, we can see the terrain changes in the study area, especially the edges of meteorite crater.
Figure 5: Demo figure of fitting curve International Archives of the Photogrammetry, Remote Sensing and Spatial Information Sciences, Volume XXXVIII-4/W25, 2011
ISPRS Guilin 2011 Workshop, 20-21 October 2011, Guilin, China
Figure 6: The result of fitting curves
2.2.3 Surface fitting: Figure 7 shows the process of fitting surface based on 8 green curves in this group, this surface through all of the curves and points in this group. A series of fitting surface can be generated by this method.
Figure 7: Demo figure of Fitting curve
2.2.4 Sampling on surfaces: After all of the surfaces were fitted, a smooth processing was applied to all of these surfaces. Then, regular grid data was obtained by sampling on these surfaces. Figure 5 shows the result after sampling process. Figure 6 shows the side view of point cloud and it describes the terrain changes of the study area clearly.
Figure 8: Point cloud after sampling on surfaces
Figure 9: Side view of point cloud after sampling on surfaces
3. RESULT AND DISCUSSION
In this paper, the difference between two average elevations of two methods is used to test the feasibility of the surface skinning method. Figure 10 shows the final superposition graph of two kinds of results.
Figure 10: Superposition graph of two kinds of results
From Figure 3, Figure 4, Figure 8 and Figure 9, we can clearly see that they have similar trend, however, the result of surface skinning had more clear details and was more close to real terrain. So, we can get a conclusion that surface skinning method is a feasible method and it also can provide more details of terrain change.
4. CONCLUSION AND FUTURE WORK
In this paper, a new method based on surface skinning technology is provided to generate DEM, this method fits series curves by using curvature change characteristics of point cloud and passes a smooth surface through these curves. Compared with DEM generated by Kriging method, surface skinning method was proved to be a feasible method and it also keeps more details. But, at the same time, it is necessary to do some improvements in the future work:
First of all, the operation of the man-computer interaction in select feature points in section 2 and group classification should be realized in automatic, so that, the uncertainty of the human impact can be reduced.
Secondly, in this paper, B-Spline curve was chosen to fit curves, but whether this curve type is the most appropriate type is also needed to identify. Different types of curves will be chosen to generate DEM and calculate their accuracy, and then the best curve type will be determined. NURBS curved surface adopted in this paper has the same situation.
Thirdly, accuracy evaluation method of DEM is also needed to pay more attention.
International Archives of the Photogrammetry, Remote Sensing and Spatial Information Sciences, Volume XXXVIII-4/W25, 2011 ISPRS Guilin 2011 Workshop, 20-21 October 2011, Guilin, China
5. REFERENCES
CAI Qing-hua, LIU Wei-jun,. 2003. Research on the previous process for point cloud data based on surfacer software. Mach-inery Design & Manufacture 4, pp.65-67.
LI ChunLai, REN Xin., 2010. Laser altimetry data of Chang’E-1 and the global lunar DEM model. SCIENCE CHINA EARTH SCIENCES 53(11), pp.1582-1593.
Oliver M A, Webster R., 1990. Kriging: A method of interp-olation for geographical information system. INT. J. GEOGR. INF. SYST. 4(3), pp. 313-332.
Piegl L A, Tiller W., 1996, Algorithm for approximate NURBS skinning. Compurer_Aided Design 28(9), pp.699-706.
Wang Chengxiang, Li Yuanjun., 1996. NURBS free-form surf-ace based on skinning surfsurf-ace. Journal of Hunan university 23(4), pp.77-81.
Wang Wenke, Zhang Hui. 2008. An error bounded algorithm for approximate B-Splinr surface skinning. JOURNAL OF
CO-MPUTER-AIDED DESIGN & COMPUTER GRAPHICS 20(11), pp.1474-1482.
Woodward C D., 1987. Cross sectional design of B-Spline surface. Computer &Graphics 11(2), pp.193-201
Zou Xiao-duan, LIU Jian-jun., 2011. Methods to derive lunar DEM from Chang’E-1 laser altimeter data. Science of Surve-ying and Mapping 36(1), pp.13-16.
6. ACKNOWLEDGEMENTS
This work is supported by National Natural Science Foundation of China Grant No. 40801131 and the National High-Tech Research and Development Plan of China Grant No. 2010AA122202. This work is also supported by the Special Foundation for Free Exploration of State Key Laboratory of Remote Sensing Science of China.
International Archives of the Photogrammetry, Remote Sensing and Spatial Information Sciences, Volume XXXVIII-4/W25, 2011 ISPRS Guilin 2011 Workshop, 20-21 October 2011, Guilin, China