Financials
Year to 31 December 12A 13A 14CL 15CL 16CL
Revenue (US$m) 40 42 37 48 119
Rev forecast change (%) - - (10.7) (8.6) (3.8)
Net debt/equity (%) 1.9 (17.7) 31.9 149.4 224.7
PB (x) 7.1 3.9 3.1 2.9 2.3
Source: CLSA
Stifanus Sulistyo
[email protected] +62 21 2554 8819
Abdullah Hashim
+62 21 2554 882728 October 2014
Indonesia
Petro/Chems
Reuters ESSA.JK
Bloomberg ESSA IJ
Priced on 23 October 2014
Jakarta Comp @ 5,024.3
12M hi/lo Rp3,550/1,600 12M price target Rp4,050 ±% potential +25% Shares in issue 1,100.0m Free float (est.) 40.9% Market cap US$295m 3M average daily volume
Rp0.5bn (US$0.0m)
Absolute (3.0) 47.1 35.4 Relative (0.9) 48.9 23.5 Abs (US$) (3.7) 40.6 24.7
Oct -12 Apr-13 Oct -13 Apr-14
Surya Esa (LHS)
Energy reform provides growth ammo
ESSA is one of indirect beneficiary of Indonesia energy reform as the country needs to tackle its energy trade balance issue. ESSA is benefiting from an upcoming Senoro Toili gas field where it will source the gas for the ammonia plant, which we expect to fivefold ESSA’s 2013 profit in 2017. Separately, we cut earnings forecast due to 9% lower LPG price assumption and sequentially cut the TP by only 5%. Post cut, ESSA growth outlook remains attractive with our TP implies 6x 17CL PE.
LPG price assumption cut, minimal impact to TP
LPG price trades 11% lower than its 10M14 average & 14% lower than 2013, in-line with oil/energy commodities price weakness. We trimmed our 14-15CL earnings by 11-13% on 11-9% lower LPG price assumption; earnings impact relatively mild for a commodity business due to the gas-linked purchase price. Our model suggests ~7% & ~2% 15CL & 17CL earnings sensitivity for every 5% movements in LPG price.
Asia ammonia shortage gives advantages to the Asian producers
Ammonia price (Middle East index) is strong, trades ~19% higher than its 2014ytd avg due to supply disruption; however its mid-longer term outlook is not that bullish as crops prices are weak that lead to less planting area by the farmers and eventually less fertilizers. Nevertheless, as a net importer, Asian ammonia producers have some advantages as the region is a net importer. This makes the Asian producers as one of the last one to go out of market in case of further ammonia weakness.
Energy reform derivative – reserve ammo
ESSA is one of the indirect beneficiaries of energy reform in Indonesia; we can look at ESSA as the derivative of it. Indo energy trade balance is heading to negative territory if Indo doesn’t fast-track the O&G production. When Indonesia increases its oil & gas production, petrochemical producers like ESSA could benefit by getting more resources allocation, more businesses
New TP implies 6x 17CL PE, 25% upside; BUY
LPG price assumptions cut, minimal impact to TP
At Arab Gulf LPG Propane & Butane price of US$735/mt & US$765/mt, LPG price trades at 11% lower than its 10M14 average and 14% lower than 2013. The price weakness is in-line with oil/energy commodities weakness; LPG price has relatively high degree of correlation (0.95x) with the oil price. We
trimmed our 14-16CL earnings by 8-13% mainly on the back of lower LPG price assumption.
Our model suggests ~7% 15CL earnings sensitivity for every ~5% LPG price movements. For 17CL onwards, our model suggests ~2% & ~4% earnings sensitivity for every 5% & 5% movements in LPG & Ammonia prices.
Figure 1 Figure 2
LPG & Brent prices LPG Price assumption
Source: CLSA, Bloomberg Source: CLSA, Bloomberg
We trimmed our 14-15CL LPG price assumption by 11-9% to US$800-782/mt. Note that ESSA gas purchase prices are linked to the each products ASP; it has floor price + escalation that linked to ASP. With this scheme, ESSA should be able to maintain LPG segment gross margin at 66-71% when LPG prices range from US$700-1000/mt.
Figure 3
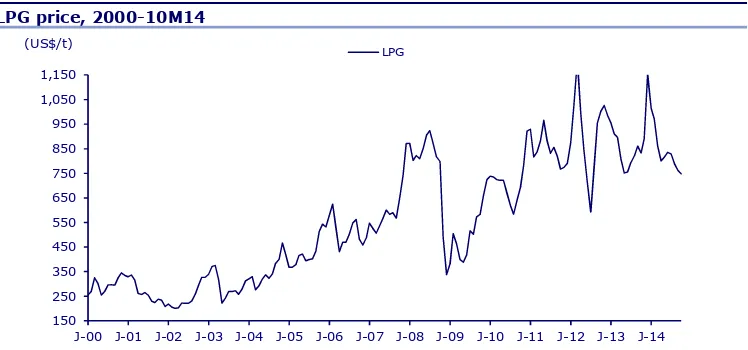
LPG price, 2000-10M14
Source: CLSA, Bloomberg
Commodity companies’ profitability is very sensitive towards the
commodity price movement as the production cost usually constant; profit will slump deeper than the revenue due to margin compression.
However, ESSA’s linked gas price purchase has allowed less profitability
volatility compared to commodity companies in general. y = 7.1275x + 78.78
800 782 805 829
854 880
2012 2013 14CL 15CL 16CL 17CL 18CL 19CL 20CL 21CL 22CL 23CL 24CL 25CL (US$/tons) CP Aramco Price Average
150
J-00 J-01 J-02 J-03 J-04 J-05 J-06 J-07 J-08 J-09 J-10 J-11 J-12 J-13 J-14 (US$/t)
LPG
As 4th week of October, ammonia price (Middle East index) trades at ~19% higher than 2014ytd average price. The strong Ammonia price in the short-term is attributable to gas supply disruption in Middle East and Ukraine; Ammonia mid-longer term outlook is not bullish as crops prices are weak that lead to less planting area by the farmers and eventually less fertilizers. However, Asian ammonia producers have some advantages:
Figure 4 Figure 5
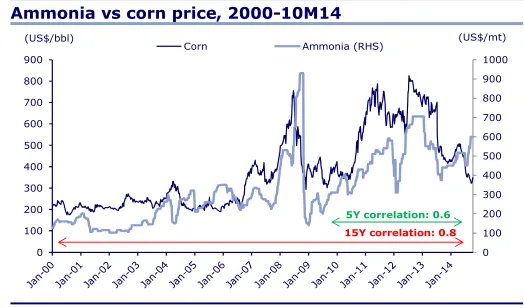
Ammonia vs Brent oil, 2000-10M14 Ammonia vs corn price, 2000-10M14
Source: CLSA, Fertecon, Bloomberg Source: CLSA, Fertecon, Bloomberg
Asia the net ammonia importer
Ammonia price has relatively high degree of correlation with oil in the past ~15years, however the correlation gets lower in the past 5 years (some argue) due to shale gas development and strong crop (corn) prices. Supply disruption will also affects short-term prices.
For Asian in particular, the region consumes more than it produces; China and India are the largest consumers in the region. From the projects in the pipeline, the East of Suez region (East Asia, Australia) is expected to continue
to become net ammonia importers (figure 7) according to Fertecon. The
region will likely to source its shortage from the Black Sea or Trinidad Tobago.
Figure 6 Figure 7
East of Suez net ammonia trade, 2000-25 East of Suez ammonia trade balance
Source: Fertecon Source: Fertecon
For Trinidad producers, transportation cost will add significant cost; it could double the cost, figure 10. For the Black Sea producers, they have higher cost structure due to gas purchase contract; put them as one of the marginal producers. Asia net import status has put ammonia price in the Far East (East Asia) region higher than the prices in the other regions, to close the
Brent Mid-East Ammonia (RHS)
Figure 8 Figure 9
Asia production & consumption Ammonia costs, 2014F
Source: Fertecon Source: Fertecon, CLSA
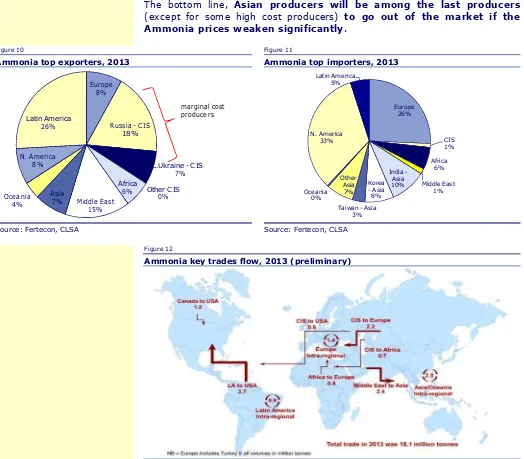
The bottom line, Asian producers will be among the last producers
(except for some high cost producers) to go out of the market if the
Ammonia prices weaken significantly.
Figure 10 Figure 11
Ammonia top exporters, 2013 Ammonia top importers, 2013
Source: Fertecon, CLSA Source: Fertecon, CLSA
Figure 12
Ammonia key trades flow, 2013 (preliminary)
Source: Fertecon
2012 2013 2014 2015 2016 2017 2018 2019 2020 2021 2022 2023 2024 2025 (mt)
Supply cost Freight cost to Far East average
As for ESSA, it has competitive production cost compared to the Black Sea and Trinidad producers + shielded by geographical (transport cost) advantages to the Asia market.
On the supply side: the key developments to watch is in the American region, where US is expected to get more ammonia supply that should lead to reduced import, which predominantly sourced from Trinidad Tobago. This situation eventually will force Trinidad producers to look for new market in other regions, most likely to the Far East where it has the biggest ammonia deficit. However, the freight rate from Trinidad to the Far East market is almost half of the production cost alone (2013).
We kept the ammonia price assumption. Our ammonia price assumption is quite conservative as we only assume ammonia price of US$505-495/mt in 2018-2020, lower than 2013A-14F price of US$581-545/mt and current price of close to US$600/mt. ESSA should be able to maintain ammonia business gross margin at +45% when ammonia prices is above US$400/t.
Figure 13 Figure 14
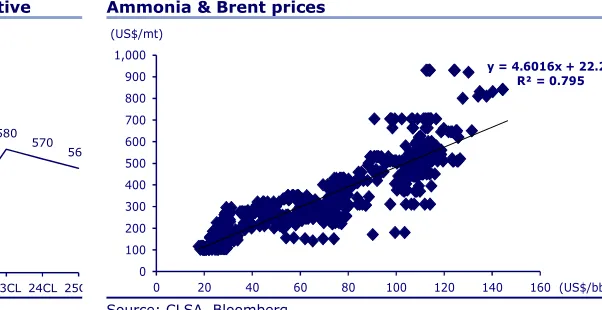
Ammonia price assumption, relatively conservative Ammonia & Brent prices
Source: CLSA, Fertecon Source: CLSA, Bloomberg
Debottlenecking shifted to 4Q14
ESSA postponed its LPG plant debottlenecking process from 3Q14
(September) to 4Q14 (October-November 2014). This resulted in lower profit in 14CL as previously we expect ESSA to be able to partially enjoy the additional LPG capacity and higher margin in 4Q14. ESSA has just proceeded
with the debottlenecking process in late October (4th week of October 2014).
We cut 14CL volume assumption by 1% and gross margins by 3% due to debottlenecking delay & lower LPG price assumption, while we keep the 15-16CL volume assumptions. ESSA plans to finish the debottlenecking in 4-6 weeks and we assume the conservative 6 weeks production shut down.
The debottlenecking will increase the ESSA’s LPG production capacity to 170t per day from 137 ton per day and increase the LPG segment profitability.
643
581 545
595 585
535 505
495 495
515 525 580
570 560
450 500 550 600 650 700
2012 2013 14CL 15CL 16CL 17CL 18CL 19CL 20CL 21CL 22CL 23CL 24CL 25CL (US$/tons)
Ammonia Price Average
y = 4.6016x + 22.26 R² = 0.795
0 100 200 300 400 500 600 700 800 900 1,000
0 20 40 60 80 100 120 140 160 (US$/mt)
Figure 15
LPG segment sales volume revision due to debottlenecking delay
Source: CLSA
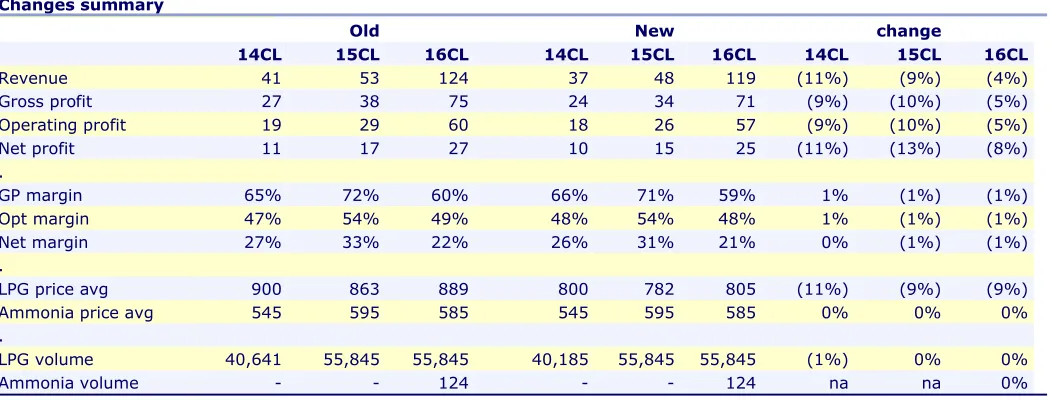
All in all, we cut 14-16CL revenue and earnings by 4-11% and 8-13%, respectively. The cut is predominantly due to change in LPG price assumption and slight LPG volume cut for 14CL only. We maintain our forecasts for the ammonia segment.
Figure 16
Changes summary
Old New change
14CL 15CL 16CL 14CL 15CL 16CL 14CL 15CL 16CL
Revenue 41 53 124 37 48 119 (11%) (9%) (4%)
Gross profit 27 38 75 24 34 71 (9%) (10%) (5%)
Operating profit 19 29 60 18 26 57 (9%) (10%) (5%)
Net profit 11 17 27 10 15 25 (11%) (13%) (8%)
.
GP margin 65% 72% 60% 66% 71% 59% 1% (1%) (1%)
Opt margin 47% 54% 49% 48% 54% 48% 1% (1%) (1%)
Net margin 27% 33% 22% 26% 31% 21% 0% (1%) (1%)
.
LPG price avg 900 863 889 800 782 805 (11%) (9%) (9%)
Ammonia price avg 545 595 585 545 595 585 0% 0% 0%
.
LPG volume 40,641 55,845 55,845 40,185 55,845 55,845 (1%) 0% 0%
Ammonia volume - - 124 - - 124 na na 0%
Source: CLSA
Energy reform derivative – reserve ammo
ESSA is one of the indirect beneficiaries of energy reform in Indonesia; we can look at ESSA as the derivative of it. We have been talking about the need
of energy reform in Indo in our Energizersreport. Indo energy trade balance
is heading towards negative territory (figure 2) if Indo doesn’t fast-track the oil & gas production. When Indonesia increases its oil & gas production, petrochemical producers like ESSA could benefit by getting more resources allocation, more businesses.
Separately, on the global level, ammonia supply shortage in Asia does not look sustainable and could lead to either demand destruction from a price
sensitive industrial sector or the stimulation of further new projects in
650 700
750
800 850
900
950 1,000
20 25
30
35 40
45
50 55
14CL 15CL 16CL 17CL 18CL
(US$/mt)
(US$mn)
LPG revenue old LPG revenue new
the region – Fertecon. Getting the supply from the Trinidad will incur expensive transport cost and supply from Black Sea has high cost base.
From ESSA side, we see the company has what it takes to execute any upcoming opportunities. ESSA has good track record, is run by professionals and backed by reputable financiers; almost all of the necessary ingredients for successful business ventures. What it needs is just more opportunities.
Indo energy sector dynamic + Asia’s ammonia shortage bode well for ESSA longer-term outlook.
Figure 17 Figure 18
Indo Gas export value and volume Indonesia’s total energy trade balance
Source: ESDM, Bloomberg, CLSA Source: BP, CLSA. We define energy trade balance as net exports of oil, gas & coal
From Energizersreport:
On the energy production side, Indonesia’s energy sector (oil, gas, coal) is not in good shape. Indonesia is at a critical point of deceleration, where the value of net energy exports is falling quickly from 3.5% of GDP in 2010 to 0.2% in 2014. Our sector model predicts Indonesia’s energy trade surplus to come to an end in 2017 as rising, domestic oil consumption finally outstrips the value of gas and coal exports.
Figure 19
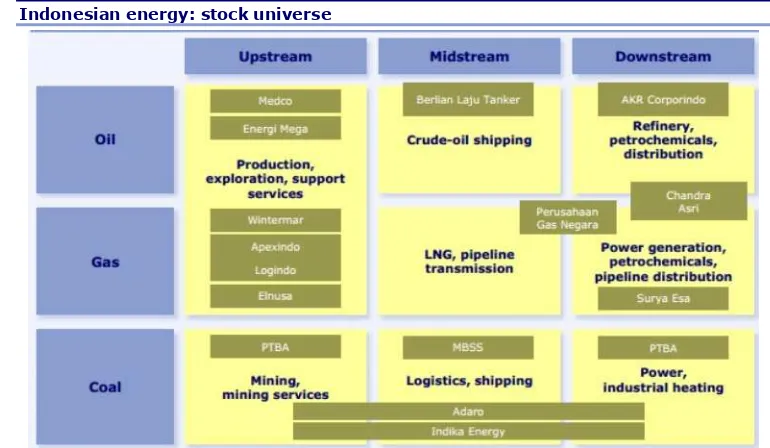
Indonesian energy: stock universe
Source: CLSA
New TP translate to 6x 17CL PE, 25% upside
Our SOTP valuation model suggests ESSA’s fair value at Rp4050/sh, 5% lower than previous TP. LPG business valuation is cut by 9% on ~9% lower LPG ASP assumption.
Figure 20
ESSA's SOTP
Valuation – DCF US$m Rpbn
LPG business 187 2,147
Ammonia business 201 2,308
SOTP 387 4,455
Equity value (Rpbn) 4,455
Share outstanding (bn) 1.1
Equity value / share (Rp) 4,050
Target price (Rp), rounding 4,050
Source: CLSA
Our new TP implies 16-6x 16-17CL PE and offers 25% upside.
We continue to like ESSA on the back of its solid execution track-record, savvy management team and upcoming ammonia project. As a petrochemical producer, we think there are upside risks in form of more projects / resources allocation when Indonesia increases its O&G outputs. While supply is pending, the demand is knocking through Asia ammonia supply shortage.
Figure 21
Changes summary
TP 14CL profit 15CL profit 16CL profit 17CL profit
Old 4250 11 17 27 67
New 4050 10 15 25 65
change (5%) (11%) (13%) (8%) (3%)
We use 12% WACC to value the LPG business and 14% CoE to value the ammonia business. Our LPG business valuation of Rp2.1tn (US$187mn) implies 12x 15CL PE; ESSA will still makes its earnings from LPG business only in 2015.
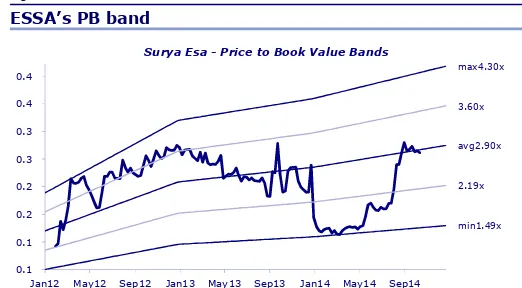
Figure 22 Figure 23
ESSA’s PE band ESSA’s PB band
Source: CLSA Source: CLSA
Figure 24
Comps
P/E EV/EBITDA GP Margin EBIT Margin Net Margin Ticker Market Cap 2014 2015 2014 2015 2014 2015 2014 2015 2014 2015
Surya Esa ESSA IJ 297 30 19 15 11 66% 71% 48% 54% 26% 31%
PTTGC PTTGC TB 8,212 9 8 7 6 9% 9% 7% 7% 6% 6%
Shanghai Petrochem 600688 CH 5,199 34 23 20 9 na na 1% 2% 2% 2%
Indorama IVL TB 3,507 27 19 11 10 9% 9% 4% 4% 1% 1%
Formosa Chem 1326 TT 13,113 19 19 16 15 6% 6% 3% 3% 6% 6%
Petronas Chemicals PCHEM MK 14,596 14 13 7 7 35% 36% 28% 28% 21% 21% Mitsubishi Chemical HC 4188 JP 7,135 24 16 9 7 20% 21% 3% 4% 1% 1%
Showa Denko 4004 JP 1,870 27 11 8 7 14% 14% 4% 4% 1% 1%
BASF BAS GR 79,798 12 11 7 7 26% 27% 11% 12% 7% 7%
CF Industries holdings CF US 12,701 13 12 7 7 41% 42% 41% 40% 27% 27% Potash corp of Sask. POT US 26,987 18 16 10 9 39% 45% 35% 38% 24% 24%
Agrium AGU US 12,414 15 11 9 7 22% 24% 8% 10% 7% 7%
Average 20 15 10 9 26% 28% 16% 17% 11% 11%
Source: CLSA, Bloomberg
min13.5x 17.5x avg21.4x 25.8x
0.1 0.2 0.2 0.3 0.3 0.4 0.4
Jan12 May12 Sep12 Jan13 May13 Sep13 Jan14 May14 Sep14 Surya Esa- Price to Earnings Bands
Source: CLSA Evalu@tor
min1.49x 2.19x avg2.90x 3.60x max4.30x
0.1 0.1 0.2 0.2 0.3 0.3 0.4 0.4
Jan12 May12 Sep12 Jan13 May13 Sep13 Jan14 May14 Sep14 Surya Esa - Price to Book Value Bands
Summary financials
Year to 31 December 2012A 2013A 2014CL 2015CL 2016CL
Summary P&L forecast (US$m)
Revenue 40 42 37 48 119
Op Ebitda 11 21 21 29 72
Op Ebit 9 18 18 26 57
Interest income 0 0 1 0 1
Interest expense (1) (1) (4) (6) (23)
Other items (1) 1 0 0 0
Profit before tax 7 18 14 20 35
Taxation (2) (5) (5) (5) (9)
Minorities/Pref divs 2 1 0 0 (1)
Net profit 7 13 10 15 25
Summary cashflow forecast (US$m)
Operating profit 9 18 18 26 57
Operating adjustments - - - -
-Depreciation/amortisation 3 3 3 4 15
Working capital changes 1 (2) 0 (1) (8)
Net interest/taxes/other (6) (5) (8) (11) (32)
Net operating cashflow 7 14 13 17 33
Capital expenditure (7) (19) (138) (324) (252)
Free cashflow 0 (5) (125) (307) (220)
Acq/inv/disposals - - - -
-Int, invt & associate div 0 0 1 0 1
Net investing cashflow (6) (19) (137) (324) (252)
Increase in loans (15) (6) 43 305 203
Dividends 0 0 0 0 0
Net equity raised/other 15 26 58 40 0
Net financing cashflow 0 19 101 345 203 Incr/(decr) in net cash 0 15 (23) 38 (16)
Exch rate movements - - - -
-Opening cash 21 21 36 13 51
Closing cash 21 36 13 51 34
Summary balance sheet forecast (US$m)
Cash & equivalents 21 36 13 51 34
Debtors 5 6 5 6 16
Inventories 1 1 1 1 3
Other current assets 1 2 2 2 2
Fixed assets 25 42 176 497 734
Intangible assets - - - -
-Other term assets 29 32 32 32 32
Total assets 81 118 228 589 822
Short-term debt 6 6 1 1 1
Creditors 3 2 2 3 7
Other current liabs 3 5 5 5 5
Long-term debt/CBs 16 14 62 367 570
Provisions/other LT liabs 1 1 1 1 1
Minorities/other equity 3 2 60 100 101
Shareholder funds 49 88 97 113 137
Total liabs & equity 81 118 228 589 822 Ratio analysis
Revenue growth (% YoY) - 6.9 (12.5) 31.1 146.1
Ebitda growth (% YoY) - 87.0 (2.0) 40.3 145.1
Ebitda margin (%) 29.0 50.7 56.8 60.8 60.6
Net profit margin (%) 18.9 31.4 26.5 31.4 20.7
Dividend payout (%) 0.0 0.0 0.0 0.0 0.0
Effective tax rate (%) 27.5 30.3 32.0 25.0 25.0
Ebitda/net int exp (x) 16.2 22.4 6.1 5.0 3.3
Net debt/equity (%) 1.9 (17.7) 31.9 149.4 224.7
ROE (%) 15.3 19.4 10.6 14.5 19.8
ROIC (%) 11.5 20.0 8.5 5.3 6.6
EVA®/IC (%) (3.5) 5.0 (6.5) (9.7) (8.4)
Companies mentioned
Surya Esa (ESSA IJ - RP3,250 - BUY)
Recommendation history of Surya Esa Perkasa Tbk ESSA IJ
Date Rec Target Date Rec Target
09 Sep 2014 BUY 4,250.00 Source: CLSA
Research subscriptions
To change your report distribution requirements, please contact your CLSA sales representative or email us at [email protected]. You can also fine-tune your Research Alert email preferences at https://www.clsa.com/member/tools/email_alert/.
Key to CLSA/CAST investment rankings: BUY: Total stock return (including dividends) expected to exceed 20%; O-PF: Total expected return below 20% but exceeding market return; U-PF: Total expected return positive but below market return; SELL: Total expected return to be negative. For relative performance, we benchmark the 12-month total forecast return (including dividends) for the stock against the 12-month forecast return (including dividends) for the market on which the stock trades. • We define as “Double Baggers” stocks we expect to yield 100% or more (including dividends) within three years.
©2014 CLSA Limited (for research compiled by non-Taiwan analyst(s)) and/or Credit Agricole Securities Taiwan Co., Ltd (for research compiled by Taiwan analyst(s)). Note: In the interests of timeliness, this document has not been edited.
The analyst/s who compiled this publication/communication hereby state/s and confirm/s that the contents hereof truly reflect his/her/their views and opinions on the subject matter and that the analyst/s has/have not been placed under any undue influence, intervention or pressure by any person/s in compiling such publication/communication.
CLSA group of companies (excluding CLSA Americas, LLC) (“CLSA”), Credit Agricole Securities Taiwan Co., Ltd. (“CA Taiwan”), CLSA/CA Taiwan's analysts and/or their associates do and from time to time seek to establish business or financial relationships with companies covered in their research reports. As a result, investors should be aware that CLSA and/or such individuals may have one or more conflicts of interests that could affect the objectivity of this report. Regulations or market practice of some jurisdictions/markets prescribe certain disclosures to be made for certain actual, potential or perceived conflicts of interests relating to research reports and such details are available at www.clsa.com/member/research_disclosures/. Disclosures therein include the position of CLSA, CLSA Americas, LLC and CA Taiwan only and do not reflect those of CITIC Securities International Company Limited, Credit Agricole Corporate & Investment Bank and/or their respective affiliates. If investors have any difficulty accessing this website, please contact [email protected] or +852 2600 8111. If you require disclosure information on previous dates, please contact [email protected]
IMPORTANT: The content of this report is subject to and should be read in conjunction with the disclaimer and CLSA's Legal and Regulatory Notices as set out at www.clsa.com/disclaimer.html, a hard copy of which may be obtained on request from CLSA Publications or CLSA Compliance Group (18/F, One Pacific Place, 88 Queensway, Hong Kong, telephone +852 2600 8888) and/or CA Taiwan Compliance (27/F, 95, Section 2 Dun Hua
South Road, Taipei 10682, Taiwan, telephone +886 2 2326 8188). 01/01/2014
1,000 2,000 3,000 4,000
S
to
c
k
p
ri
c
e
(
R
p
)
May 12 Sep 12 Jan 13 May 13 Sep 13 Jan 14 May 14 Sep 14 Stifanus Sulistyo
Other analysts No coverage
BUY U-PF N-R