Critical energy needs for the
Asian Century
Rapid growth has transformed developing Asia’s presence in the world economy. The region will likely continue to grow rapidly, further weighing, for better or worse, on global developments. Developing Asia’s gross domestic product (GDP) will more than quadruple from 2010 to 2035, and by 2050 the region will generate over half of global GDP. This promising vision of Asia’s 21st century is often called the Asian Century growth scenario, articulated in Asia 2050: Realizing the Asian Century (ADB 2011). Past growth has dramatically improved Asia’s living standards, lifting millions out of poverty. Future growth will do the same.
But, crucially, can developing Asia secure the energy it needs to fuel this dramatic economic expansion? Energy security rests on three pillars: the adequacy and reliability of physical energy supply, environmental sustainability, and affordable access. Where will this energy come from? Can the region expand its energy infrastructure to support its growing needs? Even if the adequate supply of energy is available, will it be environmentally sustainable and widely accessible and affordable? Failure on any of these fronts would hinder efforts to realize the environmentally sustainable, inclusive growth that lies behind the Asian Century ideal.
Energy and economic growth
In 2010, Asia contributed 28% of global GDP. If Asia follows the expected growth trajectory, by 2050 its per capita GDP will reach Europe’s current level, and its share of global GDP will nearly double to 52%, making about 3 billion additional Asians affluent (ADB 2011). Asia will already account for 44% of global GDP by 2035 (Figure 2.1.1).
This chapter was written by Minsoo Lee and Donghyun Park of the Economics and Research Department; and Harry Saunders of Decision Processes Incorporated. It draws on the background papers listed at the end of the chapter. Changyong Rhee, chief economist, provided guidance at various stages.
2.1.1 Developing Asia’s growing share of GDP and primary energy consumption, 2010–2035
2035 2010
GDP
28%
72%
44%
56%
34%
66%
51%
49%
Less optimistic energy use
56%
44% Rest of the world
Asia
Baseline energy use
Such economic expansion requires huge amounts of energy. Already in 2010, Asia accounted for 34% of world energy consumption. The link between the final energy used by firms and households, which rises as GDP expands, and an economy’s demand for primary energy depends on a complex host of factors (Box 2.1.1). But assumptions on the evolution of energy intensity—changes in the physical energy used to generate each unit of GDP—have big effects on forecast demand.
For example, if economic expansion raises by the middle of the 21st century energy consumption per capita for Asia’s 5 billion people to the level found today in industrialized economies, the region’s share of global energy use is projected to increase to 51% by 2035 (Figure 2.1.1 baseline). This is a conservative estimate, reflecting an optimistic projection of energy intensity trends. This baseline model endogenously projects energy intensity declining by 3.2% per year on average over the forecast horizon. This would bring energy intensity in 2035 down to 45% of its 2010 value— an improvement by better than half.
This compares with the historical trend from 1990 to 2000 of 2.47% improvement per year, which is used in the less optimistic scenario. If energy intensity follows its historical trend, Asia’s share of world energy consumption would be as high as 56% by 2035 (Figure 2.1.1, less optimistic).
2.1.1 The Asian Century scenario: energy consumption projections
Energy consumption forecasts derive from econometric analyses by country and sector. Demand equations are estimated using historical data of standard explanatory variables such as GDP, population, industrial production, and vehicle stocks. The econometric model incorporates changes in the structure of output and energy efficiency improvements. Future values of energy demand are then projected using the explanatory variables. The model thus takes into account the historical correlation between explanatory variables and energy consumption (box figure).
Broadly speaking, the econometric strategy begins by deriving final energy demand projections, from which it derives primary energy demand projections. “Final energy demand” refers to the consumption of final energy goods such as electricity and gasoline, and “primary energy demand” to the implicit demand for energy sources such as oil and coal required to meet final energy demand.
For all countries, data on key macroeconomic indicators such as GDP, population, and crude oil price are used as the bases for future projections of final energy demand. In addition, some countries have data on more detailed socioeconomic variables such as industrial production, vehicle stocks, number of households, and floor space, which provided additional inputs for these countries’ projections.
Transformation analysis examines the transformation of primary energy into final energy. Examples of transformation
include electricity generation, oil refining, gas processing, and coal transformation. Primary energy demand projections can be derived by energy type by combining final energy demand and transformation analysis. Net imports of final energy are also factored into primary energy demand projections, as are changes in energy policy.
Modeling framework
Transformation
Primary energy demand Final energy demand by sector
Coal Others
Coal Oil Natural gas Hydro Nuclear Others Import
minus Export
Macroeconomic assumptions (GDP, population, and crude oil price)
Energy intensity trends are hard to predict as they are driven by many factors beyond improved technical efficiency. The faster decline of energy intensity in the baseline scenario assumes improvements supported by changes in industry structure, slower industrialization in the People’s Republic of China (PRC), and productivity gains for non-energy inputs. This forecast is subject to greater uncertainty than the less optimistic scenario based on historical trend. Figure 2.1.2 shows the growth of energy consumption under the two scenarios. Asia’s energy consumption is projected to double from 2010 to 2035 even under the optimistic baseline scenario.
Note that this report’s baseline forecast shows the primary energy growth rate to be 2.82% annually from 2010 to 2035. This is quite consistent with the forecasts of other organizations (Table 2.1.1). Energy consumption grows despite substantial improvement in energy efficiency because of sharply increased per capita GDP. While Asia’s population is forecast to grow only modestly by 0.7% annually, Asians will drive more and use air-condition more as they become richer.
Composition of Asia’s energy demand
Aside from becoming higher, energy demand poses many challenges for developing Asia in terms of its composition. In particular, what is the mix of primary sources that will satisfy Asia’s growing thirst for energy? The current composition of Asia’s energy demand holds some important clues (Figure 2.1.3).Under the baseline scenario in Box 2.1.1, most of the twofold (202%) increase in energy consumption from 2010 to 2035 will come from fossil fuels. Coal use is expected to increase by 81% as oil consumption approximately doubles and natural gas use more than triples. The use of renewables is set to increase but will make a relatively small contribution to 2035 energy requirements. The same goes for nuclear power.
Subregional differences in energy demand and the energy mix will be substantial by 2035. Following the Asia 2050 study’s forecasts (ADB 2011), the scenarios allow for large differences in subregional growth rates in the next 2 decades. Regional GDP growth will likely be dominated by South and East Asia—South Asia because of its high potential growth rate and East Asia because its growth at about 6% builds on its existing large share of developing Asia’s GDP (the two subregions will jointly account for 83% of developing Asia’s GDP by 2035).
Aside from these different growth rates, different subregions rely on different energy mixes (Figure 2.1.4). Coal plays a much larger role in East and South Asia than in Central Asia, Southeast Asia, or the Pacific. Natural gas occupies a markedly bigger share of the energy mix in Central Asia than in the four other subregions. Relatively low demand
2.1.2 Sensitivity of energy consumption to the evolution of energy intensity, historical intensity trend (less optimistic) versus forecast trend (baseline)
3,000 6,000 9,000 12,000
Asia energy consumption (baseline) Asia energy consumption (less optimistic)
2035
MTOE = million tons of oil equivalent.
Source: Lee, Park, and Saunders, forthcoming.
2.1.3 Fuel composition for Asia’s energy requirements
0
MTOE = million tons of oil equivalent, NRE = new and renewable energy.
Source: Lee, Park, and Saunders, forthcoming.
2.1.1 Comparison of organizations’ energy consumption forecasts
British Petroleum (Asia-Pacific) 2.72 2010–2030 International Energy Agency
(New Policies Scenario, Asia)
2.20 2010–2035
Asian Development Bank 2.82 2010–2035
NRE
2.1.4 Primary energy demand, by Asian subregion
MTOE = million tons of oil equivalent, NRE = new and renewable energy.
Source: Lee, Park, and Saunders, forthcoming.
in the Pacific islands will be met by oil and natural gas in most countries. On the other hand, across all subregions coal, oil, and natural gas dominate while renewables and nuclear occupy only a limited share of the energy mix.
An achievable energy future for Asia
Energy consumption that more than doubles under the Asian Century vision poses a colossal challenge. Can it be achieved? Where will Asia find so much energy—over half the energy needed by the entire world in 2035? If the answer is that Asia cannot find it, the region will not realize the Asian Century. Asia faces a stark reality: Either it secures adequate energy supply or economic growth suffers accordingly. Even if Asia is able to secure enough physical energy supply, there remains the question of whether it can do so while safeguarding environmental sustainability and ensuring affordable energy for all. The three pillars of energy security are examined below, one by one.Adequacy and reliability implications
Coal is abundant in Asia, which has a 35% share of the world endowment (Table 2.1.2). Asia can reasonably expect to source coal from other regions if need be.Less abundant than coal in Asia is conventional natural gas, of which Asia has 16% of proven global reserves. The gas trade is widely distributed in terms of sources, though, and international trade in gas is growing. As such, Asia can expect to have relatively unfettered access to gas (Table 2.1.3).
Oil is different. And it poses the greatest threat to the adequacy of Asia’s physical energy supply. Proven reserves of crude oil in the region amount to a mere 9% of the world total. When combined with natural gas liquids, the Asian share is 15% of world reserves (Table 2.1.4).
Crude oil supply is by no means the only element of energy supply security, but it is the most problematic for Asia because of the region’s limited endowment and how it compensates. In 2010, Asia imported nearly half of all crude oil traded on international markets. If crude oil demand grows as projected in Figure 2.1.3, developing Asia’s oil imports will expand dramatically (Figure 2.1.5). Taking into account Asian production, Asia’s oil imports are expected to almost triple from 11 million barrels per day (MMBD) to over 31 MMBD by 2035, growing annually by 4.2%.
Disrupted flow of crude oil from the Middle East for an extended period would hit Asia hard. Worse, Asia’s refineries are configured to process mostly light Middle Eastern crudes and, unlike refineries in other regions, cannot immediately handle very heavy crudes. If the Middle East tap closed, Asia would be poorly equipped to switch to heavy crudes available from elsewhere.
Long-term oil security can be enhanced by substituting other fuels, but the short run lacks options. Asia uses oil largely for transportation (48% in 2010), which almost always requires readily portable energy. The convenience of liquid fuels for this purpose, the well-developed supply chain, and superior economics give petroleum products a huge advantage over alternatives. Biofuels offer some potential as substitutes for oil products, but they are unlikely to be commercially competitive within the forecast horizon.
Much of the projected surge in oil imports reflects the rapid expansion of motor traffic expected in Asia. The PRC’s
2.1.2 Proven reserves of coal, 2011
and lignite Total
Share of Total
(%)
Total North America 112.8 132.3 245.1 28.5
Total South and Central
America 6.9 5.62 12.52 1.5
Total Europe and
Eurasia 93.0 211.6 304.6 35.4
Total Middle East
and Africa 32.7 0.17 32.87 3.8
Australia 37.1 39.3 76.4 8.9
PRC 62.2 52.3 114.5 13.3
India 56.1 4.5 60.5 7.0
Indonesia 1.5 4.01 5.51 0.6
Japan 0.34 0.01 0.35 0.04
Kazakhstan 21.5 12.1 33.6 3.9
New Zealand 0.033 0.54 0.573 0.1
North Korea 0.3 0.3 0.6 0.1
Pakistan … 2.07 2.07 0.2
South Korea … 0.13 0.13 0.01
Thailand … 1.24 1.24 0.1
Vietnam 0.15 … 0.15 0.02
Other Asia Pacific 1.58 2.13 3.71 0.4
Total Asia and the
Pacific 180.8 118.62 299.42 34.8
of which: Developing
Asia 143.35 78.77 222.12 25.7
Developed Asia 37.47 39.85 77.32 9.0
… = data not available.
Notes: Anthracite is hard, high-energy coal; bituminous, sub-bituminous, and lignite are progressively softer kinds of coal with progressively less energy. Source: British Petroleum 2012.
2.1.4 Undiscovered technically recoverable oil and natural gas liquids
Asia and Pacific 53 9 25 15
Europe 10 2 3 2
North America 83 15 19 12
South America and Caribbean
126 22 21 13
Sub-Saharan Africa 115 20 28 17
Total 565 100 167 100
MMBNGL = million barrels of natural gas liquids, MMBO = million barrels of oil. Source: US Geological Survey 2012.
2.1.3 Undiscovered technically recoverable gas
Region
Mean estimate (trillion cubic meters)
Share (%)
Arctic + former Soviet Union 57 29
Middle East and North Africa 33 17
Asia and the Pacific 32 16
Europe 5 3
North America 20 10
South America and Caribbean 24 12
Sub-Saharan Africa 26 13
Total 198 100
Source: US Geological Survey 2012.
2.1.5 Projected Asian oil import requirements
0
vehicle fleet for passengers and goods is forecast to grow at over 6% annually (Figure 2.1.6). Rapid economic growth means that more Asians can now afford cars. Trading public transport for private cars is a natural consequence of Asia’s growing affluence and middle class, and it will further whet the region’s thirst for imported oil.
In addition to oil supply disruptions, threats to supply adequacy arise from potential interruptions of electricity and gas supply. Unreliable electric and gas systems can leave households without power and stymie industrial and commercial activity, causing heavy losses. India has experienced serious interruptions to electricity supply, with the July 2012 blackout in India affecting some 670 million people. In 2009, a dispute between Russia and Ukraine over pricing and transit costs for Russia’s gas prompted Russia to cut off all gas supplies to and passing through Ukraine, imposing wintertime supply disruptions on 18 European countries—and this dispute remains unresolved.
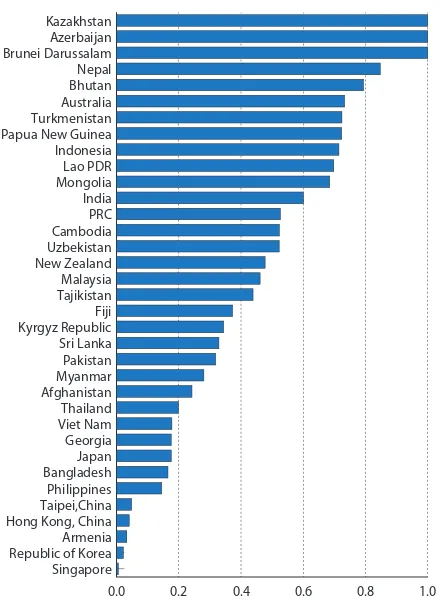
By 2035, most Asian countries will produce less than half the energy they need, and many will produce only a tiny
fraction. This means that Asia will remain heavily dependent on energy imports, in particular of oil, for the foreseeable future. More generally, securing adequate and reliable energy supply will persist as a difficult challenge across the region.
Figure 2.1.7 ranks Asian economies according to an index of energy self-sufficiency, in which a value of 1 indicates all primary energy demand is met with indigenous resources and a value of 0 indicates complete reliance on energy imports. The index is calculated based on each country’s projected primary energy mix until 2035 (e.g., how much it will use coal to generate electricity), its current proved indigenous reserves of fossil fuel, and its projected consumption until 2035 (Fueyo, Gómez, and Dopazo, forthcoming).
Only three countries in developing Asia—Azerbaijan, Brunei Darussalam, and Kazakhstan—are energy self-sufficient. Some economies have minimal self-sufficiency. Singapore and Hong Kong, China both have high demand for fossil fuels but no supply. As their energy sources were entirely imported even in 2010, their situation will change little by 2035. The Republic of Korea has limited fuel reserves—some coal and nuclear fuels, the latter perhaps largely uranium processed from imports. In 2010, the Republic of Korea imported about 80% of its primary energy (IEA 2012a). Indigenous reserves will be depleted by 2035. The share of hydropower is negligible at 0.02% of primary energy consumption, and other renewables’ share is only 2.1%.
Japan’s trends for economic growth and energy demand are unique in Asia, reflecting its economic maturity. Its GDP will grow very slowly between 2010 and 2035. Its primary energy consumption will fall by 15%, but hydropower’s share of primary energy will remain more or less constant at 1.5%, while that of other renewables will rise substantially from 2.1% to 15.7%.
2.1.6 Vehicle population forecast for PRC, 2005–2035
0
PRC = People’s Republic of China, SUV = sports utility vehicle.
Source: ADB 2006.
2.1.7 Asian countries’ energy self-sufficiency, 2035
0.0 0.2 0.4 0.6 0.8 1.0
PRC = People’s Republic of China, PDR = people’s democratic republic.
Note: The self-sufficiency index formula accounts for the share of renewable resources projected to be available, projected demand for conventional fuels, and corresponding depletion of conventional fuels given the country’s endowment.
Thailand, the Philippines, and Viet Nam will have self-sufficiency rates in 2035 similar to Japan’s. A major reason is that their energy consumption will grow much more quickly to fuel their faster economic growth. Country-specific factors matter. Thailand has considerable known reserves of coal and gas, but they will be depleted by 2035. The share of renewables remains constant at about 20%. In the Philippines, the contribution of renewables will shrink from 43% in 2010 to 14% in 2035, by which time proven indigenous gas and coal reserves will be depleted. While Viet Nam is endowed with significant oil and gas reserves and was a net energy exporter in 2010, rapid growth and a shift from traditional to modern energy sources will deplete its reserves by 2035. The share of renewables is projected to shrink from 43% to 17%.
Focus on environmental sustainability
If Asia does find the physical energy supply it needs to fuel its growth, what would be the impact on the environment? Expanding the region’s primary energy mix as currently projected would have serious consequences for theenvironment, both in Asia and globally. Local air and water quality, water availability, land use, and global climate all stand to suffer greatly if projected energy demand is met mostly by fossil fuels.
Local impacts on air, water, and land
The current picture of Asia’s energy future entails significant damage to the local environment. Toxic emissions from fossil fuels are already a serious problem. Air pollution degrades human health and drives up hospital admissions, and indoor air pollution causes premature death in women and children. Air pollution is caused largely by energy production and use. The energy and transport sectors generate 70% of nitrogen oxide emissions and 80% of emissions of sulfur dioxide and particulate matter (PM10, referring to particles that are less than 10 microns in diameter and therefore able to penetrate deep into the respiratory tract).
Sulfur dioxide emissions have grown in Asia, even per capita. Sulfur dioxide is responsible for the damage acid rain does to lakes and forests, and it poses serious human health risks. PM10 is an especially problematic air pollutant, its inhalation strongly associated with heart and chronic lung disease. Roughly half of PM10 pollution comes from power plants, 30% from transportation, and most of the remainder from wildfires and dust storms. Air pollution is projected to cause more than 3.6 million deaths per year by 2030 throughout the region, mostly in the PRC and India. With coal use projected to grow by over 50% during the forecast period, air quality problems associated with sulfur dioxide and PM10 are likely to continue, absent aggressive limits placed on
2.1.8 Cities with high particulate concentrations, 2008–2009
PM10 = particulate matter less than 10 microns in diameter. Note: Red bars represent cities in Asia.
toxic emissions. Further, more cars portend ever-deeper concerns about air quality, especially in urban areas.
Clean Air Asia, the regional network on air-quality management, aggregated data from more than 300 Asian cities in 2012 and found that PM10 concentrations were within safe targets in only 16 cities, most of them in Japan. This means that more than 94% of the cities sampled have air unsafe to breathe. Setting an air quality guideline of 20 micrograms of PM10 per cubic meter as safe for long-term exposure (WHO 2008), the World Health Organization ranks cities that average 100 micrograms per cubic meter or worse and finds 34 of the world’s 57 most polluted cities in Asia (Figure 2.1.8).
Like air quality, water availability fares poorly under Asia’s projected energy future. Burning fossil fuels to generate electricity requires lots of water for cooling. Further, oil, gas, and biofuel all require significant quantities of water to produce. Asia is already notably vulnerable to water scarcity, second only to Africa.
Fuelwood and biofuels present additional problems because the resulting deforestation causes social dislocation and the loss of natural carbon sinks and biodiversity. Present and projected demand for fuelwood exceeds the capacity of the natural ecosystem to supply it. Biofuels derived from corn, oil palm, and other crops displace food crops on farmland. Forests harvested for fuelwood or cleared to cultivate biofuels account for much of current change in land use.
Consequences for global climate change
The damage inflicted by Asia’s projected energy future affects not only the local environment but the global climate. If developing Asia continues to rely on fossil fuels, its energy-related carbon emissions (ignoring other greenhouse gas emissions) will more than double over the forecast period. By 2035 Asia will contribute nearly half of global carbon dioxide (CO2) emissions (IEA 2012a). The International Energy
Agency (IEA) calls the pathway under current worldwide policies unsustainable and emphasizes the need to build an energy pathway to limit global warming to 2 degrees Celsius above preindustrial levels, the target agreed under the United Nations Framework Convention on Climate Change. The World Energy Outlook, published annually by the IEA, refers to three scenarios of energy growth: the current policies scenario, with no change to policies in place; the new policies scenario, which includes countries’ commitments and plans even if specific measures are not yet announced; and the so-called 450 scenario, which the IEA proposes as the threshold for
preventing dangerous climate change. The 450 scenario calls for limiting CO2 emissions in the atmosphere to 450 parts per million. Figure 2.1.9 shows that under current forecasts developing Asia alone would emit more CO2 than is sustainable for the entire world.
This would have very serious consequences for Asia’s many
countries that are particularly vulnerable to climate change. Geography, climatology, low per capita income, and patterns of urbanization put Indonesia, the Philippines, Thailand, and Viet Nam at risk of losing 6.7%
2.1.9 Projected energy-related carbon dioxide emissions from developing Asia
0 10 20 30 40 50
IEA current policies scenario (world) IEA 450 scenario (world)
Developing Asia carbon dioxide emissions
2035 2030 2025
2020 2015 2010
Energy-related carbon dioxide emissions (billion tons)
IEA = International Energy Agency.
of their combined GDP by 2100 if temperatures change as the Intergovernmental Panel on Climate Change predicts. This is more than twice the global average of losses linked to climate change. Cambodia, the Lao People’s Democratic Republic (PDR), the Philippines, the Mekong Delta, central Thailand, and Sumatra and Java in Indonesia are more at risk than wealthier countries such as Brunei Darussalam and Singapore. The PRC and India could use up 1%–12% of their annual GDP coping with climate refugees, altered disease vectors, and failing crops.
Bangladesh, where 15% of the population lives within 1 meter of sea level at high tide, is prone to flooding, tropical cyclones, and storm surges—not to mention drought. In Cambodia, substantial human and crop losses are attributed to worsening drought and flooding that are likely only preludes to more extreme weather.
According to the Organisation for Economic Co-operation and Development (2010), 7 of the world’s 10 cities most exposed to climate change are in developing Asia (Table 2.1.5).
Cities are not the only places under threat. Large swathes of rural coastal areas in Asia are vulnerable to climate change. Parts of South Asia, including virtually all of Bangladesh and large
parts of Nepal, are at very high risk from climate change.
The imperative of affordable access
Assuming Asia can secure adequate physical energy supply to power growth and safeguard the environment, the challenge remains to ensure that energy is accessible and affordable. Energy is one of the most basic human needs, and therefore true energy security necessarily entails universal access to affordable energy. Affordable access to energy is a prerequisite for inclusive growth and the political support that makes policy effective.
Asia has the unfortunate distinction of harboring most of the world’s energy poor. Energy poverty perpetuates hunger by forcing women and children to gather fuel for hours on end that they would rather spend earning incomes or studying. Nearly half of the world’s people without electricity live in Asia, as do the majority of people who rely on
traditional fuels such as wood, charcoal, and dung. In 2010, 2.8 billion Asians, or 79% of the world population, relied on such traditional fuels, which provide low-quality energy while often destroying natural ecosystems (Figure 2.1.10).
Affordable access to modern energy is shockingly deficient in Asia. In 2010, some 18% of Asians, or 628 million
2.1.5 Cities most exposed to climate change
Rank Country City
1 USA Miami 416 3,513
2 PRC Guangzhou 84 3,357
3 USA New York–Newark 320 2,147
4 India Kolkata 32 1,961
5 PRC Shanghai 73 1,771
6 India Mumbai 46 1,598
7 PRC Tianjin 30 1,231
8 Japan Tokyo 174 1,207
9 PRC Hong Kong, China 36 1,163
10 Thailand Bangkok 39 1,117
11 PRC Ningbo 9 1,074
12 USA New Orleans 234 1,013
13 Japan Osaka–Kobe 216 969
14 Netherlands Amsterdam 128 843
15 Netherlands Rotterdam 115 826
16 Viet Nam Ho Chi Minh City 27 653
17 Japan Nagoya 109 623
18 PRC Qingdao 3 602
PRC = People’s Republic of China, USA = United States of America. Source: OECD 2010.
2.1.10 Asian proportion of those in energy poverty
Rest of the world Asia
Without basic energy service Dependent on traditional fuelsa
50% 50%
21%
79%
a
The traditional fuels category includes all types of solid fuels and kerosene, not just biomass.
Notes: Electrification numbers for Asia taken from 2012 Rapid Assessment and Gap Analyses and United Nations Development Programme Energy Country Briefs supplemented with World Bank population data for 2011. Global electrification and solid fuels numbers for non-Asian countries taken from IEA (2011a).
2.1.6 Number and share of population without modern energy services, 2010
Africa 590 57 698 68
Congo 58 85 63 93
Ethiopia 65 77 82 96
Kenya 33 82 33 80
Nigeria 79 50 117 74
Tanzania 38 85 42 94
Uganda 29 92 31 96
Other sub-Saharan Africa 286 66 328 75
North Africa 1 1 2 1
Developing Asia 628 18 1,814 51
Bangladesh 88 54 149 91
People’s Republic of China 4 0 387 29
India 293 25 772 66
Indonesia 63 27 128 55
Pakistan 56 33 111 64
Philippines 16 17 47 50
Viet Nam 2 2 49 56
Rest of developing Asia 106 34 171 54
Latin America 29 6 65 14
Middle East 18 9 10 5
Developing Countries 1,265 24 2,588 49
World 1,267 19 2,588 38
Source: IEA 2012a. individuals, had no electricity. In that year,
the percentage of population continent-wide without electricity and reliant on biomass for cooking was higher in Africa than in Asia, but some Asian countries such as Bangladesh approached the African average (Table 2.1.6).
Energy is a basic human need. It is required to heat and cool, prepare and preserve food, provide light, communicate, and operate modern conveniences, as well as to enable the delivery of social services like education, health, and recreation. Expanding access to energy for Asia’s legions of energy poor is a priority made all the more urgent because failure would perpetuate substantial public health hazards. Yet traditional fuels like kerosene, fuelwood, dung, charcoal, and coal still supply much of the energy used in Asia. Solid fuels dominate, with fuelwood claiming the largest share in most Asian countries (Figure 2.1.11).
Rapid growth can make the future better than the present. The IEA’s new policies scenario (including countries’ commitments and plans regarding energy use) projects that developing Asia’s population without electricity will decline substantially to 334 million by 2030, which translates into a decline from 18% to 8%.
The IEA is more pessimistic about movement away from traditional fuels, estimating that the number of people without clean cooking facilities in India in 2030 will still be more than twice the population of the United States today (IEA 2012a). It further estimates that achieving its vision of Energy for All, or universal access to modern energy by 2030, will require 3.5 times more investment to this end than is contemplated in the new policy scenario and 5.3 times investment in 2009. The current outlay is less than $10 billion globally. The additional investment will extend supply to heretofore unserved populations and build capacity to meet the additional demand.
2.1.11 Traditional fuel use by type for selected Asian countries Fuelwood
Dung Charcoal
Coal Kerosene
0 20 40 60 80 100
East Timor Cambodia Afghanistan Lao PDR Myanmar Solomon Islands Papua New Guinea Bangladesh India Nepal Pakistan PRC Vanuatu Indonesia Thailand Samoa Viet Nam Bhutan Sri Lanka Mongolia Fiji Philippines
Malaysia Taipei,China Brunei Darussalam Singapore
%
PDR = people’s democratic republic, PRC = People’s Republic of China.
Source: Sovacool 2012.
and affordability is not preordained, as these projections assume that the cost of electricity reflects the forecast mix of primary energy used to generate it. As we have seen, this mix creates a number of thorny environmental problems, as well as broadly worsening energy security (Box 2.1.2).
The less-optimistic scenario for Asia’s energy future, based on current trends, paints a stark picture. It suggests that Asia will be hard pressed to secure enough energy supply to achieve the rapid growth required for widespread poverty reduction. Further, high growth in energy supply needs to be accompanied by significant quality changes to protect the environment and ensure affordable access. This threefold challenge of energy supply adequacy, environmental sustainability, and affordable access requires a multipronged approach. The region needs to aggressively explore all options by which to curb its burgeoning energy demand, tap new energy supply, and foster regional market synergies that maximize the gains achieved on both sides of the demand–supply equation.
2.1.12 Projected energy affordability in Asia
Developing Asia Central Asia
East Asia
The Pacific
South Asia Southeast
Asia
Developed Asia 0 1 10
0 1 10
Expected electricity outlay 2035 (% GDP per capita)
Expected electricity outlay 2012 (%GDP per capita) Affordability is the same in 2012 and 2035
Affordability improves Affordability
worsens
2.1.2 Recent trends in energy security: some evidence from an index
Sovacool et al. (2011) ominously points to stagnant or declining energy security in Asia and the Pacific. The study assessed the performance of 18 countries in the region on energy security based on 20 indicators spread broadly across energy supply, affordability, efficiency and innovation, environmental stewardship, and governance. The assessment informed an energy security index that included all
Southeast Asian nations, as well as the PRC, India, Japan, and the Republic of Korea. Australia, the European Union, the US, and New Zealand were included as benchmarks. This study then assessed national progress in 5-year increments from 1990 to 2010 in two ways: The first rated the country’s average overall or absolute performance for 1990–2000. The second took a temporal perspective that looked at how each country improved or regressed.
Box figure 1 shows that the top three performers were Japan, Brunei Darussalam, and the US. The worst were Viet Nam, India, and Myanmar. Higher score refers to better energy security performance. The bar shows the energy security index for each country and the value ranges from 0 to 100. Box figure 2 shows that Myanmar suffered the largest deterioration of energy and environmental security, a 63% decline, between 1990 and 2010. The best improvers were Malaysia, Australia, and Brunei Darussalam.
This study raises three main points. First, most countries have improved their energy security only marginally or else regressed. Interestingly, even the best performers fell far short of a perfect score of 100. Japan and Brunei Darussalam scored favorably on barely more than half of the metrics, and the fourth-placed US scored favorably on only one-third. This conclusion is discouraging in light
of all the apparent progress that has been made since the 1970s: the creation of the IEA, the rapid growth of renewable energy, the rise of energy efficiency and demand management, and research on cutting-edge technologies. Despite these frenetic efforts, the index suggests that energy security in most countries has stagnated or even weakened.
Second, the index reveals great disparity. Japan, a strong leader, did not leave improving energy security to the marketplace. Its experience underscores the importance of government intervention. The success of Japanese energy policy arose from coordinated and consistent political support for policy and aggressive investments to achieve ambitious targets.
Third, the study reveals the difficult tradeoffs among components of energy security. Japan achieved its low energy intensity, advanced technology, and mitigation of greenhouse gas emissions only with large government subsidies and comparatively high prices for energy services. The Lao PDR has a small carbon footprint and high penetration of hydroelectricity but has prioritized exporting energy rather than expanding domestic access, though it is now seeking to expand hydropower supply to the domestic market. Dam construction continues to erode environmental quality, and the country remains completely dependent on imported oil to fuel transport. Myanmar’s extreme export-oriented energy strategy can leave its population literally in the dark, its favorable score on environmental indicators reflecting only limited capacity and poor access. The fundamental problem is that some elements of energy security, such as affordability, apparently come only at the expense of others, such as sustainability and efficiency. Perhaps in recognition of this, Myanmar is beginning to change its export-oriented strategy.
1 Energy and environmental performance absolute score for selected countries, 1990–2010
0 10 20 30 40 50 60
EU = European Union, PDR = people’s democratic republic, PRC = People’s Republic of China, USA = United States of America.
Source: Sovacool et al. 2011. 2 Change in energy and environmental performance score
of selected countries, 1990–2010 (%)
–0.8 –0.6 –0.4 –0.2 0.0 0.2 0.4
EU = European Union, PDR = people’s democratic republic, PRC = People’s Republic of China, USA = United States of America.
Containing burgeoning energy demand
Asia enjoys an array of promising options to check its energy appetite. Regional governments do not have to look far for a compelling example of the potential for demand management. Japan depends almost entirely on imported energy, especially oil but also coal and liquefied natural gas, to power its huge economy, the third largest in the world. Yet Japan’s energy intensity is low—the lowest in the world, lower than in the European Union, the US, Latin America, or the developing world. Spurred by the oil shocks of the 1970s, Japan has worked hard to improve its economic output per unit of energy. Despite temporary bumps perversely enabled by the collapse of oil prices in the 1980s and 1990s, Japan’s energy intensity in 2010 was 25% lower than in 1980.
The broader lesson that developing Asia can draw from the Japanese experience is that managing energy demand more efficiently can make a big difference to the energy pathway, and there is every reason for others to try to emulate Japan’s success. Effective government leadership can mobilize behavior change in firms and households. The lesson for Asian governments is that they must take the lead in changing the mindset and culture of their citizens so that they use energy more efficiently and thus do their part to promote Asia’s energy security.
Several strategies offer promise toward more efficient demand management even in the short term. Broadly speaking, these strategies can be grouped into three groups. First, eliminating consumer subsidies and taxing greenhouse gas emissions will move the price of energy toward its true cost. Second, green innovation such as smart cities and clean transportation will improve energy efficiency and environmental sustainability. Third, changing behavior can curtail wasteful energy consumption. Demand management strategies are promising but presents various challenges. Tackling outmoded subsidies requires political will, green innovation takes investment in technology, and changing behavior entails instilling fundamentally new attitudes.
Energy prices that reflect true costs
One obvious channel for managing demand more efficiently is to remove distortions that artificially reduce the price of energy to below its true cost. Sometimes government policy such as consumer subsidies are the source of such distortions, which encourage energy overconsumption. In other cases, government intervention such as greenhouse gas taxes are required to bridge the gap between the true cost of energy, including its environmental cost, and its purchase price.
Eliminating consumer subsidies
that a $0.25 per liter increase in fuel prices causes a 4.5% decline in household real incomes in Asia and Pacific (Table 2.2.1). This impact is partly direct, forcing households to spend more on fuel, and partly indirect, as prices paid for goods and services swell with higher embedded energy costs.
Most Asian countries provide some form of subsidy to offset harm to welfare, with subsidies varying widely from country
to country (Figure 2.2.1). Subsidies in developing Asia are larger than elsewhere except the Middle East, and they are increasing (Table 2.2.2).
A lot of attention has been paid to fossil fuel subsidies globally, as overconsumption damages energy supply adequacy and the environment. Member countries of the Group of 20 and Asia–Pacific Economic Cooperation have declared that such subsidies will be phased out. According to the IEA (2012a), oil-exporting countries offer the highest subsidies in terms of their share of GDP. Among non-oil exporting countries in Asia, Bangladesh and Pakistan have the highest GDP shares—though estimates vary from year to year with fluctuations in international prices for liquefied petroleum gas, natural gas, and oil.
Such subsidies are well-intentioned, or at least popular, but they increase energy consumption, distort energy development planning, and, when applied unevenly, provide incentives for adulteration and illegal cross-border sales. Worse, the main beneficiaries of energy subsidies are not the poor. If the intent is to make energy more affordable to the poor, only the poorest 20 percentile should benefit from the subsidy. In fact, the poor in Asia benefit little from subsidized fuel prices because many lack electricity and gas connections, few own vehicles, and most transport sparingly. The IEA (2011a) surveyed nine Asian countries with the highest fossil fuel subsidies, along with two countries in Africa, and found that only 15% of the benefit of kerosene subsidies—and a paltry 5% of subsides for liquefied petroleum gas—went to the poorest 20th percentile (Figure 2.2.2).
As the stated intent of energy subsidies is to provide affordable energy to the disadvantaged, the better solution would be to give the target populations direct cash benefits or energy coupons. Poor households are identified for benefits like food distribution, education support, and medical treatment. The energy subsidy could be similarly targeted. For example, a cash payment scaled for the energy used by a typical energy-poor household, not tied to the household’s
energy consumption, would extend access without encouraging wasteful
2.2.1 Fossil-fuel subsidy
PRC = People’s Republic of China.
Source: IEA 2012a.
2.2.1 Direct and indirect welfare impacts of fuel price increases (%)
Direct Impact, by Product Direct
Impact
Indirect Impact
Total Impact
Gasoline Kerosene LPG Electricity
Africa 0.2 1.2 0.2 0.1 1.7 3.7 5.4
South and Central America 0.2 0.2 0.3 0.2 0.8 2.4 3.3
Asia and the Pacific 0.3 1.6 0.3 0.3 2.5 2.0 4.5
Middle East and Central Asia 1.4 0.7 1.0 0.5 3.6 3.7 7.4
All regions 0.4 1.1 0.3 0.2 2.0 3.3 5.4
LPG = liquefied petroleum gas.
Note: Welfare impacts are caused by increasing the price of fuels by $0.25 per liter. Source: Del Granado et al. 2012.
2.2.2 Fossil fuel consumption subsidies ($ billion)
2007 2008 2009 2010 2011
Developing Asia 90.6 177.0 94.6 113.7 161.7
Latin America 51.7 71.0 25.5 40.2 59.5
Middle East 124.0 193.9 124.7 170.4 204.2
Africa 36.5 51.5 26.7 41.2 48.1
Eastern Europe 39.4 61.3 39.7 46.9 49.5
Note: Countries surveyed were Angola, Bangladesh, the People’s Republic of China, India, Indonesia, Pakistan, the Philippines, South Africa, Sri Lanka, Thailand, and Viet Nam.
2.2.1 Replacing general price subsidies with targeted transfers in Indonesia
A fuel subsidy puts pressure on the budget and external account. The Government of Indonesia still administers fuels prices, which lag far behind international price increases and cause unsustainably high fiscal spending (box figure). In 2012, the government spent $22 billion on fuel subsides—at 2.6% of GDP, they were 0.6 percentage points higher than the government’s infrastructure spending. As Indonesia now imports fuel, the policy weighs on the country’s external account.
Although reducing the fuel subsidy will remain politically difficult, domestic debate is moving in the right direction. Cutting the fuel subsidy increases prices and is thus politically very unpopular. However, the public recognizes that the general fuel subsidy disproportionately benefits the rich and middle class, disregarding any question of need. A household survey found the richest 10% of households consuming 40% of all subsidized gasoline (World Bank 2011). In addition, the policy encourages overconsumption. As reallocating fiscal resources to infrastructure, health, and education would spur growth and make it more inclusive, the government and parliament agreed in the 2013 budget to allow higher fuel prices.
Switching from general price subsidies to targeted transfers is the best option. The government is planning to establish in 2014 a national social security system through which the government will pay insurance premiums for poor families. Discussion is under way to use the new social security system to target energy subsidy transfers to the poor.
2.2.2 Share of fossil-fuel subsidies received by the poorest 20th percentile, 2010 Note: Countries surveyed were Angola, Bangladesh, People’s Republic of China, India, Indonesia, Pakistan, Philippines, South Africa, Sri Lanka, Thailand, and Viet Nam.
Source: IEA 2011a.
use. In fact, a beneficiary household would have incentive to use less energy and keep the surplus from the payout to pay for other needs. This achieves the objective of restraining energy use without creating the perverse incentives that so frequently drive energy systems off track.
Replacing general energy subsidies with subsidies targeting the energy poor can immediately restrain energy demand without denying those in need. It can go a long way toward laying the foundation for Asian energy security. The Indonesian experience explains the government’s efforts to reduce subsidies despite political difficulties (Box 2.2.1). Taxing greenhouse gas emissions
Market energy prices rarely reflect the true price of energy when such negative externalities as pollution are factored in. A widely touted option is the so-called carbon tax on emissions of greenhouse gases (GHGs). The argument in favor of such a tax is that the price of energy should cover such externalities as GHG emissions. This real price would create incentives to reduce energy consumption and develop new clean technologies, which would strengthen two of
the three pillars of Asian energy security: energy supply adequacy and environmental sustainability. However, carbon taxes face two primary difficulties.
First, the so-called “free rider” problem is that countries benefit from others’ adoption of a carbon tax whether or not they themselves adopt
Fossil-fuel consumption subsidy (% of GDP), 2010
0 1 2 3 4 5
PRC = People’s Republic of China.
one and shoulder the competitive trade disadvantage it imposes through higher costs. Second, a carbon tax raises energy prices and thus undercuts affordability, compromising that pillar of Asian energy security. It also slows economic activity.
Addressing the free rider problem requires international policy coordination, but little progress has been made in international dialogue to impose a carbon tax. Some countries with caps on GHG emissions have considered imposing a duty on import of goods from countries that do not have caps. Consensus has so far been elusive, even for extending the Clean Development Mechanism toward capping emissions from fossil fuels mostly in developed economies and encouraging clean energy use in developing economies. This reflects failure to evaluate the impact of a carbon tax beyond the short term. In the long run, a carbon tax will encourage new technologies for tapping clean and renewable energy sources, lowering fossil fuel use in transportation, and developing other ways to mitigate GHG emissions. Developing countries in Asia could direct the revenues raised from a carbon tax toward accelerating clean energy technologies. In the long run, innovators would outperform free riders.
In addition, ways exist to mitigate the harm done by carbon taxes to energy affordability and economic growth. Tax proceeds can fund targeted subsidies to make affordable energy available to the poor, as described above. Keeping a carbon tax from inhibiting economic activity is trickier but possible. One solution is for governments to use tax proceeds to reduce the cost of another production input to offset firms’ higher energy costs. The European Commission has evaluated this kind of revenue recycling (Kouvaritakis et al. 2005).
The United Kingdom introduced its similar “climate change levy,” which compensated corporate payers of a carbon tax by reducing their contributions to employees’ social insurance, essentially giving firms a break on their payroll taxes to offset increased energy costs. However, the government reneged on the promised reduction a few years later by returning social insurance contributions to the previous rate.
A general lesson from this experience is that governments can be tempted to use proceeds from a carbon tax and similar schemes for unintended purposes when a fiscal shortfall arises. But it also shows that such a program can be implemented if the political will exists. In 2003, the Council of Ministers of the European Union issued a directive that allowed member states to “offer companies tax incentives in return for specific undertakings to reduce emissions” (European Commission 2004). Such initiatives are voluntary at the moment, but the decision points to a growing perception that GHG taxation with revenue recycling may offer a powerful tool for policy makers.
Gains from green innovation
electricity in end-use applications saves gas and displaces coal and other dirtier types of energy. Green innovation requires large investments in new technology and infrastructure, but the benefits are potentially huge. Smart cities that save energy
A fast-growing body of research supports the idea that clever planning and design can enable new urban centers to deliver significant
environmental and energy savings. As Asia grows, new cities will emerge, and this relatively clean slate provides the opportunity to substantially redefine urban design. Industrialized countries in which rural-to-urban migration has largely run its course lack this opportunity.
Urbanization itself offers evident benefits in energy efficiency and environmental protection. In the industrialized world, residents of compact urban centers individually consume less energy and water than their suburban and rural counterparts. They live in smaller spaces, consume less, discard less trash, and rely far less on cars for transportation, as walking, cycling, or public transportation are practical options that use energy far more efficient than do private cars (Owen 2009).
The benefits can be multiplied. Careful urban design can apply knowledge of mobility patterns to create compact, walkable
neighborhoods. Shared-use mobility and thoughtfully agglomerated office buildings can reduce transportation energy demands. Well-designed communication and control systems can provide real-time information on energy, water, and other resource use that can help consumers alter consumption and movement patterns to maximize their efficient use. Asian urban centers are taking the form of megacity hubs with suburban satellite cities. Rapid transportation systems like bus mass transit systems in the PRC and subways in India help lower energy use and improve the environment and quality of life (ADB 2012a).
Careful urban planning can take advantage of cogeneration opportunities, in which waste heat from power generation can serve the heating and cooling needs of commercial buildings and households if the geographic configuration is compact enough. Ulaanbaatar,
Mongolia, is procuring a combined heat-and-power plant to replace aging counterparts. Similarly, several cities in Central Asia have rehabilitated and upgraded their heating supply systems to be fed by combined heat-and-power plants. Large waste collection and disposal systems in urban centers can generate electricity from waste, as is done in Incheon, Republic of Korea. Malaysia has installed gas district cooling systems that boast system efficiency at 75%, or almost double the 40% for systems driven by electric motors.
105 years and Asia will need only 95 years (ADB 2012a). From 1980 to 2010, Asia added more than a billion people to its cities, pushing urban densities higher than in the rest of the world. Asia has 8 of the 10 most densely populated large cities in the world, including the top three: Mumbai, Kolkata, and Karachi, in that order. In 2010, Asia was home to 12 of the world’s 23 megacities, or just over half. This rapid urbanization is expected to continue, bringing Asia’s urban population from the current 43% to 50% in 2025. Considering Asia’s large population, the strong urbanization trend will continue thereafter, opening the door to a new growth paradigm if the process is properly managed.
Canada has established the Green Municipal Fund to support green cities studies and pilot projects through grants and low-cost loans. It has so far committed to disbursing $613 million to support 934 green initiatives in more than 460 communities across Canada. The benefits from 70 completed projects include reduced GHG emissions and water consumption.
The implementation of green and smart cities in Asia will require a major shift in urban planning. Additional public finance will be needed for the higher upfront capital and maintenance costs.
Clean, green transportation
Compressed natural gas (CNG) and other gaseous fuels have been introduced into urban transport mainly to address the pollution caused by gasoline and diesel internal combustion engines. Recognizing the contribution natural gas can make to better air quality and other benefits, the Republic of Korea and India, among others, have stepped up efforts to promote transport using CNG (Box 2.2.2). Two studies in California modeled the lifecycle impacts of this use of gaseous fuel, including its preparation, distribution, and use in various types of light- and heavy-duty vehicles. The main findings were that it would reduce energy use and GHG emissions by 6%–11%, local pollution by 20%–80%, and petroleum use by more than 90%. The model pertains to Californian patterns of vehicle use and processes of fuel delivery and electricity generation, and the magnitude of savings will vary across countries, but petroleum would undoubtedly be saved and local pollution reduced. Both reductions would make using CNG and other gaseous fuels beneficial in Asia, especially toward the goals of energy supply adequacy and local environmental sustainability.
Both options shift pollution out of urban centers. The PRC is aggressively deploying electric vehicles in line with a strategy of co-evolution between electric vehicles and the development of grid generation using renewable energy (IEA 2011b,c). The country has begun with a three-stage pilot project dubbed the Ten Cities Ten-Thousand Vehicles Program, though it actually covers 25 cities, 12 in the first stage: Beijing, Changchun, Changsha, Chongqing, Hangzhou, Heifei, Jinan, Kunming, Nanchang, Shanghai, Shenyang, and Shenzhen.
Most electric vehicles currently in use in the pilot cities are public buses, taxis, official vehicles, and service vehicles, but five of the cities offer support for private electric vehicles. According to the IEA, Beijing delivered 1,000 neighborhood electric vehicles in 2009 and planned to develop 30,000 electric vehicles by 2012, 23,000 of them BEVs and 7,000 PHEVs. The Shanghai government set a target of 20,000 private electric vehicle purchases by the end of 2012, and Shenzhen expects to have 100,000 electric vehicles by 2015. The cities have invested in charging stations and other infrastructure and have enlisted major auto manufacturers in the program (IEA 2011b).
The IEA cites the Ministry of Industry and Information Technology as reporting that the plan includes promoting the widespread
commercialization of BEVs, with vehicle batteries either recharged or swapped out. Personal BEV and PHEV ownership is slated to reach 500,000, as the deployment of medium and heavy PHEVs reaches
2.2.2 Compressed natural gas transporting Koreans
Motor vehicles are responsible for 23% of energy-related carbon dioxide emissions (IEA 2010a). Using natural gas for transport can play an important role in reducing these emissions. Compressed or liquefied natural gas can power transport by land, sea, or air. The benefits of using natural gas range from immediate cost, noise, and emissions reduction to longer-term improvements in local air quality and energy security. Studies show emissions reduction in carbon dioxide equivalent averaging 25% when CNG replaces gasoline in passenger cars and light commercial vehicles. In more heavily used vehicles such as buses and trucks, CNG offers even more significant emissions reduction (IEA 2010b).
The use of natural gas for transport in the Republic of Korea became significant with the introduction in 2000 of CNG buses to replace diesel-powered city buses, as mandated by the country’s Clean Air Conservation Act. The government provides financial assistance for the purchase of natural gas vehicles and part of their fuel. In 2006, the government planned to set aside $100 million to support the program and provide bus operators with $24,000 for every CNG bus (The Green Car Congress 2006). In Seoul, the city government restricted buses operating in the city to CNG, starting in 2010. The city government provided subsidies to bus operators for each
CNG bus purchased to cover part of the cost differential. In other major cities, diesel buses at the end of their useful life (9 years by law) are being replaced by CNG buses. The use of CNG buses accelerated in the country in 2006–2010, when over 3,000 CNG buses were added each year (box figure). As of 2010, the country had 25,996 CNG buses in operation. One-third of them are in Seoul, where improved air quality is convincing proof that government support was a wise investment.
Number of buses using compressed natural gas in the Republic of Korea
0 10 20 30
2010 2007
2004 2001
Thousands
1 million, all by 2015. Thereafter, the plan calls for BEV and PHEV ownership by 2020 to reach 5 million, accounting for 5% of total vehicle ownership (IEA 2011b).
This strategy is rightly called “co-evolution” as the development of electric vehicle fleets and power generation using renewable energy reinforce each other. The introduction to the power grid of intermittently available renewables creates challenges to reliability and stability, which can be mitigated by connecting a fleet of electric vehicles through a “smart grid” (a technological advance discussed in the next section). Batteries in electric vehicles can store renewable power that is produced in excess of system load. Two-way charging infrastructure can allow electric vehicle batteries to feed back into the grid during peak demand. Such “spinning reserves” for power systems provide backup power that is immediately available and potentially reduce the cost of investment in generating capacity, strengthen the stability of the system, and provide backup against system failures. Meanwhile, electric vehicle owners can earn rebates by providing these services to the grid, thus reducing their operating costs.
Clean transport requires a major shift in services. Mass road transit systems can operate fleets with gaseous fuels, and private ownership can move toward electric vehicles. Close collaboration and partnership between municipal governments, carmakers, and fuel suppliers is essential. Initially, public finance can promote research and development and help build the critical mass of vehicles that brings the cost of gas and electricity distribution per vehicle down to manageable levels. Clean transport becomes more competitive as it grows.
Switching electricity for gas
Energy efficiency can be improved by replacing electricity with gas for end use. Consider using a cubic meter of gas two ways for cooking. One option is to burn the gas in a gas-fired power plant, which converts about 40% of the energy in the gas into electric energy (EIA 2013a) that a family can use to power an electric cooktop. If that same cubic meter of gas were instead delivered directly to power a gas cooktop, the same cooking energy would require only 40% of the original cubic meter of gas. The family would still have 60% of the cubic meter with which to prepare the next meal and half of the meal after that.
It is apparent that the energy supply system is better used if
households purchase gas cooktops instead of electric ones. It makes little sense to burn gas in a power plant to boil water to generate electricity with which to boil water on an electric cooktop, when, instead, you can burn gas to boil water right in your kitchen. Replacing electricity with gas in many households and businesses would extend the useful life of natural gas reserves, thus enhancing energy supply adequacy by conserving gas resources. Further, using gas instead of electricity for cooking substantially reduces emissions.
Much of the industrialized world is locked into existing electric and natural gas transmission and distribution systems. These systems are highly developed but shaped more by historical happenstance than by comprehensive planning to minimize investment cost and maximize energy efficiency. By contrast, as Asian societies expand their gas and electricity systems into new areas—as they will with urbanization and efforts to serve the energy poor—they will often build from scratch.
Asians will therefore enjoy more freedom of choice and potential for investment savings. Electricity generation, transmission, and distribution infrastructure is much more expensive to build than gas delivery infrastructure. While it may not be possible to replace electricity with gas for all new end uses in the foreseeable future, it is possible to reshape electricity and gas delivery systems in new ways that minimize redundancies and save capital costs.
And Asians will have more freedom to be energy efficient. Electricity and gas systems in the industrialized world arose at a time when energy efficiency was a low priority and utility regulators had little incentive to work with energy suppliers to find efficiency measures that could benefit from careful coordination between gas and electricity delivery. In contrast, Asia has the advantage of being able to pursue such coordination for future benefit.
If gas supplies become more abundant in Asia through, for example, the aggressive development of unconventional sources, the natural and immediate inclination is to use it as much as possible to replace dirty coal in generating electricity. This strategy seems obvious, but a broader view points a different direction. Natural gas has more value for environmental protection and energy conservation if it is used instead to replace
electricity in end uses—2.5 times the value as the cooking illustration showed.
Such replacement may be practical only where energy supply systems expand into newly built-up areas. In the meantime, using gas to generate electricity may be the sensible alternative in established cities, at least for the time being. And, in a few countries, notably Bhutan, the Kyrgyz Republic, and Tajikistan, most electricity supplied to end users is generated from clean hydropower. In these cases—or where small, isolated grids are supplied by solar or wind power—switching from electricity to gas would be ill-advised as the electricity is from cleaner, renewable sources. These caveats do not apply, however, in most Asian locations that will experience dramatic economic and infrastructure expansion in the coming years and decades.
Gas can replace electricity for a number of end uses, among them certain industrial processes; space heating and cooling; and powering kitchen appliances such as cooktops, ovens, and refrigerators. Manufacturers of appliances, home heating and cooling equipment, and industrial capital equipment can be encouraged to promote gas over electric designs. Doing so will gradually reshape the fuel demand profile. If end users demand gas, energy providers will respond. In any case, the
2.2.3 The benefits of replacing electricity with gas
Coal input to generation
Energy converted
to electricity Energy lost
as heat
Usable energy
vs
.Coal input to generation
Energy converted
to electricity Energy lost
as heat
Usable
future development of gas and electricity transmission and distribution systems should be coordinated. Gas and electric utilities generally operate within regulatory frameworks, but sometimes the frameworks are only loosely coordinated. The economic advantages of minimizing infrastructure duplication combine with energy savings and emissions reduction to provide strong motivation for better coordinating gas and electricity systems in new infrastructure. Low international gas prices and investment in liquefied natural gas terminals mean that even energy-importing countries can benefit. Coordinated planning of new electricity and gas infrastructure should be augmented by building local firms’ capacity to successfully enter the gas supply business, which has relatively few players in most of developing Asia.
Changing energy consumer behavior
Energy prices that reflect the true cost of energy will induce Asian households and firms to use energy more efficiently. But there is much more that can and should be done to promote more efficient energy use. Above all, there is a need to change the general public’s energy use behavior by instilling a recognition that energy is a scarce, valuable resource. The impact of new energy efficiency technologies will depend on the scale and speed of their uptake. Conservation programs can induce individuals to refrain from purely wasteful energy consumption. Changing behavior ultimately requires a fundamental shift in the general public’s attitudes. The government should act as a catalyst in this endeavor, as the Japanese experience shows.
Energy efficiency available on demand
Asian governments must take the lead in changing Asians’ energy use behavior. More aggressive policies to promote to consumers cost-effective energy efficiency will enhance Asia’s economic growth, private consumption, government expenditure, and investment. Further, energy efficiency gains reduce the effective price of energy, thus advancing the cause of affordability and access. Similarly, lower energy consumption reduces emissions, thus furthering environmental sustainability.
In addition, if programs encouraging investment in improved energy efficiency make energy services more economical, they will likely be accompanied by net increases in productive labor employment. Especially during times of economic slowdown, programs that improve energy efficiency by, for example, retrofitting buildings can employ otherwise idle labor to add value to the economy.
Other benefits flow from how energy efficiency gains expand producer and consumer surpluses and strengthen economic welfare. Evidence from Europe shows such gains directly improving public budgets when firms hire workers to retrofit aging, energy-inefficient buildings and pay associated payroll taxes, and when workers pay income and social insurance taxes rather than claim unemployment benefits (Copenhagen Economics 2012). The IEA has recognized and identified how energy efficiency gains help alleviate poverty.
across Asia. For example, consumers’ use of compact fluorescent lamps and light-emitting diodes can save up to 70% of the electricity used by incandescent, sodium vapor, or halogen lamps. Active solar thermal systems to heat water and interiors are popular in the PRC, which has 39% more active solar thermal systems installed than the rest of the world combined (IEA 2011a).
Solar tubes can bring daylight into rooms without windows, and special solar paints can reflect most heat from the sun to lower the energy needed for cooling. Similarly, proper building insulation conserves heat during the winter. Hybrid electric vehicles reduce fuel consumption with brakes that capture energy from a decelerating vehicle for charging batteries that run the motor. High-efficiency electric motors are used extensively in industry. Such new technologies entail high upfront fixed costs, however, because their developers need to recoup research and development investments. Further, they initially may not be as reliable as existing efficient technologies. Encouraging more investment would accelerate their commercialization.
A very large market like Asia is conducive to the rapid deployment and commercialization of new technologies. Establishing and supervising efficiency standards can reinforce consumer demand for energy-efficient technologies, and the ready availability of loans can expand their adoption in firms and households. Government programs that create incentive for developing better technologies and designs in a concerted way can accelerate the progress of innovation.
The proposition that more aggressive policies toward energy efficiency can strengthen all three pillars of Asian energy security is extremely seductive. Unfortunately, though, the seduction of energy efficiency cuts both ways.
On the lookout for rebound effects
A large and growing body of research has shown that energy efficiency gains do not bring one-for-one reductions in energy consumption because of the so-called “rebound effect.” In extreme cases, improved efficiency can backfire, spurring outright increases in energy
consumption. It appears that energy efficiency improvements act much as energy price reductions or energy subsidies, encouraging higher energy use (Box 2.2.3).
What is particularly troublesome for Asia is that rebound effects appear to be larger in developing economies than in industrialized economies. Even with rebound effects, energy efficiency gains advance the cause of affordable access by reducing the effective cost of energy and spur economic growth by making energy cheaper for producers. If rebound falls short of backfire, efficiency gains improve environmental sustainability and energy supply adequacy by reducing energy use. Careful attention paid to managing rebound effects can ensure that investments in energy efficiency strengthen all pillars of Asian energy security.
Awareness and conservation programs