Vol. 8 No. 1, p 21 – 26 [email protected] ISSN: 1412-0070
Performance Evaluation of Five Selected Indonesian Banks Using Data
Envelopment Analysis
Fanny Soewignyo*
Fakultas Ekonomi Universitas Klabat
This paper employs Data Envelopment Analysis (DEA) to evaluate the operational performance of a bank relative to the performance of its peer banks. Utilizing financial data from the year 2005 to 2007 of
five selected leading Indonesia’s banks to conduct the analysis, the use of DEA yields the following: 1)
rankings of DMUs using efficiency scores, 2) establishment of the reference group against which a DMU is evaluated, and 3) identification of areas of deficiency. Nine of the 15 DMUs were found to be in need of improvements. In addition to identifying best-practice banks and those that are out-of-line with the best practice banks, DEA also points to the specific changes that must be made in the less productive branches in order for them to catch up with their best practice peer group. The findings of this study should help management in identifying the strengths and weaknesses of their banks.
Key words: DEA-CRS, Indonesian Banks, Performance Evaluation
INTRODUCTION
Indonesia’s financial sector is still dominated by banks. The banks are closely related to the corporate sectors, as most corporations own banks and banks channel huge loans to these corporations. Banks are special and therefore must run business based on prudential principles. The functions of banks in Indonesia are basically as financial intermediary that take deposits from surplus units and channel financing to deficit units. According to Indonesian banking law, Indonesian banking institutions are typically classified into commercial and rural banks. Commercial banks differ with rural banks in the sense that the latter do not involve directly in payment system and have restricted operational area.
Banking industry acts as lifeblood of modern trade and commerce acting as a bridge to provide a major source of financial intermediation.
A well functioning financial system is necessary for enhancing the efficiency of intermediation, which is achieved by mobilizing domestic savings, channeling them into productive investment by identifying and funding good business opportunities, reducing information, transaction, and monitoring cost and facilitating the diversification of risk. This results in efficient allocation of resources, contributing to a more rapid accumulation of physical and human capital, and faster technological progress, which in turn lead to a higher economic growth.
As more people learn to patronize banks, the more it becomes challenging and stiffer the competition is in the banking industry. The ever changing technology and the need for advancement inevitably requires corresponding growth and development in the banking industry in order for banks to satisfactorily meet the increasing and changing demands of a more progressive society. The recent crisis has shown that Indonesia’s banking industry and overall financial system stability need to be improved and strengthened. (Goeltom, 2005, p.246)
*corresponding author
Objectives of the Study. This study aims to evaluate and measure the efficiency performance of selected Indonesian Banks based on the financial statements publicly available at the Indonesia Stock Exchange from 2005 - 2007, specifically:
To evaluate the relative efficiency and determine the most efficient bank using Data Envelopment Analysis (DEA) from the following banks:
Bank Danamon Tbk Envelopment Analysis (DEA) for measuring the efficiency. Moreover, the result of this study would provide useful information and as precursor for more future studies that will identify and recommend viable options to improve productivity for the banking sector and other industries as well.
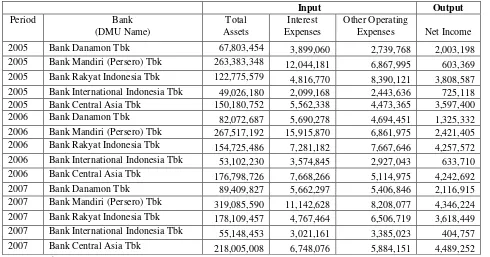
Scope and Limitation. The study measured the efficiency of the five-selected leading Indonesia’s banks through 3 inputs (total assets, interest expenses, other operating expenses) and the output is net income. The periods covered were from fiscal year 2005 to 2007. This study addresses the question: Which bank is more efficient in converting inputs into outputs.
22 Marthen Sengkey
operational efficiency. Examples may be found in a variety of industries, both in manufacturing and services (e.g. Ford Motor Company, Emerson Electric, General Electric, GMAC, and Merrill Lynch). Studies of operational efficiency within banking typically utilize the resources of a bank (e.g., human, technology, space, etc.) as inputs, and services provided (such as number of loans or other transactions serviced) as outputs (Soteriou & Zenios, 1999).
However, even though it is fairly easy and straightforward to carry out analyses, closer examination indicates that the identification of best practices and other critical measures may not be satisfactory. This is especially the case for service organizations whose operations may be too complex to allow correct identification of benchmarks and best practices since many service organizations typically have hundreds or thousands of sites where services are delivered (Metiers et al., 1999). Both the volume and dispersion of sites create managerial difficulties in measuring performance.
In addition, many common performance measures used by manufacturing firms may have drawbacks when used in service organizations. Consider the case of a multi branch bank that provides financial services. Unlike a manufacturing operation, a bank clearly has many subjective factors that affect its long-term success. These include, but are not limited to, customer needs, skills and judgments of service providers, and the mix of services provided.
If we consider the question of what measures banks use to track such factors, we often note a disconnection between the goals and the measures used to track whether or not the goals are being achieved. For example, banks typically use such measures as ratios, transaction per teller, cost per transaction, and loans generated per employee to measure their outputs. However, since branch location may be the most important factor driving these ratios, it is conceivable that small branches located near major business centers could generate high profits, and that large branches located in residential areas could generate smaller profits because they handle more of the less profitable transactions such as numerous small deposits.
Conversely, higher profitability in smaller but well located branches may mask operational inefficiencies there. Therefore, considerable debate exists among retail bank managers regarding the usefulness of bank branch profitability statements in evaluating bank branch performance (Metiers et al., 1999). Even if profile could be accurately measured, branches may have different missions that would alone make single-output, multiple-input setting. Inputs are cost related, while outputs are revenue, profit or service related. From observed values of the inputs and output for all banks, DEA develops an “efficiency frontier” with which each individual bank is compared. In other
words, each bank is evaluated relative to its peer group among the best practice banks.
Data envelopment analysis (DEA) involves the use of linear programming methods to construct a non-parametric piece-wise surface (or frontier) over the data. Efficiency measures are then calculated relative to this surface. Comprehensive reviews of the methodology are presented by Seiford and Thrall (1990), Lovell (1993), Land, Lovell and Thore, (1993) and Olesen and Petersen (1995). Charnes, A. et al. (1978) proposed a model which had an input orientation and assumed constant returns to scale (CRS).
An intuitive way to introduce DEA is via the ratio form. For each firm, to obtain a measure of the ratio of all outputs over the inputs, i.e. u’y,/v’x_, where u is an Mx1 vector of output weights and v is a Kx1 vector of input weights. The optimal weights are obtained by solving the mathematical programming problem:
Maxu,v(u’yi/v’xi),
St10 u’yj/-v’xj<1, j=1, 2… N,
u, v ≥0.
This involves finding values for u and v, such that the efficiency measure for the i-th firm is maximized, subject to the constraints that all efficiency measures must be less than or equal to one. One problem with this particular ratio formulation is that it has an infinite number of solutions. To avoid this, one can impose the constraint v’xi = 1, which provides:
Max µ,v(µ’yi) constraints than the multiplier form (K+M, N + 1) , and hence is generally the preferred form to solve. The value of Ө obtained will be the efficiency score for the i-th firm. It will satisfy: Ө≥ 1, with a value of 1 indicating a point on the frontier and hence a technically efficient firm. The linear programming problem must be solved N times, once for each firm in the sample. A value of Ө is then obtained for each firm.
Vol. 8, 2009 Performance Evaluation of Five Selected Indonesian Banks 23 determined by the observed data points (i.e. all the
firms in the sample). The radial contraction of the input vector, xi, produces a projected point, (Xג, Yג) on the surface of this technology. This projected point is a linear combination of these observed data points. The constraints in the said equation ensure that this projected point cannot lie outside the feasible set.
The data for this study were taken from the Indonesia Stock Exchange for the time period of 2005 to 2007. To be included in the data set used in this study, banks had to meet two conditions: first, that financial information is available in the Indonesia Stock Exchange for the period of 2005 to 2007; and, second, that they do not have negative financial data. DEA requires that data set to be non-negative for the
outputs and strictly positive for the inputs (Sarkis and Weinrach, 2001). Unfortunately, there is no DEA model to date that can be used with negative data directly without any need to transform it (Portela et al., 2004). Those did not meet these conditions were excluded from analysis.
Table 1 shows the list of five (5) sample banks with the financial data for the fiscal year of 2005 to 2007 included in this study, considering three (3) input variables and one (1) output variable. The variables were then subjected to the DEA method under the constant returns to scale (CRS) assumption was used for the fifteen (15) pooled data or decision making units (DMUs).
Table 1.Actual Financial Data of the Selected Banks
Note: All figures are in Rp. millions
Empirical Results. The DEA model presented in equation above is used to evaluate the 15 DMUs. Each DMU is compared with the remainder of the DMUs and an efficiency score for this DMU is generated in reference to a set of best practice DMU. An efficient or best-practice DMU has an efficiency score of 1. A DMU with an efficiency score of less than 1 is less productive relative to a reference set of best-practice DMUs. Table 2 presents the efficiency scores and rankings of the 15 DMUs and their corresponding
reference sets.
The results of the DEA analysis indicate that of the 15 DMUs included in this study, nine (9) can make substantial improvements in terms of increasing productivity. On the other hand, DMUs 1, 3, 5, 10, 13 and 15 are efficient indicated by the efficiency score of one. In other words, these best practice DMUs generate income and provide services requiring fewer resources than do their peers.
Table 2.DEA Efficiency Scores & Rankings
Input Output
Period Bank
(DMU Name)
Total Assets
Interest Expenses
Other Operating
Expenses Net Income
2005 Bank Danamon Tbk 67,803,454 3,899,060 2,739,768 2,003,198
2005 Bank Mandiri (Persero) Tbk 263,383,348 12,044,181 6,867,995 603,369
2005 Bank Rakyat Indonesia Tbk 122,775,579 4,816,770 8,390,121 3,808,587
2005 Bank International Indonesia Tbk 49,026,180 2,099,168 2,443,636 725,118
2005 Bank Central Asia Tbk 150,180,752 5,562,338 4,473,365 3,597,400
2006 Bank Danamon Tbk 82,072,687 5,690,278 4,694,451 1,325,332
2006 Bank Mandiri (Persero) Tbk 267,517,192 15,915,870 6,861,975 2,421,405
2006 Bank Rakyat Indonesia Tbk 154,725,486 7,281,182 7,667,646 4,257,572
2006 Bank International Indonesia Tbk 53,102,230 3,574,845 2,927,043 633,710
2006 Bank Central Asia Tbk 176,798,726 7,668,266 5,114,975 4,242,692
2007 Bank Danamon Tbk 89,409,827 5,662,297 5,406,846 2,116,915
2007 Bank Mandiri (Persero) Tbk 319,085,590 11,142,628 8,208,077 4,346,224
2007 Bank Rakyat Indonesia Tbk 178,109,457 4,767,464 6,506,719 3,618,449
2007 Bank International Indonesia Tbk 55,148,453 3,021,161 3,385,023 404,757
2007 Bank Central Asia Tbk 218,005,008 6,748,076 5,884,151 4,489,252
DMU
No. Period
Bank (DMU Name)
Input- Oriented CRS Efficiency
Score
DEA Rankings
Reference Set (DMU No.) /
Peer
1 2005 Bank Danamon Tbk 1 1 1
2 2005 Bank Mandiri (Persero) Tbk 0.105914 15 10
24 Marthen Sengkey
At the other end of the spectrum, DMU 2 is the least efficient (efficiency score of 0.105914) followed by DMUs 14, 9, 7, 4, 6, 12, 11 and 8, respectively. Table 2 includes peer groups (or reference sets) in addition to the efficiency scores obtained from DEA analysis. Here we note that the reference group for
DMU 2 is DMU 10 with efficiency score of 1. DMU 14, with an efficiency score of 0.239436, compares unfavorably with its peers, DMU 1 and 3. It could be argued that the DEA results ranking the DMUs in terms of their operational efficiency.
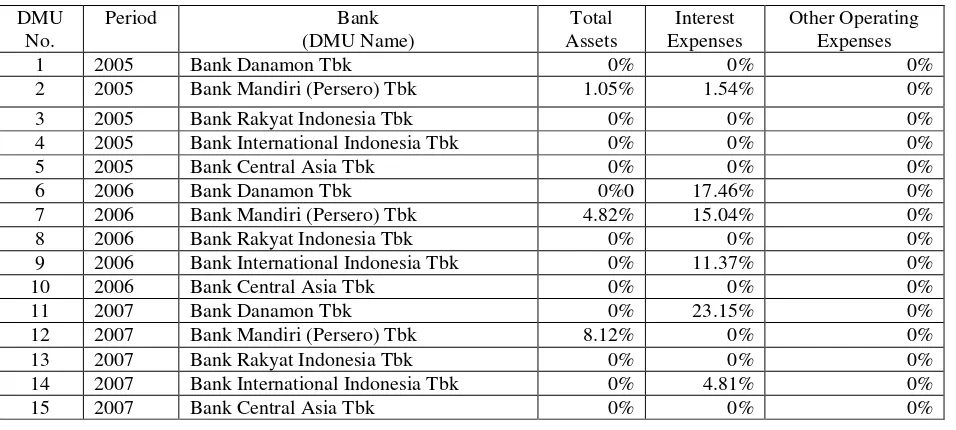
Table 3.Percentage of Input Slacks
Table 3 shows the percentage of input slacks for the variables used in this study. The slack analyses were done to analyze the rooms for reducing inputs for DMUs. The presence of slack means excess in the resources used.
To get the percentage of slack:
Input slack percentage = Input Slack x 100 Actual Input (actual or original data)
The result shows that among DMUs’ input of total assets reflect that 3 out of 15 DMUs obtained slacks. The three DMUs are Bank Mandiri (Persero) Tbk for
all the three fiscal periods. This result implies inefficiency allocation in total assets. The input interest expenses reflect that 6 out of 16 DMUs obtained slacks, namely: Bank Mandiri (Persero) Tbk-2005, Bank Danamon Tbk-2006, Bank Mandiri (Persero) Tbk-2006, Bank International Indonesia Tbk-2006, Bank Danamon Tbk-2007, and Bank International Indonesia Tbk-2007. This implies that they spent too much in their interest expenses. Lastly, there is no slack for other operating expenses. This indicates that all DMUs spent other operating expenses efficiently.
4 2005 Bank International Indonesia Tbk 0.519304 11 1, 3, 5
5 2005 Bank Central Asia Tbk 1 1 5
6 2006 Bank Danamon Tbk 0.530637 10 1, 3
7 2006 Bank Mandiri (Persero) Tbk 0.425422 12 10
8 2006 Bank Rakyat Indonesia Tbk 0.942051 7 1, 3, 5
9 2006 Bank International Indonesia Tbk 0.393568 13 1, 3
10 2006 Bank Central Asia Tbk 1 1 10
11 2007 Bank Danamon Tbk 0.773618 8 1, 3
12 2007 Bank Mandiri (Persero) Tbk 0.649333 9 5, 10
13 2007 Bank Rakyat Indonesia Tbk 1 1 13
14 2007 Bank International Indonesia Tbk 0.239436 14 1, 3
15 2007 Bank Central Asia Tbk 1 1 15
DMU No.
Period Bank
(DMU Name)
Total Assets
Interest Expenses
Other Operating Expenses
1 2005 Bank Danamon Tbk 0% 0% 0%
2 2005 Bank Mandiri (Persero) Tbk 1.05% 1.54% 0%
3 2005 Bank Rakyat Indonesia Tbk 0% 0% 0%
4 2005 Bank International Indonesia Tbk 0% 0% 0%
5 2005 Bank Central Asia Tbk 0% 0% 0%
6 2006 Bank Danamon Tbk 0%0 17.46% 0%
7 2006 Bank Mandiri (Persero) Tbk 4.82% 15.04% 0%
8 2006 Bank Rakyat Indonesia Tbk 0% 0% 0%
9 2006 Bank International Indonesia Tbk 0% 11.37% 0%
10 2006 Bank Central Asia Tbk 0% 0% 0%
11 2007 Bank Danamon Tbk 0% 23.15% 0%
12 2007 Bank Mandiri (Persero) Tbk 8.12% 0% 0%
13 2007 Bank Rakyat Indonesia Tbk 0% 0% 0%
14 2007 Bank International Indonesia Tbk 0% 4.81% 0%
Vol. 8, 2009 Performance Evaluation of Five Selected Indonesian Banks 25
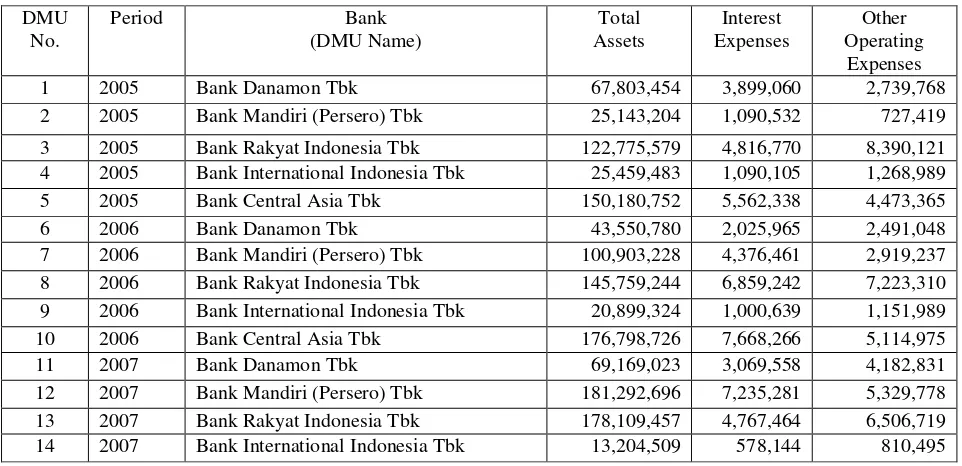
Table 4.Summary of Input Targets
Table 4 presents the detailed input targets for all fifteen DMUs to be technically efficient. Efficiency input targets for 2005 to 2007, are determined in the inputs of total assets, interest expenses, other operating expenses that each firm incurred. Meeting the efficiency targets on total assets, interest expenses and other operating expenses is posted by Bank Danamon Tbk-2005, Bank Rakyat Indonesia Tbk-2005, Bank Central Asia Tbk-2005, Bank Central Asia Tbk-2006, Bank Rakyat Indonesia Tbk-2007 and Bank Central Asia Tbk-2007. The rest, meanwhile, failed to meet the efficiency level of 1.0.
CONCLUSION
The information resulting from DEA analysis is valuable to management in that a given bank should be able to make productivity improvements and/or cost reductions in the banks that are identified as less than efficient. The findings also identify the reference sets relative to which the DMU is compared. The comparison allows a bank
manager to identify specific operating
characteristics that separate efficient banks from inefficient ones.
In my analysis, a bank would be considered efficient if it delivers its outputs at the lowest level of inputs, not at the minimum cost. If it is important to assess not only the extent to which a bank can lower its input levels, but also the extent to which it can lower aggregate cost of inputs, relative prices of inputs must be specified, not just their quantities.
The identification of DMUs that are functioning efficiently in contrast to inefficient
DMUs is one of the most important outcomes of a DEA assessment. Inefficient DMUs can learn from and emulate their efficient peers regarding what needs to be done to improve. Furthermore, operational practices identified as contributing to efficiency may be studied, and information gathered may be disseminated throughout the entire organization that seeks to investigate, improve and grow.
REFERENCES
Berger, A. & Humphrey, D.B. (1997). Efficiency of financial institutions: International survey and directions for future research. European Journal of Operations Research, 98, 175-212.
Charnes, A. et al. 1978. Measuring efficiency of decision making units. European Journal of Operational Research, 2: 429-44. Goeltom, M.S. (2005). Country paper for BIS
Deputy Governor’s Meeting, Basel, 8-9 December 2005. BIS Papers No. 28. “Indonesia’s banking industry: Progress to date.”
Land, K.C., Lovell, C.A.K. & Thore, S. (1993), “Chance-constrained Data Envelopment Analysis”, Managerial and Decision Economics, 14, 541-554.
Lovell, C.A.K. (1993), “Production Frontiers and Productive Efficiency”, in Fried, H.O., C.A.K. Lovell and S.S. Schmidt (Eds.), The Measurement of Productive Efficiency: Techniques and Applications, Oxford University Press, New York, 3-67. DMU
No.
Period Bank
(DMU Name)
Total Assets
Interest Expenses
Other Operating Expenses
1 2005 Bank Danamon Tbk 67,803,454 3,899,060 2,739,768
2 2005 Bank Mandiri (Persero) Tbk 25,143,204 1,090,532 727,419
3 2005 Bank Rakyat Indonesia Tbk 122,775,579 4,816,770 8,390,121
4 2005 Bank International Indonesia Tbk 25,459,483 1,090,105 1,268,989
5 2005 Bank Central Asia Tbk 150,180,752 5,562,338 4,473,365
6 2006 Bank Danamon Tbk 43,550,780 2,025,965 2,491,048
7 2006 Bank Mandiri (Persero) Tbk 100,903,228 4,376,461 2,919,237
8 2006 Bank Rakyat Indonesia Tbk 145,759,244 6,859,242 7,223,310
9 2006 Bank International Indonesia Tbk 20,899,324 1,000,639 1,151,989
10 2006 Bank Central Asia Tbk 176,798,726 7,668,266 5,114,975
11 2007 Bank Danamon Tbk 69,169,023 3,069,558 4,182,831
12 2007 Bank Mandiri (Persero) Tbk 181,292,696 7,235,281 5,329,778
13 2007 Bank Rakyat Indonesia Tbk 178,109,457 4,767,464 6,506,719
26 Marthen Sengkey
Metiers, R., Frei, E. & Vargas, V. (1999). Measurement of multiple sites in service firms with data envelopment analysis. Productions and Operations Management, 8, 264-281.
Olesen, O.B. & Petersen, N.C. (1995), “Chance Constrained Efficiency Evaluation”, Management Science, 41, 442-457. Portela, M., Thanassoulis, E. & Simpson, G.
(2004), "Negative data in DEA: a directional distance approach applied to bank branches", Journal of the
Operational Research Society, Vol. 55, pp. 1111-21.
Sarkis, J. & Weinrach, J. (2001), "Using data
envelopment analysis to evaluate
environmentally conscious waste
treatment technology", Journal of Cleaner Production, Vol. 9, pp. 417-27.