Introduction
Indonesia is one of the biggest potential markets for pharmaceutical products in the South East Asian region. Indonesia accounts for 37% out of the 650 million populations liv-ing in the region1. Most of the market share for
pharmaceutical products, up to 70%, is still held by local pharmaceutical companies with a total value of around USD2.4 billion2. Profit
growth opportunities are also promising due to
the population size and the rising annual popu-lation growth. However, these growth opportu-nities may be offset by various challenges.
Indonesia imports more than 95% of raw materials from India, China and Europe3. This
situation creates vulnerability to the Indonesian pharmaceutical industry, since the cost of raw materials becomes highly dependent to the cur-rency value of IDR compared to the curcur-rency of the supplier’s country. Other challenges come from local regulations considered as
constrain-Pharmaceutical Public Companies Using Data Envelopment
Analysis
Dewi Hanggraeni*
Faculty of Economics and Business, University of Indonesia
As one of the biggest medicines market in the South East Asia, the pharmaceutical industry in Indonesia has a huge potential market. However, the majority supply of raw materials has been im-ported. Besides, regulations of the Health Ministry and the Trade Ministry have still hampered most players in Indonesia pharmaceutical industry. Therefore, this study used Data Envelopment Analysis
(DEA) models to analyze efficiency and productivity change in the Indonesian pharmaceutical indus -try between 2006 and 2011, listed in the Indonesia Stock Exchange and also supported by applying
efficiency financial ratio. This study finds that the decision for the most relatively efficient company is different using DEA compared to efficiency financial ratios, yet DEA has better measurement of efficiency. It is proven by one of State-owned Enterprises has been evaluated underperformed by the financial ratio analysis, unexpectedly is efficient using the DEA approach. This study has also pro
-posed and tested a hypothesis on the average efficiency to check if the domestic and foreign pharma
-ceutical companies differ in their efficiency but the result implies that there is no significant statistical difference among them. This study indicates that firms having dominant contribution in selling over-the-counter medicines are more efficient than selling ethical medicines. Lastly, technological change contribution has more influence to productivity change instead of pure technical efficiency change in
Indonesia pharmaceutical companies.
Keywords: efficiency, productivity, pharmaceutical companies, Data Envelopment Analysis (DEA), financial ratio
* Lecturer at FEUI and Director of PT Daya Makara UI. Email: [email protected]
1 http://www.businessnews.co.id/ekonomi-bisnis/industri 2 http://www.businessreview.co.id/bisnis-investasi
ing to foreign pharmaceutical players under the International Pharmaceutical Manufactur-ers Group4, especially the Ministry of Health
Regulation (Permenkes) No.1010/2008 con-cerning Medicine Registration. The regulation implies that foreign pharmaceutical companies without local manufacturing plant in Indonesia may not import pharmaceutical products to In-donesia. On the other hand, 95% raw materials for Indonesian pharmaceutical industry are still imported. Moreover, foreign owned companies usually import their raw materials from their home country and then formulated the final product in the host country (Saranga and Phani, 2008). The regulationwas further strengthened by revisions of the definition of pharmaceutical industry in the Decree of Health Minister (SK Menkes) No 245/1990 which stated that phar-maceutical companies operating in Indonesia at minimum must own packaging facilities locat-ed in Indonesia, rlocat-educing the requirement from owning a production facility to only a packag-ing facility. Other regulation comes from the Ministry of Trade Regulation (Permendag) No.45/2009 regulating Importer Identifying number and limitation of foreign ownership up to 75% stated in the regulation of Negative Investment List. These regulations become a disincentive for foreign investors to invest their funds and the development of foreign owned pharmaceutical company in Indonesia.
Despite pharmaceutical industry in Indo-nesia facing many challages, in fact its mar-ket share is still very attractive and promising. Thus, to improve competitiveness in order to expand market share, pharmaceutical compa-nies are required to be more productive and ef-ficient in running the company operations.
Based on the problems stated above, this paper aims to investigate the efficiency and productivity of publicly owned pharmaceuti-cal company in Indonesia. Several research-ers have studied efficiency and productivity of pharmaceutical industries, most of which are conducted in Europe, Japan and India (Fare et al., 1995; Gonzales and Gascon, 2004; Danzon et al., 2005; Hashimoto et al., 2008; Saranga and Phani, 2008; Mazumdar and Rajeev, 2009;
and Pannu et al., 2011). Conversely, the effi -ciency and productivity of pharmaceutical in-dustries in the South East Asian region -such as Indonesia- are rarely studied. Therefore, this study tries to expand the body of research conducted previously in Europe, Japan and In-dia, by conducting the study in Indonesia. This study also compares relative efficiency meas -ured with DEA with efficiency calculated us -ing efficiency financial ratios. Furthermore, this study tests whether difference of means exists between the efficiencies of local and foreign owned pharmaceutical companies, as well as identifying changes in productivities and the dominant determining factors.
Review of Related Studies
Most of the previous studies regarding the pharmaceutical industries are motivated by various constraining regulations in relation of the pharmaceutical industries themselves (Gombola and Ketz, 1983; Lothgren and Tam-bour, 1998; Barnum et.al., 2001; Gonzales and Gascon, 2004; Saranga and Phani, 2008; Ma-zumdar and Rajeev, 2009; Xu and Wang, 2009; Lin et al, 2011; Pannu et al., 2011; Maricica and Georgeta, 2012; Patel and Pande, 2012; Delen, Kuzey and Uyar, 2013). Saranga and Phani (2008) discovered that positive relations exist between internal efficiency and corporate growth in the dynamic environment of Indian pharmaceutical industries. The dynamic envi-ronment was influenced by the changes in regu -lation regarding foreign ownership of pharma-ceutical companies from a maximum of 40% to 74% and also of Intellectual Property Protection (IPI). This finding is further strengthened by the study of Pannu et al. (2011) which discovered that a pharmaceutical corporation with higher efficiency enjoys higher compounded average growth rate (CAGR) of their sales.
Mazumdar and Rajeev (2009) studied fac-tors influencing the efficiency of pharmaceuti -cal corporations, such as corporate size, exist-ence of R&D unit, target market segment and existing products. The study concludes that large pharmaceutical corporation has greater
efficiency due to the profits from invested tech -nological innovations. They also find that the sector experienced rapid technological progress in recent years. Leading to a rise in the ineffi -ciency for this sector, the most firms have failed to appropriate the benefits of the technological change. Their other finding mentioned that in the context of the Indian pharmaceutical indus-try, an extremely effective strategy for firms’ benefit from efficiency and technological gains can be implemented by merging vertically with downstream raw material.
Conversely, the existence of R&D unit was found to have no significant effect to corpo -rate efficiency. However, firms that invested in R&D profited from technological innovation. This suggests that the few frontier firms prof -ited most from their R&D related outlays, but this investment enlarged the distance between the inefficient and efficient firms. Large firms that invested more in R&D have profited from technological growth. Thus, firms can expand their production possibilities, enabling them-selves to realize higher margins by increasing the scale of operation backed by sufficient R&D activity. This finding supports earlier study by Hashimoto and Hanaeda (2008) in Japanese pharmaceutical companies which assessed that the existence of R&D unit is meant to increase company value more rather than increase cor-porate efficiency. The firms have continued to increase R&D expenditure every year although R&D efficiency has not improved. Possibly, firms might have found another meaning of R&D expense than R&D itself. However, it is certain that there has been the shortage of firms’ R&D efficiency evaluation.
Alternatively, Pannu et al. (2011) proved that the existence of R&D unit can increase ef-ficiency. Pannu found that the efficiency and productivity change leaders and laggards over 10 year period. Pannu also proved that the ef-ficiency of local companies is lower than the average efficiency of MNCs between 1998 and 2007. However, there is no difference between multinational and local companies in the av-erage productivity change between 1998 and 2007. According to this paper, close to 70% of local companies have average efficiency scores
less than the worst efficiency score among MNCs. This basically shows that the input–out-put balance among multinational companies is better than that of Indian companies. They also noticed that the inefficient companies are lower than the CAGR of efficient companies. Also, they have analysed the effect of firm size and found that compared to small and micro firms, larger firms posted a higher CAGR, efficiency and relative efficiency. However, smaller firms led the larger firms in productivity change and technical change. Their finding shows that, though it is declining for both the groups after 2004 for the ten year period, efficiency of in -novative firms was higher than non-in-novative firms on a year to year basis. While neither global nor domestic market orientation influ -ences efficiency, local regulation significantly influences them. Finally, corporations which produce bulk of medicines and formulation medicine were found to have greater efficiency so that integrated production strategy would lead to greater efficiency in pharmaceutical companies. This finding supports earlier find -ing by Saranga and Phani (2008). They have seen that the internal efficiency ratings are not dictated by size of a company. Excepting for a few instances where companies which were in the mode of expansion, the methodology estab-lish the fact that there is a direct relationship between internal efficiencies and higher growth rates. Those instances may not have achieved full efficiencies. Internal efficiencies have been established by the local companies in bulk medicine and formulation businesses, which have helped them to arise so far, will also play a principle role in grabbing the new opportuni-ties of product patent era, to survive and arise in future.
in-crease on productivity, technological changes and efficiency changes when quality was en -tered in the equation.
Proposing a modification of the DEA net -work model by Fare and Grosskopf (1996), Lothgren and Tambour (1998) allow a repre-sentation of both production and consumption technologies in a unified framework. The inputs directed to customer activities, together with the production quality attributes is presumed to give customer satisfaction, here represented by assessments of quality from barometer surveys of customer satisfaction. The results obtained from the network model and non-network productivity model are similar in some ac-knowledgement. In both models the estimated productivity change is positive. However, the network model indicates a lower estimated pro-ductivity progress than the non-network model. The progress in productivity is indicated by both the efficiency and technical change com -ponents in the Malmquist index decomposition. The accounts of technical change component for most of the progress, although this is more clear in the non-network model than in the net-work model. However, there are some differ-ences regarding which pharmacies are experi-encing progress and regress in productivity in the different models. Taking customer satisfac-tion into account, the network model proposed by Lothgren and Tambour (1991) was con-structed with the purpose to estimate efficiency and productivity for the sample of pharmacies. However, it should be noted that the proposed model can be applied to arbitrary industries as long as the data include information on cus-tomer satisfaction, production quality attributes and firm-specific input allocation to customer and production oriented activities. It means that the proposed model is not limited to the specific pharmacy application.
Gonzales and Gascon (2004) examined the productivity of pharmaceutical laboratories af-ter the deficit cero policy in Spain which caused many pharmaceutical companies to reduce their profit margin. They discovered that pure tech -nical efficiency change and scale efficiency change are the two dominant factors influenc -ing productivity growth. Similar find-ing was
obtained in the Indian pharmaceutical industry under the amended Medicines and Cosmetic Act (Mazumdar and Rajeev, 2009). It also found that technological innovation applied by the Indian companies does not increase produc-tivity growth.
Focusing the study on performance evalua-tion of pharmacy retail stores, Patel and Pande (2012) found that retail stores are operating at average efficiency levels and there is a lot of improvements scope. The stores performing inefficiently need to focus upon their footfalls, sales, operating expenses and store size. Ex-periencing increasing returns to scale is a well planned strategy that must be practiced by the inefficient stores. The most suitable strategy for the stores experiencing decreasing returns to scale, however, is to lower down their scale of operations. Patel and Pande conclude that the study provides a framework for performance evaluation of pharmacy retail stores along with identification of efficient drivers of performance
Suggesting DEA model in hospital pharma-cies, Barnum et al. (2001) developed a study of integrated procedures that can both mitigate the problems and take advantage of the fre-quent and detailed information now available. First, they suggest a set of compatible and comprehensive measure of distributional and clinical output, some of which are only avail-able because of the computerized information system. As a result, all of the key distributional and clinical outputs are covered. Second, they suggest DEA models that can separately sum-marize the efficiency of the pharmacies’ clinical and distributional activities; with a third model that appraises the pharmacies’ comprehensive efficiency as a whole. Third, it suggests a meth-odology for developing statistical control charts through the use of statistical PDA models, so pharmacy managers can quickly and accurately differentiate when conditions are indeed out of control and when the reports merely reflect ran -dom variations. They believe that the collective use of these suggestions could provide signifi -cant assistance to hospital pharmacies seeking to increase and maintain their efficiency.
In that study, Xu and Wang (2009) explained on their paper. They propose a prediction approach using efficiency of corporation as a predictor. The efficiency and some selected financial ra -tios are then used as predictors in prediction methods. The numerical results of application to corporations in Shanghai stock exchange validate the efficacy of the proposed prediction scheme.
Lin, Liang and Chen (2011) study a set of financial features that includes 21 commonly used financial ratios that are expected to achieve a more accurate prediction of corporate finan -cial distress than a model based exclusively on scholars’ survey results from experts. In a simi-lar case, identifying and using a simi-large and fea-ture rich dataset was studied by Delen, Kuzey and Uyar (2013). After a long search they iden-tified FINNET, a company providing variety of financial data, software, and Web-based analy -sis tools to their members. They covered the time period of 2005 to 2011 for the final dataset of financial ratios. They find that profitability ratios can predict financial distress well. These ratios indicate the potential ability of a com-pany in case of controlling costs and expenses. The more successfully the firm can control its costs and expenses, and by improving its per-formance (represented as ROE and ROA), the higher these ratios. Further, the Leverage and Debt Ratios are also found to be able to predict financial distress as well.
Either classic or modern bankruptcy predic-tion model, are principally based on financial ratios. The study was done by Maricica and Georgeta (2012). They argue about the impor-tance of the information quality provided by fi -nancial ratios in bankruptcy prediction because it impacts on the accuracy of the bankruptcy prediction. Surely this can be used to measure how efficiently a resource that can be used by the company, which in this study is the financial resources.
Methodology
Efficiency measures were calculated using non parametric approach with Data Envelop-ment Analysis (DEA) method introduced by
Charnes et al. (1978). Efficiency measures us -ing DEA involves a minimum of one output and three inputs (Pannu et al., 2011), in which sales is the only output entered while the in-puts entered are 1) Cost of Material, 2) Cost of Manpower, and 3) Capital Cost. The last input, capital cost, was calculated from the total cost of sales and production minus the cost of raw material and worker’s compensation.
In calculating efficiency using panel data, efficiency measurement was conducted using DEA-like linear programs while the Malmquist Total Factor Productivity (TFP) Index was employed to measure productivity change as well as to decompose productivity change into technological change and technical efficiency change.
Caves et al. (1982) showed that productivity changes can be assessed by Malmquist indices, defined in terms of ratios of distance functions. Following Fare et al. (1995) an input-based Malmquist productivity index for the P-Node can be defined (and decomposed) as:
1)
2)
where is the distance function which measures the maximum proportional change in outputs required to make (xt+1, yt+1)
feasible in relation to the technology at time t. Productivity improvement is signaled by a Malmquist index less than one and a negative change in productivity is signaled by an index greater than one. The term outside the brackets, Ei, measures change in efficiency and can be in -terpreted as a ``catching up'' (to the production frontier) effect. The TCi term measures change in technology in terms of shifts in the produc-tion frontier.
The Malmquist Productivity change index was specified based on Fare et al. (1994) as follows:
The value (xt+1, yt+1) is the value of produc-tivity relative to (xt, yt). The value of produc-tivity greater than one indicates the existence of positive TFP growth from period t to period t+1. This index was derived from four linear programming functions, as follows:
2.2)
Function 2.2 above is the function of Varia-ble Return to Scale (VRS). VRS is the assump-tions used on the basis that no company in the pharmaceutical industry is currently operating at optimal level due to imperfect competition, one of which is caused by the government reg-ulation. While the other three linear program-ming functions are:
2.3)
2.4)
2.5)
Whereas θ is a scale, λ is the vector Nx1 at the condition of constant return to scale, yi is the output and xi is the input, Y is the matrix output for all companies in the industry, X is the matrix input for all companies in the industry while N1λ = 1 is the convexity constraint ensur-ing that an inefficient company is selected as benchmark for similar sized companies.
Additionally, other than efficiency measures using DEA, this study also used financial ratios represented by cash efficiency ratio (cash ra-tio, quick ratio and current ratio)and asset
ef-ficiency ratio (Inventory turnover, net working
capital turnover, fixed asset turn over and total asset turnover).
Ross (2008) explained the formula for all the financial ratios in this study. Xu and Wang (2009) using quick ratio, cash ratio, inventory turnover and total asset turnover as the predic-tors in prediction methods for financial failure prediction. Maricia and Georgeta (2012) us-ing current ratio and quick ratio to analyze the business failure risk in their study. Delen et. al. (2013) using Liquidity ratios (cash ratio, quick ratio, current ratio) and turnover ratios (inven-tory turnover, net working capital turnover,
fixed asset turnover and total asset turnover) for measuring firm performance with a decision tree approach. The ability of a company to pay a short-term debt can be evaluated by liquidity ratios, whereas long-term solvency ratios used to investigate the risk level of an investment in the firm could be for creditors. Turnover ratios used to measure the success level of the compa-ny, so that it generates revenues through utiliz-ing assets, collectutiliz-ing receivables, and sellutiliz-ing its inventories. According to the previous related studies, this paper used the following efficiency ratios:
Current ratio = 3)
Quick ratio = 4)
Inventory turnover =
5)
Net working capital turnover =
6)
Net working capital = current assets - current liabilities 7)
Fixed asset turnover = 8)
Total asset turnover =
9)
Cash Ratio =
Data and Design
This study is an explanatory analysis which aims to explain the value of relative efficiency and productivity changes produced from three inputs to a single output. The data employed in this study are balanced panel data covering the entire pharmaceutical companies listed in the Indonesian Stock Exchange period 2006 – 2011. During that period, there are twelve phar-maceutical company listed with various type of ownership. However, only eleven companies are included in the sample due to one company operates mainly in the supply of medical equip-ments and also incomplete data. All data was obtained through Thomson Reuters Knowledge and DataStream. Research framework em-ployed in the study is shown in Figure 1.
Empirical Result
Statistic Descriptive
The publicly listed pharmaceutical com-panies included as sample for this study can be categorized based on ownership into three
groups: 1) two state owned/majority compa-nies, 2) three privately owned domestic com-panies and 3) six foreign owned comcom-panies. In-puts and output values for each companies used in the DEA calculation are shown in Table 1.
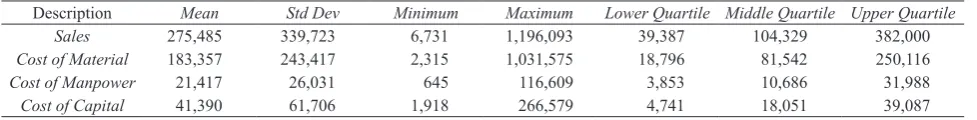
Descriptive statistics showed that the larg-est expenditure for Indonesian pharmaceutical companies is the cost of materials with an aver-age of USD183,357.18 covering raw materials, manufacturing and warehousing. The second is the cost of capital with an average of USD 41,390 covering fixed assets expenditures, ma -chinery installation and intangible assets. While the cost of manpower is the least expenditure allocated with an average of USD21,417.46 covering both direct and indirect labor costs. Thus, the proportion between the total cost of material, cost of capital and cost of manpower are 9:2:1 respectively. The size of expenditures of material is mostly due to the majority of raw materials for Indonesian pharmaceuticals which must be imported from various countries such as India, China and European countries. Thus the material cost is influenced heavily by the low value of Indonesian currency relative to the country of the suppliers.
Figure 1. Research framework
Table 1. Descriptive Statistics Analysis (in USD*)
Description Mean Std Dev Minimum Maximum Lower Quartile Middle Quartile Upper Quartile
Sales 275,485 339,723 6,731 1,196,093 39,387 104,329 382,000
Cost of Material 183,357 243,417 2,315 1,031,575 18,796 81,542 250,116
Cost of Manpower 21,417 26,031 645 116,609 3,853 10,686 31,988
Cost of Capital 41,390 61,706 1,918 266,579 4,741 18,051 39,087
Source: Output Stata 11 (Processed)
Companies Efficiency
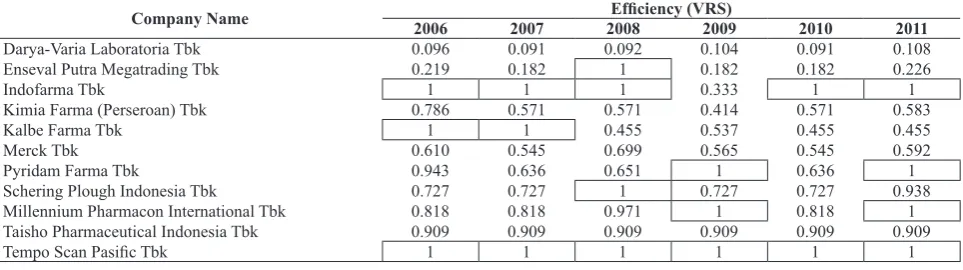
Table 2 illustrates the relative efficiency val -ue of Pharmaceutical Companies listed in the Indonesian Stock Exchange during the 2006-2011 periods using the DEA calculation. Effi -ciency value of 1 indicated the most efficient corporation.
Efficiency measurement using DEA showed that on average, the five most efficient compa -nies are Tempo Scan Pasific Tbk with efficiency value of 1,00, followed by Taisho Pharmaceuti-cal Indonesia Tbk (0.909), Millennium Phar-macon International Tbk (0.904), Indofarma Tbk (0.889) and Pyridam Farma Tbk (0.811). Conversely, the two least efficient pharmaceu -ticals companies in Indonesia are Darya-Varia Laboratoria Tbk (0.097) and Enseval Putra Megatrading Tbk (0.332). Based on the owner-ship, three out of five most efficient companies are foreign owned companies, one is a privately owned domestic company and one is a state owned/majority company.
Tempo Scan Pasific Tbk and Taisho Phar -maceutical Indonesia Tbk as the two top most efficient companies have different ownership structure, with Tempo Scan Pasific Tbk as do -mestic privately owned and Taisho Pharmaceu-tical Indonesia Tbk as foreign owned company. However, both are producers focusing on mak-ing and sellmak-ing Over the Counter (OTC) Medi-cations.
Tempo Scan Pasific Tbk sales of OTC medi -cations contribute to up to 90% of total sales,
while prescription only contributes 10% ( Ethi-cal) of total sales. Based on the 2011 data, the market share of Tempo Scan Pasific Tbk in the OTC segment reached up to 45.1% of total OTC sales in Indonesia5. Similar focus was also
adopted by Taisho Pharmaceutical Indonesia Tbk whose OTC sales contributed up to 78% of total sales6. Good target market and strong
focus on OTC sales has made this company to have the best efficiency in the Indonesia phar -maceutical industry. Thus, it can be said that stronger focus on OTC medicines might in-crease efficiency of Pharmaceutical companies in Indonesia.
This factor may be attributed to the greater size of annual total sales for OTC medicines as well as the tendency of Indonesia consumer to self prescribes their medication. Based on the data by the Indonesian Central Biro of Statistics (BPS) in 2010, majority people in Indonesia (68.71%) prefer to self medicate themselves, by choosing their medicine without doctor’s pre-scriptions. Additionally, 27.58% of Indonesians prefer self medication by using factory made traditional medicine recognized and registered by the Indonesian Health Ministry. This means, only 3.71% Indonesian prefer to doctor’s pre-scriptions when choosing medications and the rest prefers using self prescribed over the counter medicine sold openly in retail outlets. Such Indonesian demographic characteristics become the main reason Tempo Scan Pasific Tbk and Taisho Pharmaceutical Indonesia Tbk focusing on the production and sales of OTC
Table 2. Average Value of the Pharmaceutical Company Efficiency during 2006 – 2011 Period Using DEA
Company Name 2006 2007 2008Efficiency (VRS)2009 2010 2011
Darya-Varia Laboratoria Tbk 0.096 0.091 0.092 0.104 0.091 0.108 Enseval Putra Megatrading Tbk 0.219 0.182 1 0.182 0.182 0.226
Indofarma Tbk 1 1 1 0.333 1 1
Kimia Farma (Perseroan) Tbk 0.786 0.571 0.571 0.414 0.571 0.583 Kalbe Farma Tbk 1 1 0.455 0.537 0.455 0.455 Merck Tbk 0.610 0.545 0.699 0.565 0.545 0.592 Pyridam Farma Tbk 0.943 0.636 0.651 1 0.636 1 Schering Plough Indonesia Tbk 0.727 0.727 1 0.727 0.727 0.938 Millennium Pharmacon International Tbk 0.818 0.818 0.971 1 0.818 1 Taisho Pharmaceutical Indonesia Tbk 0.909 0.909 0.909 0.909 0.909 0.909
Tempo Scan Pasific Tbk 1 1 1 1 1 1
Source: Output Deap (Processed)
5 http://www.indonesiafinance today.com
medicines enjoy greater efficiency relative to other pharmaceutical companies with less focus on OTC medicine.
However, such demographic characteristic may come as a shock since according to the 2010 Census by the Indonesian Central Biro of Statistics; up to 31,023,400 people (16.56%) of the total population are considered below the poverty line. While the Indonesian govern-ment through the Ministry of Health provides free health care and medical treatment in form of the Health Insurance (ASKES), the Public Health Insurance (JAMKESMAS) and the Lo-cal Public Health Insurance (JAMKESDA) for 40% of the poorest Indonesians to enable their access to better health care (Holloway, 2011). Ideally, with the lower portion of poor people and better access to health care, people would use that opportunity to go to health care facility and consume medication as prescribed by the doctor instead of doing self medication.
Therefore, there are two possible explana-tions on why Indonesians still prefers self-med-ication than doctor’s prescriptions. First, gov-ernment health care aid might not reach the real segment, thus many of the poorer population can not access health care aids given in medical facilities due to their financial limitation. This condition forces them to consume OTC medica-tion sold in retail outlets rather than prescribed medicines. Second, the mind set of many Indo-nesians may really prefer OTC medicies, thus avoiding or ignoring the doctor’s prescriptions
when they are ill.
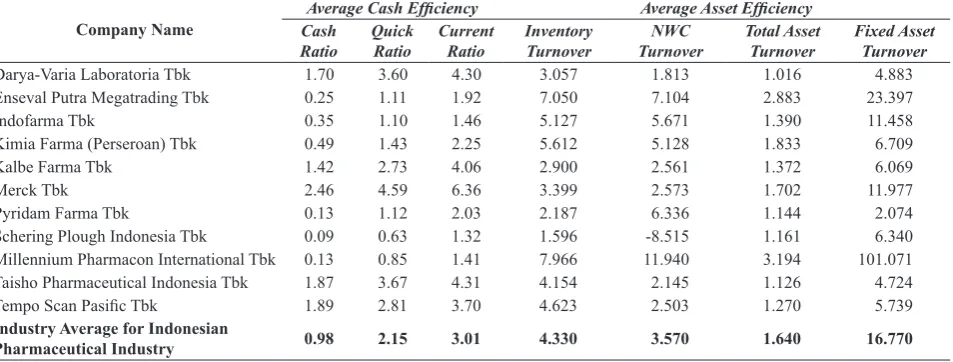
On the other hand, even though both Tempo Scan Pasific Tbk and Taisho Pharmaceutical Indonesia Tbk have the greatest relative effi -ciency based on DEA calculation, their finan -cial efficiency ratios are not better than those with lesser relative efficiency. Tempo Scan Pas -ific Tbk and Taisho Pharmaceutical Indonesia Tbk has cash efficiency ratio above the industry average, while Millennium Pharmacon Interna-tional Tbk has the lowest cash efficiency ratio in the idustry (See Table 3). Lower cash effi -ciency ratio means greater ability of the compa-ny to manage their cash and current assets. On the other hand, Millennium Pharmacon Interna-tional Tbk has the highest asset efficiency ratio in the industry, while Tempo Scan Pasific Tbk and Taisho Pharmaceutical Indonesia Tbk have below average ratios. Asset efficiency ratio im-plies that higher ratios means higher efficiency in utilizing their assets.
Millennium Pharmacon International Tbk has asset turnover ratio of 101.071, well above the industry average of 16.77 as shown in Ta-ble 3. This is due to the core business of the company which focuses on the distributions of pharmaceutical products. As a distributor, Mil-lennium Pharmacon International Tbk does not need fixed assets as large as the manufacturers which mass produce pharmaceutical products. Therefore, the company obtained far greater
fixed asset turnover compared to others in the industry.
Table 3. Average Value of the Pharmaceutical Company Efficiency during 2006 – 2011 Period Using Efficiency Financial Ratios (in times)
Company Name Cash Average Cash Efficiency Average Asset Efficiency
Ratio Quick Ratio Current Ratio Inventory Turnover TurnoverNWC Total Asset Turnover Fixed Asset Turnover
Darya-Varia Laboratoria Tbk 1.70 3.60 4.30 3.057 1.813 1.016 4.883 Enseval Putra Megatrading Tbk 0.25 1.11 1.92 7.050 7.104 2.883 23.397 Indofarma Tbk 0.35 1.10 1.46 5.127 5.671 1.390 11.458 Kimia Farma (Perseroan) Tbk 0.49 1.43 2.25 5.612 5.128 1.833 6.709 Kalbe Farma Tbk 1.42 2.73 4.06 2.900 2.561 1.372 6.069 Merck Tbk 2.46 4.59 6.36 3.399 2.573 1.702 11.977 Pyridam Farma Tbk 0.13 1.12 2.03 2.187 6.336 1.144 2.074 Schering Plough Indonesia Tbk 0.09 0.63 1.32 1.596 -8.515 1.161 6.340 Millennium Pharmacon International Tbk 0.13 0.85 1.41 7.966 11.940 3.194 101.071 Taisho Pharmaceutical Indonesia Tbk 1.87 3.67 4.31 4.154 2.145 1.126 4.724
Tempo Scan Pasific Tbk 1.89 2.81 3.70 4.623 2.503 1.270 5.739
Industry Average for Indonesian
Pharmaceutical Industry 0.98 2.15 3.01 4.330 3.570 1.640 16.770
Differences in the order of the most to the least efficient companies between DEA and the efficiency financial ratio may be attributed to the number of factors entered. In order to measure efficiency, DEA used multiple inputs to assess one or more outputs; while financial ratio can only use one input to assess one out-put in a given time. This limitation of efficiency
financial ratios to describe the overall company activities in measuring efficiency may lead to a bias in measurements (Saranga and Phani, 2008).
One interesting finding is the efficiency of Indofarma Tbk, which obtain the best relative efficiency together with Tempo Scan Pasific Tbk in five out of the six periods employed in the study. Indofarma Tbk is one pharmaceuti-cal company which per Desember 2011, was majority owned by the state (80.1%), while 19.3% of the shares was owned by public and 0.6% owned by the employees. This is contrary to the well known fact that this company has low profitability. There are several possible explanations to this finding. First, that is effi -ciency measurement using DEA assumed that sales, and not profitability to be the output of pharmaceutical companies. Thus, even though Indofarma Tbk may have low profitability, this is not due to low sales volume. As known, Indo-farma Tbk as Majority State Owned-company has greater authorization to distribute pharma-ceutical products than foreign owned or domes-tically owned private companies. As the largest producer of generic medicines in Indonesia, In-dofarma Tbk distributes its production to vari-ous government owned service centers in the capital as well as in the provinces. Even though the margin for generic medicines has been set to a minimum by the government, the large vol-ume of sales in generic medicines has kept In-dofarma Tbk efficient.
Second, the efficiency gained by Indofar -ma Tbk -may have been obtained due to tangi-ble assets supporting the production capacity. Historical record showed Indofarma Tbk as the first pharmaceutical company founded by the Dutch-Indian colonial government. At that time, the colonial government invested large capacity machinery to mass produce medicines,
thus gave Indofarma Tbk a head start as the prime supplier of medicine to Indonesians. This head start in production capacity enabled lower and more efficient fixed costs for the company due to process innovation, which is conduct-ing manufacturconduct-ing process at the lowest possi-ble cost by maximizing the economies of scale (Belcher and Nail, 2000).
However, when measured using efficiency
financial ratio, Indofarma Tbk has a slightly lower total asset turnover than Kimia Farma (Perseroan) Tbk, even though Indofarma Tbk still has better overall cash and asset efficiency. Kimia Farma (Perseroan) Tbk is another state owned/majority pharmaceutical company in-cluded in the sample. Even though they are both state controlled, Kimia Farma (Perseroan) Tbk has greater total sales due to more vertically integrated operation while Indofarma Tbk fo-cuses more on the production of generic medi-cines with lower price per unit. This shows that, despite larger the sales volume, Indofarma Tbk has lower ratio of sales to total asset compared to Kimia Farma (Perseroan) Tbk due the low cost nature of generic medicines it produces.
During 2009, Indofarma Tbk experiences a sharp drop in efficiency from 1.00 in 2008 to only 0.33 in 2009. This drop in efficiency is due to the increase of raw material price im-ported mostly from India. The price increased due to the global financial crisis which led to the devaluation of Rupiah. The problem thus compounded due to the inability of Indofarma Tbk to cross subsidize the production of gener-ic medgener-icines, thus forcing the management to postpone the import of raw material and reduc-ing the production of least profitable products. This decision resulted in the decrease of sales which in turn reduces efficiency. This condition does not affect Indofarma Tbk alone, but also influences other pharmaceutical companies, such as Pyridam Farma Tbk, Kalbe Farma Tbk, Schering Plough Indonesia Tbk, Kimia Farma (Perseroan) Tbk and Merck Tbk, as shown in their lower efficiency during the 2008-2009 pe -riods.
board, according to DEA calculation Darya-Varia Laboratoria Tbk and Enseval Putra Meg-atrading Tbk was shown to be the least efficient on average, relative to other pharmaceutical companies operating in Indonesia. Darya-Varia Laboratoria Tbk is a foreign owned pharmaceu-tical company which focuses on the prescribed medicine segment, contributing up to 51% of their total sales compared to 36% contribution of consumer health products. This focus on prescribed medicine is in total opposite to the strategy of Tempo Scan Pasific Tbk and Taisho Pharmaceutical Indonesia Tbk which are shown as the most efficient companies of publicly listed pharmaceutical companies in Indonesia. This difference in product and consumer target may be the cause of differences in efficiency between the companies.
Not only when calculated using DEA, the efficiency of Darya-Varia Laboratoria Tbk was also low when calculated using financial ratios. On average, Darya-Varia Laboratoria Tbk has greater cash efficiency ratios (See Table 3), which means that Darya-Varia Laboratoria Tbk reserved more current assets to meet its short term liabilities, which led to less efficient uti -lization of cash. Conversely, its asset efficiency ratio was constantly above the industry aver-age, implying that the company’s asset utiliza-tion was relatively efficient.
Enseval Putra Megatrading Tbk is a domes-tic private owned pharmaceudomes-tical company. In contrast to other pharmaceutical companies which experiences sharp decrease of efficiency in 2008 due to the global financial crisis. En -seval Putra Megatrading Tbk experienced the best efficiency relative to other Indonesian phar -maceutical companies, despite having lower ef-ficiency during other periods. The calculation using DEA was in opposite to the calculation using financial ratio. On average, the cash effi -ciency ratio of Enseval Putra Megatrading Tbk are lower than industry average while on aver-age the asset efficiency ratio was consistently higher than the industry average. This showed that according to the financial ratios, Enseval Putra Megatrading Tbk was efficient in manag -ing its cash and assets.
Domestic vs Foreign Efficiency Companies
Based on differences in the efficiency be -tween groups of domestic and foreign owned pharmaceutical companies, this study tests the significance of such differences. This idea stems from the regulations regarding pharma-ceutical companies in Indonesia considered to be constricting to foreign pharmaceutical play-ers united in the International Pharmaceutical Manufacturers Group7.
Despite the government effort to relax the regulation regarding foreign owned pharma-ceutical companies, existing regulation are still tought to be strong disincentive for foreign in-vestments in the pharmaceutical industry. Such disincentive, if true, would constrict the activi-ties of foreign owned pharmaceutical compa-nies proven by differences in the size of invest-ment activities between domestic and foreign owned pharmaceutical companies.
Based on Table 4, the top three companies with the largest investment activities are Kalbe Farma Tbk, Tempo Scan Pasific Tbk and En -seval Putra Megatrading Tbk which were all domestic owned companies. On the other hand, two companies with the least investment activi-ties are Millennium Pharmacon International Tbk and Pyridam Farma Tbk which were both foreign owned companies. Also, t-test in Table 5 shows there are significant differences in in -vestment activities between domestic against foreign owned company at confidence level 95%.
Further testing was also conducted to com-pare the differences between the efficiency of domestic and foreign owned companies using independent sample t-test with confidence level of 95%. Whereas, the hypothesis for this test is: Ho: There is no difference between the average
efficiency of domestic and foreign-owned pharmaceutical companies in Indonesia. Ha: There is a difference between the average
efficiency of domestic and foreign-owned pharmaceutical companies in Indonesia. Based on the test result shown in Table 6, the null hypothesis can not be rejected. This means that there is no difference between the
average efficiency of domestic and foreign-owned pharmaceutical companies in Indonesia. This result is in contrast to the finding of Pannu et al. (2009), which stated that partially, for-eign- owned companies has lower efficiencies than domestic-owned companies due to lesser size of investments. This outcome led to ear-lier hypothesis that foreign-owned companies may not be able to achieve optimum economies of scale due to regulation issues. The current finding in this study, however, showed that on average there are no differences between the ef-ficiencies of domestic and foreign-owned phar -maceutical companies in Indonesia.
The absence of differences between the mean efficiency of domestic and foreign owned group of companies refute the opinion that
ex-isting government regulation, such as owner-ship proportion and importing licence policies, may constrain the operation of foreign owned companies disproportionately. Foreign owned pharmaceutical companies such as Taisho Phar-maceutical Indonesia Tbk, Millennium Pharma-con International Tbk and Pyridam Farma Tbk can operate efficiently and compete with vari -ous domestic companies, both private and state controlled. This result supports the hypothesis that market and product selection influences ef -ficiency. Companies which sold more over the counter medicines has greater efficiency than companies which sold more prescribed medi-cines, irrespective of their ownership.
The absence of differences between foreign and domestic companies does not refute the
Table 4. Investment Activities of Indonesian Pharmaceutical Companies during 2006 – 2011 Period (in USD*)
Company 2011 2010 2009 2008 2007 2006
Kalbe Farma Tbk 69,236,695 25,472,841 70,826,292 20,435,093 4,638,538 28,543,070
Tempo Scan Pasific Tbk 19,846,264 9,327,774 11,118,622 3,929,222 8,408,318 6,555,360 Enseval Putra Megatrading Tbk 17,153,736 15,213,541 10,251,070 5,543,729 5,584,769 -20,331,943 Kimia Farma (Perseroan) Tbk 5,968,287 1,462,197 8,105,125 2,915,725 3,094,700 2,525,623 Darya-Varia Laboratoria Tbk 3,751,344 3,491,166 2,182,377 1,749,259 3,637,551 1,037,529 Taisho Pharmaceutical Indonesia Tbk 1,428,948 2,422,583 461,648 1,537,803 2,274,333 855,810 Schering Plough Indonesia Tbk 1,171,513 428,618 627,236 446,944 878,525 1,305,278 Indofarma Tbk 378,909 496,214 2,074,289 1,113,355 811,588 20,191 Pyridam Farma Tbk 229,123 299,901 205,201 206,408 513,113 150,664 Millennium Pharmacon International Tbk 116,098 205,531 682,761 1,079,008 325,908 67,047 Merck Tbk -9,811,588 2,336,772 1,829,913 1,412,488 868,649 549,325 Source: Annual Cash Flow - Reuters Knowledge (2011)
*Selling rate: Rp 9.113/USD published by Bank Central of Indonesia per December 30th, 2011
Table 5. Descriptive Statistics Independent Sample t-test between Indonesian Domestic and Foreign Owned Pharmaceutical Companies in Investing Activities
Ownership Obs. Investment
Mean Variance
Domestic 30 24.79 17.05
Foreign Owned 36 109.63 30.51
t-statistics -24.272
p-value 0.0192
Source: Output Stata (Processed)
Table 6. Descriptive Statistics Independent Sample t-test between Indonesian Domestic and Foreign Owned Pharmaceutical Companies
Ownership
n
Average Efficiency
Mean Variance
Domestic 5 0.690733 0.117688
Foreign Owned 6 0.686917 0.126936
t-statistics -0.022
p-value 0.9829
view that Indonesian pharmaceutical industry may be considered as a highly regulated in-dustry in comparison to other pharmaceutical industries in South East Asia. The strict regu-lation may force foreign owned companies to abide the regulations by allocating their invest-ments to build manufacturies and purchase heavy machineries as well as operational li-cence in Indonesia. The large initial cost may reduce efficiency across the board and lengthen the break even point to new entrants, compared to existing players. On the other hand, the regu-lation for domestic companies may have been set more relaxed in a way that the market near-ly becomes perfect competition, which enables players to enter and exit the market freely. This condition forces existing players to adopt price penetration strategy to be able to compete and sell more products. This strategy in turn caused domestic players to be relatively less efficient in generating revenues than it should be (Ma-zumdar dan Rajeev, 2009). Both sides of the regulation experiences different challenges which created inefficiencies, thus domestic and foreign owned pharmaceutical companies in In-donesia exhibit relatively similar level of effi -ciency regardless of ownership and regulations.
Productivity Changes
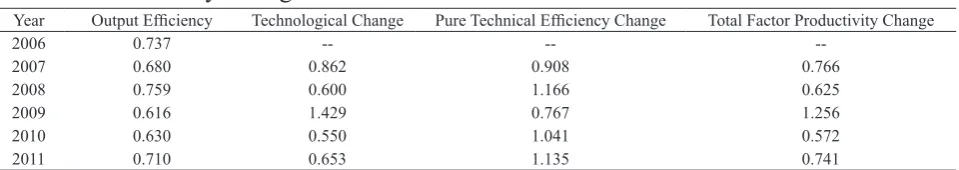
It is shown in the second column of Table 6 that the average output efficiency of pharma -ceutical companies in Indonesia is 0.737. This meant that on average pharmaceutical compa-nies in Indonesia can increase their output by 26% without adding any additional input. The fluctuating average output efficiency between the 2006 to 2011 period indicates two possible outcomes. First, an outward shift may occur across the board when the average efficiency
increases, which meant an increase of inter-nal efficiency from each decision making unit (DMU) below the frontier. Second, an outward shift may occur only to DMU at the frontier, when the average efficiency decreases, which may indicate technological or process innova-tion which increases the gap efficiency between the leader and the rest of the industry. Thus, internally this also meant decrease in relative efficiency across the board to players below the frontier (Mazumdar dan Rajeev, 2009).
The third column in Table 7 shows techno-logical change of greater than one means that there may be technological applications which increase efficiency significantly, relative to the previous year. Data showed that the Indonesian pharmaceutical industry only experienced one increase (progress) during the 2006-2011 peri-ods, which is during 2009 with an increase of Technological Change of 43%. This increase in Technology may occur when new entrants utilize superior technology or existing players invest in a new technology which influences the frontier and existing DMU below the frontier (Mazumdar dan Rajeev, 2009). However, more accurate explanation would be that the global financial crisis in 2009 forced existing players to upgrade their technology to cope with the fluctuation of raw material prices due to curren -cy fluctuations, by using less input to produce more or the same amount of output.
The fourth column of Table 7 shows Effi -ciency Change which explains the changes in efficiency between periods. Efficiency change
of greater than one showed an increase in ef-ficiency from the previous year, while a value of less than one showed a decrease in efficiency from the previous year. During 2007 and 2009, Indonesian pharmaceutical industry experi-enced decrease in average efficiency of 9% and
Table 7. Average Efficiency, Technological Change, Efficiency Change and Total Factor Productivity Change
Year Output Efficiency Technological Change Pure Technical Efficiency Change Total Factor Productivity Change
2006 0.737 -- --
--2007 0.680 0.862 0.908 0.766
2008 0.759 0.600 1.166 0.625
2009 0.616 1.429 0.767 1.256
2010 0.630 0.550 1.041 0.572
2011 0.710 0.653 1.135 0.741
23% when compared to 2006 and 2008, respec-tively. While during year 2008, 2010 and 2011, there were increasing in the average efficiency from earlier year, of 16%, 4.1% and 13.5% re-spectively.
Compared to the technological change, the level of efficiency change tends to be more fluctuative, even though the overall techno-logical change was decreasing. This showed that companies in the Indonesian pharmaceu-tical industry could increase their efficiency without increasing application of technologies. However, in overall the Total Factor Productiv-ity (TFP) shown in the fifth column of Table 7 showed TFP decreased during the decrease in Technological change and increased during the application of newer technology. In other words, TFP are more affected by technologi-cal changes rather than changes in internal effi -ciency. This finding may be contradictive to the findings of Gonzales and Gascon (2004) study -ing the Spanish pharmaceutical industry along with Mazumdar and Rajeev (2009) studying the Indian pharmaceutical companies. Both study found that TFP was affected more by changes in the internal efficiency rather than techno -logical changes. This difference showed that the Indonesian pharmaceutical companies can enjoy the benefits of technological innovations in producing pharmaceutical products due to an increase of efficiency.
In summary, the findings in this paper suggest the importance of using a more accurate meas-ure based on an input-output framework, such as DEA, to evaluate firm efficiency instead of relying on efficiency measures based on finan -cial ratios. Different with previous studies, such as Pannu et al. (2011), this paper does not find significant difference between the efficiency of foreign owned and locally owned pharmaceuti-cal companies. One possible explanation about this finding is the stricter regulation in the Indo -nesian pharmaceutical industry which hinders the benefits of economies of scale and transfer of technology. However, whether and how reg-ulation may impact firm efficiency in different countries, especially in the pharmaceutical in-dustry, may need further research.
Conclusion
This study concludes that the five topmost efficient pharmaceutical companies in Indone -sia are Tempo Scan Pasific Tbk, Taisho Pharma -ceutical Indonesia Tbk, Millennium Pharmacon International Tbk, Indofarma Tbk and Pyridam Farma Tbk. Calculating efficiency using DEA are more accurate than using efficiency finan -cial ratios due to its capability in capturing all aspect of company activities rather than a partial view as used in the ratios. It is also in line with research Xu and Wang (2009) which states that, in the proposed prediction scheme, the efficiency of corporation is more efficient obtained through DEA rather than using effi -ciency financial ratio analysis.
Further, this study finds no evidence that foreign owned pharmaceutical companies are more efficient than local companies. Differ -ences in efficiency are more due to selection of market and product segment rather than owner-ship. Companies with greater sales contribution of over the counter medicine are generally more efficient than companies which focus on pre -scribed medicines. This study also showed that the Total Factor Productivity (TFP) of Indone-sian pharmaceutical industry is more influenced by technological changes than changes in inter-nal efficiency. This finding is in opposite to the findings in India and Spain in which changes in TFP is influenced more by changes in internal efficiency rather than technological changes.
References
Barnum, Darold T., Shield, Karen L., Walton, Surrey M., Schumock, and Glen T., 2011, Improving the Efficiency of Distributive and Clinical Services in Hospital Pharmacy, J. Med. Syst. 35 : 59–70
Belcher, T., and Nail, L., 2000, Integration Problems and Turnaround Strategies in A Cross-border Merger A clinical Examina-tion of the Pharmacia-Upjohn Merger, In-ternational Review of Financial Analysis 9, 219,234
Coelli T., Rao, and Battese, G., 2001, An In-troduction to Efficiency and Productiv -ity Analysis, Second ed, Kluwer Academic Publisher, London,
Danzon, P,M., Nicholson, S., and Pereira, N,S., 2005, Productivity in pharmaceutical-bio-technology R&D: the role of experience and alliances, Journal of Health Economics 24, 317,339
Delen, Dursun, Kuzey, Cemil., Uyar, and Ali., 2013, Measuring firm performance using financial ratios: A decision tree approach, Expert Systems with Applications 40 (2013) 3970–3983
Färe, R., Grosskopf, S., Norris, M., and Zhang, Z. (1994). Productivity growth, technical progress, and efficiency change in industri -alized countries. The American economic review, 66-83.
Fare, R., Grosskopf, S., and Roos, P., 1995, Productivity and Quality Changes in Swed-ish Pharmacies, International Journal of Production Economics 39, 137,147
Gombola, Michael J., Ketz, and J. Edward, 1983, Financial Ratio Patterns in Retail and Manufacturing Organizations, Finan-cial Management, Vol. 12, No.2 (Summer), pp.45-56
González, E., and Gascón, F., 2004, Sources of Productivity Growth in The Spanish Phar-maceutical Industry (1994–2000), Research Policy 33, 735,745
Hashimoto, A., and Haneda, S., 2008, Measur-ing The Change in R&D Efficiency of The Japanese Pharmaceutical Industry, Research Policy 37, 1829,1836
Holloway, K., A., 2011, Indonesia
Pharmaceu-ticals in Health Care Delivery, WHO Mis-sion Report 10 – 23 July 2011
Lin, Fengyi., Liang, Deron., Chen, and Enchia., 2001, Financial ratio selection for business crisis prediction, Expert Systems with Appli-cation 38 (2011)
Löthgren, Mickael., Tambour, and Magnus., 1999, Productivity and customer satisfaction in Swedish pharmacies : A DEA network model, European Journal of Operational Research 115 449-458
Maricica, Moscalu., Georgeta, and Vintila., 2012, Business failure risk analysis using fi -nancial ratios, Procedia - Social and Behav-ioral Sciences 62 (2012) 728 – 732
Mazumdar M., and Rajeev, M., 2009, Compar-ing the Efficiency and Productivity of The Indian Pharmaceutical Firms: A Malmquist-Meta-Frontier Approach, International Jour-nal of Business and Economics 8, 159,181 Pannu, H,S., Kumar U, D., and Farooqie, J, A.,
2011, Efficiency and productivity analysis of Indian pharmaceutical industry using data envelopment analysis, Int, J, Operational Research 10, 121,136
Patel, G.N., Pande, and Smriti., 2012, Measur-ing the performance of pharmacy stores us-ing discretionary and non-discretionary vari-ables, Operational Research Society of India Jan-Mar 50 (1):25–41
Ross, Westerfield, and Jordan, 2008, Corporate Finance Fundamentals, eight ed, Mc Graw Hill, New York
Saranga, H., and Phani, B,V., 2008, Determi-nants of Operational Efficiencies in The In -dian Pharmaceutical Industry, International Transactions in Operational Research 16, 109,130
Xu, Xiaoyan, Wang, and Yu., 2009, Financial failure prediction using efficiency as a pre -dictor, Expert Systems with Applications 36 (2009) 366–373