1 INTRODUCTION
Intermediation role of banks in Indonesia continues to increase. Bank's role as a financial intermediary is also improved with accelerated credit growth compared with the growth of third-party funding (TPF) (Bank Indonesia, 2010). The financial sector plays a very significant in triggering the economic growth of a country and a locomotive of real sector growth via capital accumulation and technological innovation (Ingrid, 2006).
Economic growth in 2011 increased to 6.5%, compared to the previous year of 6.1% and is the highest growth rate in the last ten years (Bank Indo-nesia, 2011). Studies that link between the financial sector and economic growth are as follows. Eco-nomic growth affects the development of the bank-ing sector in the long term but the feedback relation-ship that is not found (Ang & Mc Kibbin, 2007) Deepening financial development and rapid econom-ic growth in China have been accompanied by wi-dening income disparity between coastal and inland regions. Levine (1997), stated that the economic ac-tivity and technological innovation will no doubt impact the structure and quality of the banking sys-tem.
One aspect of technology that is growing ra-pidly in Indonesia's banking system is the applica-tion of electronic-based transacapplica-tions. In 1995, Bank Indonesia as the monetary authority has issued a Public User Control Technology Information Sys-tems (TSI) based on SK DIR. No. BI. No. 27/164/KEP/DIR and SE BI. 27/9/UPPB dated March 31, 1995 on the Use of Information Technol-ogy Systems by Bank Indonesia in 1995. Essentially it establishes the principles that need to be
consi-dered in the TSI bank management, whether con-ducted by the bank itself or by another party. In In-donesia, the use of information and communication technologies in the banking industry is relatively more developed than the other sectors (Hermana et.al 2010). Since 2000, Bank Indonesia also intro-duce people to a process for settlement of payment transactions made per transaction and real-time, which is called the Real Time Gross Settlement, known as BI-RTGS. The use of ICT in banking pos-es a high risk, requiring a mechanism or procedure that the application of ICT in banking can be done safely. Regulations issued by Bank Indonesia related to the management or operation of risk management activities of E-banking is the Bank Indonesia Regu-lation No. 9/15/PBI/2007 about the Application of Risk Management in the use of information technol-ogy by the bank. In addition to these regulations, the Indonesian Banking Architecture (API) which con-sists of six pillars, one of the pillars mentioned that API target is to realize the empowerment and protec-tion of banking services.
The purpose of this research is to analyze the role of banking development indicators including tech-nology indicator namely the BI-RTGS, economic growth indicators represented by the industry sector, and economic growth in Indonesia. This study ana-lyzes in detail: (1)How many level of the optimal lag obtained from the VAR models? (2) How are the percentage contribution of the banking indicators represented by assets, loans, funds, technology indi-cators that is BI-RTGS and the industrial sector to economic growth?
Banking and Technology in Indonesia: Contribution to Indonesia
Economy
Henny Medyawati
Faculty of Economics, Gunadarma University, Indonesia
M.Yunanto
Faculty of Economics, Gunadarma University, Indonesia
2 RELATED RESEARCH
Levine, et.al (2000), found a positive relationship between banking development and economic growth, but in this study Levine put more emphasis on the influence of exogenous component of bank-ing varies greatly between countries. The results Kar & Pentecost (2000) showed that the direction of the causal relationship between banking development and economic growth in Turkey is sensitive to the choice of banking indicators are used as a measure of banking development. Levine (1997) stated that the economic activity and technological innovation will no doubt impact the structure and quality of the banking system. The long-run relationship between financial development and economic growth is ex-amined in a multivariate vector auto regression (VAR) framework using 10 sample countries (Luin-tel & Mosahid Khan, 1999).
Using trivariate VAR framework, Abu-Badr & Abu-Qarn (2006) found that there are weak support for a long run relationship between financial devel-opment and economic growth. Amaral & Quintin (2005) find that the effects of changes in those tech-nological parameters on output are markedly larger when financial frictions are present.
The application of BI-RTGS provides shocks, re-sulting in economic growth in Indonesia has de-creased in the first and second quarter. This is caused by the application of BI-RTGS not fully ben-efit for the customer (Medyawati et.al 2010a); (Me-dyawati, & Hermana, 2010); (Medyawati et.al 2010b). Banking development affects economic growth in a span of 10 quarters (Medyawati & Nopi-rin 2009). Data used in the previous study are quar-terly data and does not include control variables and the indicators of economic growth such as agricul-ture and industry. In the next study, the results of re-search Medyawati & Hegarini (2011) showed that the lag obtained from the VAR model that is 2 months shorter. The use of the data in the study is monthly data. Another difference is the variable measured by the BI-RTGS nominal transaction. The limitation of the study by Medyawati & Hegarini one year of data is data in 2011. This study modifies the model used Levine, Loayza & Beck (2000) which is also used by Nasrudin (2004) who studied banking topics linked to economic growth with a re-gional approach.
3 METHODOLOGY
3.1 Data
The data used in this study is secondary data with the period from 2000 to 2011 in the form of monthly data. Sources of data are publications of Bank Indo-nesia (BI) in the form of the IndoIndo-nesian Financial Statistics (IFS) and Statistics of Indonesia (SI,) pub-lication of BPS (Central Bureau of Statistics). The data bank includes deposits, namely, the nominal amount of savings, current accounts, deposits and credit data across banks (commercial banks, rural banks and Islamic banks), the amount of assets of all banks, industrial sector GDP and the rate of GDP per capita at constant 2000 prices. GDP of the indus-trial sector which has not been included in previous
General form of the equations used in this study is to adopt the model used Nasrudin (2004) and Levine, Loayza & Beck (2000) and has been adopted also by Medyawati & Ega Hegarini (2011), Medyawati, et.al (2010a). Primary forms adopted general equation is as follows:
gt= α + β [banking indicators] t+ γ[condition set] t+ εt In this case, g is the growth rate, which is calculated as the magnitude of the growth rate of per capita in-come at constant 2000 prices. Indicators are used to analyze the development of banking in Indonesia re-fers to the standard Directorate of Banking Research and Regulation, Bank Indonesia banking core indi-cator section. This study did not use a linear regres-sion with least squares approach (Ordinary Least Square-OLS), but using the approach of Vector Auto Regression (VAR). The reason for choosing this ap-proach is the consideration of data used in this study is time series data, and the properties of the VAR that support the goals of this research is the analysis through variance decomposition and impulse re-sponse.
response analysis and variance decomposition. VAR
The equation in this study identify by using the for-mula: Kk> = <m-1 (Gujarati, 2003), so the condi-tions obtained over identified because the amount of information held exceeds the number of estimated parameters. Stationary test results of data indicate that there are two variables, which are stationary at the level. The variables are economic growth and in-dustry sector variable. The next process is the differ-ence so that all variables are stationary in the same
degree.
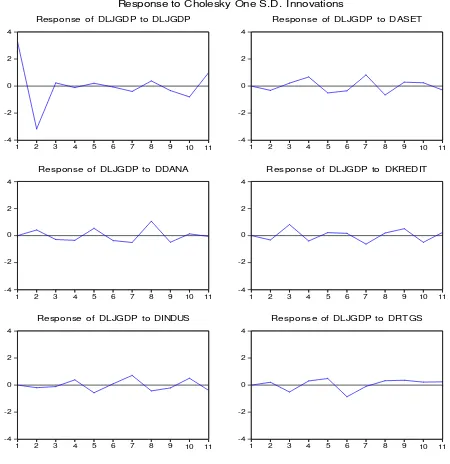
Figure 1. Impulse Response of Economic Growth
These results also simultaneously determine the form of VAR to be estimated later that VAR in dif-ference form. In the VAR method, determination of the optimal level of inertia is importance, it is be-cause the independent variables used nothing but the inertia of the endogen variable.
Based on the results of AR Roots Table, obtained the maximum lag is 11, with a range of modulus values 0.268-0.966. The next process is to determine the optimal lag through Lag length criteria, the result that in accordance with an asterisk, then the candi-date interval is 2. Selection criteria used in this study is based on the smallest AIC value, then obtained the optimal lag 2 (2 months). VAR estimation results in the form of difference will be discussed below.
4.1 Impulse Response Function
Impulse response function of the model confirms the estimated dynamic response of all variables to one standard deviation shock to the variables in the
sys-tem. Based on Figure 1, it can be concluded that the shock of third-party funds and variable BI-RTGS in the first and second received positive responses from economic growth. This means that both variables af-fect economic growth. This result is consistent with the results of Nasrudin (2004) which states that cre-dit variable has negative effect on economic growth. This indicates that the banking disintermediation oc-curs, that the role of banking as a financial interme-diary is not running properly. These results are not in line with the research Levine et.al (2000), Ingrid (2006), Kar & Pentecost (2000), Liang (2006), Me-dyawati, et.al (2010a), MeMe-dyawati, et.al (2010b), Medyawati & Ega Hegarini (2011), and Medyawati & Nopirin (2009) which states that economic growth gives a positive response.
4.2 Variance Decomposition
The variance decomposition analysis illustrates the importance relative of each variable in the VAR sys-tem because of the shock. Table 1 below illustrates the percentage contribution of predicted economic growth variants variables to changes in variable as-sets, loans deposits, BI-RTGS transactions and in-dustry sector.
Table 1. Variance Decomposition of Economic Growth
Period dljgdp Daset Ddana Dkredit Dindus drtgs
The results in Table 1 above provides the informa-tion that the overall economic growth can be ex-plained or influenced by economic growth them-selves, from the first of the month until the eleventh month with the percentage 69% - 97%. The percen-tage value of banking variables namely assets, depo-sits, loans, relatively similar to each other, and in the range of 1% -7%. Variable BI-RTGS and industry
be concluded, that the Bank in lending to the public is still relatively cautious in order to prevent the oc-currence of bad debts.
The third party funds show that the percentage contribution of third-party funds to economic growth achieve highest in the ninth month is equal to 8.01%. On month the tenth experienced a slight a decrease 0.26% compared with percentage previous month. This can be understood that the third party funds which is exist in a bank, has been channeled into so-ciety through channeling mechanism for credit.
In general, the role of BI-RTGS transactions to economic growth when seen from the percentage of variance decomposition, the equivalent of three oth-er banking indicators is between 1% - 5.29%. The most interest phenomenon in this research, that rang-ing from the sixth to the tenth month, the percentage contribution of the BI-RTGS show stability. This describes the condition of the people who have been able to take advantage of BI-RTGS facility for the purposes of day-to-day transactions. The cost of us-ing the BI-RTGS facility is no longer considered ex-pensive by most people, because of the speed and accuracy of transactions provided by this facility. This condition describes the role of BI-RTGS trans-actions positively affect economic growth and strengthen the statement of Levine (1997) that eco-nomic activity and technological innovation give ef-fect to the structure and quality of the banking sys-tem. This result is also in line with the research Medyawati & Budi Hermana (2010) that the imple-mentation of technology affects the development of banking and economic growth. This result also sup-ports the main reason Bank Indonesia to process set-tlement through RTGS is a new awareness of the central banks in the world to manage the Large Val-ue Transfer System (LVTS). The optimal lag length obtained in this study is similar to previous research that is 2 months (Medyawati & Ega Hegarini, 2011). The addition of industry sector in VAR model does not affect the optimal lag.
5 SUMMARY
BI-RTGS has a role and contribute to economic growth. This result is consistent with the statement of Levine (1997), Medyawati & Budi Hermana (2010) and Medyawati & Ega Hegarini (2011). The condition is clarified with data processed through the two properties of VAR, Impulse Response and Va-riance Decomposition, that the positive response oc-curs as a result of economic growth in the shock of BI-RTGS variable. The percentage contribution of the BI-RTGS variables tend to be stable over the last 6 months of prediction is the sixth month, up to the eleventh. This condition reflects that the use of tech-nology in banking has become an important part and is felt by the wider community.
The limitations of this research that the control va-riables not included in the VAR model like API im-plementation in 2004. For further research, the con-trol variables and other economic indicators such as agriculture and services can include into the VAR model.
REFERENCES
Abu-Badr, Suleiman & Abu-Qarn, Aamer S. 2006. Financial Development and Economic Growth Nexus: Time Se-ries Evidence from Middle Eastern and African Coun-tries. Discussion Paper No. 06-09. Monaster Center of Economic Research, Ben-Gurion University the Negev Amaral, Pedro & E. Quintin. 2005. Financial Intermediation
and Economic Development: A Quantitative Assess-ment, Research Paper, Southern Methodist University, University of Texas at Austin
Ang, James B., & Warwick J. McKibbin. 2007. Financial Liberalization, Financial Sector Development and Growth: Evidence From Malaysia. Journal of Development Economics. Vol. 84, 215-233
Bank Indonesia, 2010. Laporan Perekonomian Indonesia Tahun 2010
Bank Indonesia, 2011. Laporan Perekonomian Indonesia Tahun 2011
BPS. 2012. Pertumbuhan Ekonomi Indonesia. Berita Resmi Statistik NO. 14/02/Th. XVI, 5 Februari 2013
Gujarati, Damodar N. 2003. Basic Econometrics. McGraw Hill International Edition
Hermana, Budi. (2010). Pengukuran Kualitas Layanan Internet Banking. Jurnal Ekonomi Bisnis No. 1 Vol. 15 April. Inggrid. 2006. Sektor Keuangan dan Pertumbuhan Ekonomi di
Indonesia: Pendekatan Kausalitas dalam Multivariate
Vector Error Correction Model (VECM). Jurnal
Manajemen dan Kewirausahaan Vol. 8/No. 1/2006 Kar, Muhsin, & Eric J.Pentecost. 2000. Financial
Development and Economic Growth in Turkey: Further Evidence on the Causality Issue. Economic Research Paper No. 0/27 Loughborouh University
Liang, Zhicheng. 2006. Financial Development, Growth, and Regional Disparity in Post-Reform China. Research Paper No. 2006/90
Levine, Ross, et.al. 2000. Financial Intermediation and Growth: Causalities and Causes. Journal of Monetary Economics. Vol. 46. pp. 31-77
Levine. Ross. 1997.Financial Development and Economic Growth: Views and Agenda. Journal of Economic Literature. Vol.XXXV.pp.688-726
Luintel, Kul B. & Mosahid Khan. 1999. A Quantitative Reassessment of The Finance-growth Nexus: Evidence From a Multivariate VAR. Journal of Development Economics Vol. 60 . pp. 381-405
Medyawati, Henny & Ega Hegarini. 2011. Pengaruh Teknologi Perbankan terhadap Pertumbuhan Ekonomi: Tinjauan dari Impulse Response dan VarianceDecomposition. Proceed-ing PESAT National Seminar, October 2011 Gunadarma University
Medyawati, Henny, and Budi Hermana. 2010. Peran BI-RTGS dan Arsitektur Perbankan Indonesia (API) dalam Perkembangan Perbankan dan Pertumbuhan Ekonomi di Indonesia. Jurnal Ekonomi dan Bisnis No. 3 Vol. 15 Desember 2010 pp. 195-202.
Medyawati, Henny, et.al. 2010a. The Role of Banking in Economic Growth in Indonesia. Proceeding of 5th International Conference on Business and Management Research, August 2010, University of Indonesia. Medyawati, Henny, et.al 2010b. Contribution Analysis of
Agricultural Sector, Banking, Technology, Industrial Sec-tor and Services SecSec-tor in Economic Growth in Indonesia: Review from Lags and Variance Decomposition, Proceed-ing of MIICEMA 2010, Selangor, Malaysia
Nasrudin, Rus’an. 2004. Perkembangan Perbankan Indonesia: Analisis Dampak terhadap Pertumbuhan Ekonomi Regional Indonesia dan Penyebab-penyebabnya dengan
Data Panel 1983-1999. Jurnal Ekonomi dan
Pembangunan Indonesia Vol. 4 No. 1 pp. 141-160. Ooms, Marius. 2009. Vector Autoregressive Models. Internet
File.http://www.feweb.vu.nl/econometriclinks/orientatie /EconometricsII20078.pdf ( accesed on 18 Februari 2010)