Mary Janevic University College London
Edlira Gjonça University College London
Martin Hyde University College London
The analysis presented in this chapter shows that:
• Density of accommodation (number of people per room) decreases with
age and is lower for women than for men, suggesting that undercrowding or isolation, rather than overcrowding, may be an issue for women in the oldest age groups.
• Whereas certain durable goods, such as televisions and landline phones,
are almost universally owned by members of today’s older population, men and people in higher occupational classes are more likely than women and those in other occupational classes to own other goods, such as computers and CD players.
• Men and people of higher occupational status are more likely to perceive
good social capital in their communities. Notably, perceived social capital deteriorates with age.
• While, in general, few people report difficulties accessing local amenities,
such as a post office or supermarket, women, older people, those in poor health and those in lower occupational groups are all more likely to have difficulty accessing these services. In contrast, a far greater proportion of individuals indicate that they do not take public transport because of lack of availability.
• Adult children appear to play a central role in the social networks of the
ELSA population, with more than half the sample seeing their children at least once a week.
• The disadvantage experienced by women in such areas as perceived social
capital and access to local amenities is generally not found in measures of personal social networks. For example, women have more face-to-face, phone and written contact with others than men do, and these gender differences in frequency of contact are more pronounced than age differences.
• Younger people and those of higher occupational class are more likely to
have frequent written contact with network members, possibly reflecting disparities in access to email.
• There is some evidence that the quality of social relationships improves
Environmental factors, broadly defined, are critical to understanding the health and well-being of the older population. Such factors include the resources that individuals have in their physical surroundings, their perceptions of the quality of their neighbourhoods and communities, and the nature and extent of their personal social networks. A detailed look at how environmental resources and conditions are distributed according to variables such as gender, age and occupational class is a necessary first step in understanding variations in the health and economic status of population subgroups. Such factors may affect health and economic outcomes directly and, also, indirectly – for example, through their effect on psychological states. This chapter is divided into three sections representing distinct facets of the environments of ELSA respondents: housing conditions, area characteristics and social capital, and social networks and support.
Housing conditions are an important aspect of quality of life. Housing ownership is part of the wealth of the individual or of the individual’s household, and as such has been the focus of research examining the impact of economic factors on health and mortality. Housing ownership, material housing conditions and housing quality have been found to be associated with mortality and health. For example, a number of studies have shown that housing tenure and accommodation size are strongly associated to health and mortality. Smith and Kington (1997) found that house ownership was positively correlated to better functioning ability in old age. Overcrowded accommodation has also been found to be associated with mortality, even at older ages (Fox and Goldblatt, 1982). While overcrowding has to do directly with the space availability and material circumstances, undercrowding may be an issue for older people and may relate to isolation and loneliness. Ownership of durables, such as television set, fridge or washing machine, has also been found, alongside housing tenure and housing quality, to be related to health among older people (Evandrou and Victor, 1989; Arber and Ginn, 1993; Martelin, 1994).
The area in which people live and the amenities to which they have access can have important effects for their health and well-being (Macintyre, Maciver and Sootman, 1993; Lloyd and Auld, 2002; Siegrist, 2002). Local amenities obviously provide a range of crucial functions, such as a General Practice. They also offer opportunities for socialising and meeting people. Going to the shops remains the main way in which people buy food and goods. However, there are differences in the accessibility of different types of shopping outlets. The growth of ‘out-of-town’ shopping malls has created a new way of shopping. Older people who have access to good transport, public or private, can take advantage of these outlets, which are often cheaper than local shops (Midwinter, 1992). In rural areas in particular, many local amenities on which older people might depend are being closed down. In 2000, around 600 rural post offices were expected to close (Guardian, ‘Post office closures at a record high’, 6 November 2000). Many older people rely on the post office for banking and claiming their benefits as well as it being a focus of the community in many rural towns (Guardian, ‘Countryside in crisis: special report’, 14 April 2000).
makers are interested in the ‘social capital’ of areas. Although there are many different definitions of social capital, it is generally taken to mean the sense of community or trust within an area (Lochner, Kawachi and Kennedy, 1999; Harpham, Grant and Thomas, 2002). Older people who live in areas with high social capital are likely to benefit from this increased sense of trust and be more likely to get out and about if they are able.
Finally, relationships with others represent a key resource for older people, and a sizeable body of research suggests that social relationships have a measurable impact on physical and psychological health (House, Landis and Umberson, 1988). Social relationships are important for health and well-being throughout the life course, and may protect against the health declines that often accompany ageing. Two primary aspects of social relationships are of interest: the quantity and extent of social ties (that is, the objective features of one’s social network), and perceptions of the quality or function of these ties (often referred to as ‘social support’). In general, older people who have more social ties and who have more support available to them are in better health than their more isolated counterparts. Exploring the extent to which factors such as gender, age, employment status and socio-economic position influence the size and quality of an individual’s social network may help in the identification of more vulnerable or isolated subgroups in the population. Past research has yielded equivocal findings about the association between such factors and social relationships; ELSA provides the opportunity to explore these links in a large, population-based sample of older people.
8.1 Measures
Details regarding housing and area were collected in the main ELSA interview. Other variables reported on here – that is, those to do with social capital, transport, local amenities and social relationships – were part of the written ELSA (‘self-completion’) questionnaire.
Housing
In terms of housing conditions, ELSA respondents were asked about housing tenure, number of rooms and problems with size, noise and damp. Other housing characteristics, such as form of heating, modifications to the accommodation and the ownership of consumer durables, were covered as well.
Housing tenure was recorded as follows: own it outright, buying with the help of a mortgage or loan, paying part rent and part mortgage (shared ownership), renting, living rent free and, lastly, squatting. Respondents were asked about the number of rooms in the household. This number included bedrooms, but not kitchens, bathrooms or any rooms that they might let or sub-let. The ‘accommodation density indicator’ was calculated by dividing the number of rooms by the total number of people in the household.
accommodation, respondents were asked about: shortage of space; noise from neighbours; other street noise (such as traffic, businesses, factories); too dark, not enough light; pollution, grime or other environmental problems caused by traffic or industry; rising damp in floors and walls; water getting in from roof, gutters or windows; bad condensation problem; problems with electrical wiring or plumbing; general rot and decay; problems with insects, mice or rats; too cold in winter.
Respondents were also asked whether their homes had any of the following special features to assist people who had physical impairments or health problems: widened doorways or hallways; ramps or street-level entrances; handrails; automatic or easy-open doors; accessible parking or drop-off site; bathroom modifications; kitchen modifications; lift, chairlift or stair glide; alerting devices such as button alarms; any other special features; none of these.
Data on ownership of a predetermined list of housing durables were also collected. The list included: television; video recorder; CD player; deep freeze or fridge-freezer (exclude fridge only); washing machine; tumble-dryer or washer-dryer; dishwasher; microwave oven; computer; on-line digital/satellite/ cable television; phone (landline).
Area variables and social capital
Region was assigned from the postcode of the interviewee’s address. The type of area (urban; suburban residential; rural residential or village; rural) where the respondent lives was coded by the interviewers based on National Centre guidelines.
The level of deprivation of the area was measured using the Index of Multiple Deprivation (IMD). IMD scores are created for each area based on six indicators of deprivation: income; employment; health deprivation and disability; education, skills and training; housing; and geographical access to services (www.odpm.gov.uk). These scores were then transformed into quintiles. Social capital was measured using nine questions that were derived from the Local Area Study (Stafford et al., 2001). Respondents were asked questions about how they felt about the area in which they lived, such as whether they thought vandalism and graffiti were a big problem or whether they were lonely in the area, and questions about the people who lived in that area, such as whether they were trustworthy or friendly. These were summed to produce a continuous scale which was then dichotomised at the second tertile to produce a group with poor social capital (in the bottom two tertiles) and a group with good social capital (in the top tertile).
Respondents were asked whether they had any difficulty in accessing a range of local amenities using their usual form of transport. The list included a bank, chiropodist, dentist, GP, hospital, local shops, optician, post office, shopping centre and supermarket.
Social networks and support
The ELSA self-completion questionnaire included a series of detailed items on respondents’ social relationships. The first set consisted of ‘social network’ questions, which addressed the frequency with which the respondent has contact (face to face, phone or written/email) with each of the following: children, other relatives and friends. Response options ranged from multiple times per week to less than once a year / never. The second set consisted of ‘social support’ questions, which were concerned with the quality of the respondent’s social relationships. Specifically, respondents were asked about the closeness of their marital relationship on a scale from ‘very close’=4 to ‘not at all close’=1; about the presence of positive support from their spouse, children, other relatives and friends (how much they understand the way the respondent feels about things, how much they can be relied on if the respondent has a serious problem and how much the respondent can open up to them to talk about worries); and about negative relations with these same people (how much others criticise the respondent, how much they let the respondent down and how much they get on the respondent’s nerves). Positive and negative support items were scored as 1=‘not at all’ and 4=‘a lot’, such that higher numbers indicate more of each type of support. Respondents were also asked to indicate the number of family members and friends with whom they have a close relationship.
8.2 Housing
This section reports on housing tenure, accommodation density and characteristics of accommodation (problems with the accommodation, heating, adaptations made to the accommodation and ownership of durables).
Housing tenure
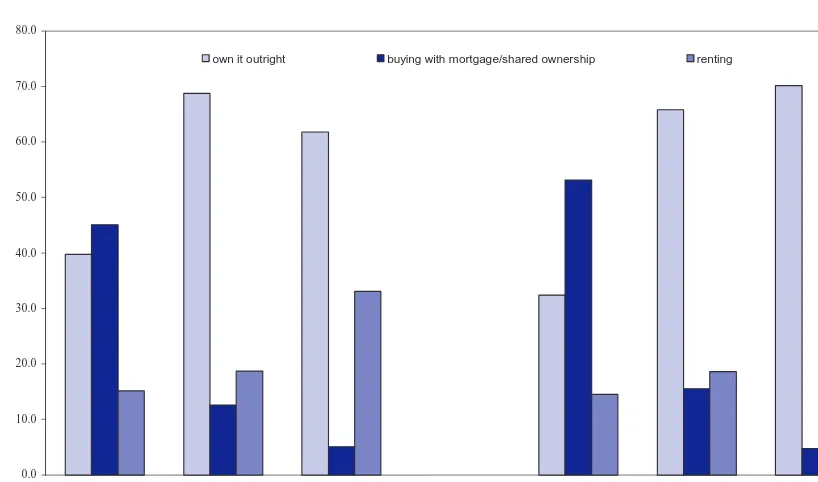
80-and-over group). A relatively small proportion of the ELSA population rent their accommodation. There are more women than men overall who rent (21.0% versus 18.1%); however, this varies with age group. (Table 8A.1, Figure 8.1)
Figure 8.1. Housing tenure, by age and sex
0.0 10.0 20.0 30.0 40.0 50.0 60.0 70.0 80.0
50-59 60-74 75+ 50-59 60-74 75+
Women Men
own it outright buying with mortgage/shared ownership renting
In order to gain further insight into the reasons why there are age and gender differences in tenure, the analysis has been performed also by marital status (single; married; divorced or separated; widowed) and by economic activity (working; retired; non-active or other).
Single women are more likely than single men to own their accommodation outright in all age groups, although by the oldest group, the difference is small (49.5% versus 51.2%). (Table 8A.9)
Housing tenure is clearly related to economic activity. Working men aged 50– 59 are more likely to be buying with the help of a mortgage or loan than working women of the same age (60.5% versus 53.3%). The opposite can be said for the ‘owning outright’ category, where the percentage for working men is 30.7% and that for working women is 36.8%. Similarly, a higher percentage of retired women own their accommodation outright (68.5% of retired women versus 62.9% of retired men), while a higher percentage of retired men than retired women are still buying with the help of a mortgage. However, as expected, the pattern is different for people aged 75 or over. Here, the percentage of retired women who own their accommodation outright is smaller than that of men (70.5% for men versus 58.6% for women). More interestingly, the percentage of retired women who are renting their accommodation is 11.2 percentage points higher than that of men. These results could be showing a cohort effect. As Chapter 2 showed, there are slightly more non-married women than non-married men in the older cohorts and it is likely that they had less chance to inherit property. These results might also reflect gender differences in ageing and social care – ill men remain at home, cared for by spouse or children, while women move into sheltered accommodation and have to sell their homes. (Table 8A.10)
Accommodation density
A more detailed description of the living arrangements of the ELSA population is given in Chapter 2. Most respondents live in a household of one or two people. A quarter of the ELSA population live alone, while 59% live in a two-person household, 11.5% live in a three-person household and 6% live in a four- or five-person household. A very small number of people live in households with more than five people.
Women in general are more likely to live in a single-person household than men (difference of over 12 percentage points). These figures are very distinct if one looks at the analysis by age, when it becomes apparent that this is a consequence of older women being more likely to live alone. While 32.5% of men aged 75 or over live alone, the proportion of women in the same age group living alone is 59.5%. This can mainly be explained by the fact that women are more likely to survive at old ages than men. As Chapter 2 showed, most women living alone at old age are widowed.
explained by widowhood – the fact that women tend to survive longer than men. (Table 8A.3)
The results by marital status show clearly that more widows live in accommodation with more than three rooms per person than widowers in the same age categories. For example the proportion of widows aged 60–74 living in accommodation with more than three rooms per person is 53.3%, while the proportion of widowers of the same age group living in the same-density accommodation is 50.2%. This could possibly be explained by the fact that, while older widows might live alone, older widowers are more likely to move in with someone. (Table 8A.11)
Characteristics of accommodation
The number of people reporting problems with their accommodation is generally very small and varies only slightly by age. The most common problems that people report are shortage of space, noise from neighbours and noise from the street. Generally, younger people report more problems than older people. For example, 22.1% of men and 25.1% of women aged 50–54 report problems with noise from neighbours, while amongst people aged 80 or over, 11.7% of men and 19.5% of women report such problems. (Table 8A.4) Almost 93% of respondents’ households have central heating, with slight age and gender variations in the prevalence of this type of heating. Older people and men in general are slightly less likely to report having central heating in their accommodation. (Table 8A.5)
Regarding adaptations made to the accommodation, the most popular adaptation was reported to be handrails, followed by adaptations to the bathroom. 59.3% of men and 58.3% of women report having handrails installed in their accommodation, while 45.4% of men and 48.7% of women report having adaptations made to their bathrooms. The results of the analyses by age and gender show that people in older age groups tend to have more adaptations to their accommodation. Taking the example of handrails, 44.3% of men and 40.8% of women aged 50–54 report having handrails installed in their accommodation, compared with 62.6% of men and 60.5% of women aged 80 or over. This is likely to reflect the decrease in physical ability as people grow older. There are also small gender differences in the adaptations made to accommodation. In general, the proportion of men who report adaptations having been made to their accommodation is higher for most age groups and for most types of adaptations. (Table 8A.7)
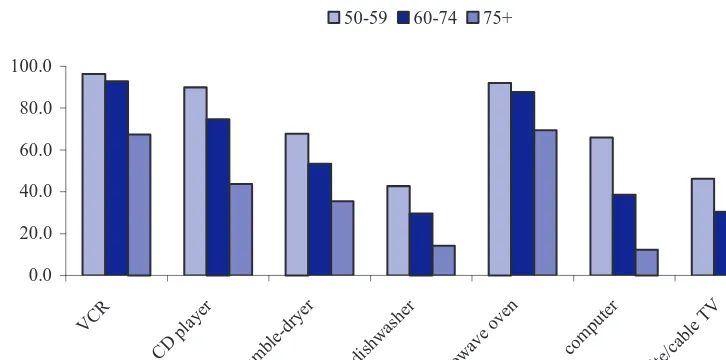
the same age is 6.0%. The differences by age are more pronounced than those by gender, with older people owning fewer durables than younger ones. For example, while 97.1% of men and 97.0% of women aged 50–54 own a video recorder, the proportions of people aged 80 or over who have a video recorder are 66.6% for men and 50.6% for women. (Table 8A.8, Figure 8.2)
Figure 8.2. Durable ownership, by age
0.0
A similar pattern is found if ownership is compared across NS-SEC occupational category (managerial and professional occupations; intermediate occupations; routine and manual occupations). For commonly owned durables, such as television sets or washing machines, there is almost no difference by occupation. However, when looking at computer ownership, there are large differences by occupational category. The proportions of people who own a computer, for example, are highest for people in managerial and professional occupations (67.9% for men and 60.5% for women) and lowest for people in routine and manual occupations (31.7% for men and 26.3% for women). (Table 8A.13)
8.3 Area variables and social capital
Region and area
Although there are no clear patterns of regional variation amongst those aged over 50 living in England, there are some general trends that are worth noting. The North East had the lowest percentages of both men and women in all age groups, and the South East had the highest percentages. For both sexes, there is a slight tendency for higher percentages of those in the older age groups to live in the South East. (Table 8A.14)
(20.3%). Yet men in the intermediate occupations are a little more geographically dispersed. About equal percentages live in the North West (15.3%) and the South East (15.8%) The North West has the highest concentration of both men and women from the routine and manual occupations, (14.9% for both sexes). (Table 8A.15)
Almost equal percentages of men (24.6%) and women (24.2%) live in areas in the most deprived quintile of area deprivation. However, there is little variation between the different age groups for either sex. (Table 8A.16)
Social capital
Overall, higher rates of men (37.1%) than women (26.7%) report having good social capital. For both men and women, there is a clear age-related gradient in social capital, with those in the younger age groups having the higher rates of social capital. 45.6% of men aged between 50 and 54 report good social capital, compared with 24.0% of men aged over 80. 35.8% of women aged between 50 and 54 report good social capital, compared with 16.7% of those aged over 80. (Table 8A.17)
For both men and women, there is an occupational class gradient in the proportions that report good social capital. This is slighter for women than it is for men. 48.3% of men in the professional and managerial occupations report good social capital, compared with 28.1% in the routine and manual occupations. 35.8% of women in the professional and managerial occupations report good social capital, compared with 20.9% in the routine and manual occupations. (Table 8A.18)
Public transport
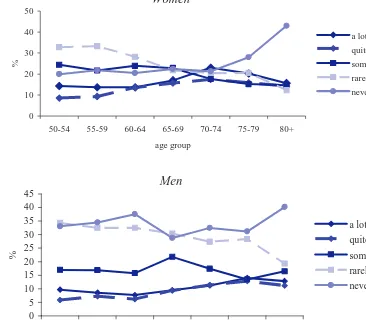
In general, those aged over 50 in England do not tend to use public transport, or if they do, they only use it rarely. A third of men and a quarter of women say that they never use public transport, whilst 30.4% of men and 25.1% of women say that they only rarely use it. For both men and women, those in the older age groups are more likely to say that they never use public transport than those in the younger age groups. 33.1% of men and 20.0% of women aged 50–54 say that they never take public transport, compared with 40.2% of men and 43.0% of women aged over 80. However, those in the older age groups are also more likely to use public transport a lot. 23.0% of women aged between 70 and 74 say they use public transport a lot, compared with 14.3% of women aged between 50 and 54. (Table 8A.19, Figure 8.3)
Figure 8.3. Frequency of using public transport, by age and sex
50-54 55-59 60-64 65-69 70-74 75-79 80+
age group
50-54 55-59 60-64 65-69 70-74 75-79 80+
age group
Although, overall, few people report difficulty in accessing their local amenities, there are obvious age and sex differences. In general, those in the older age groups report greater difficulty in accessing local amenities. This becomes especially so amongst those aged over 80, who report the greatest rates of difficulty. 27.1% of men and 35.2% of women aged over 80 have difficulty in getting to a hospital, compared with 4.4% of men and 7.4% of women aged between 50 and 54. For all amenities, women, overall, report greater rates of difficulty of access than men. (Table 8A.21)
For both sexes and for all age groups, those in the lower occupational groups have higher rates of reporting difficulties in accessing their local amenities. There is a clear gradient for most amenities, so that those in the professional and managerial occupations have the lowest percentages reporting difficulty in accessing amenities, those in the intermediate occupations have the second lowest and those in the routine and manual occupations with the highest rates. For example, amongst women, 5.3% of those in the professional and managerial occupations have difficulty getting to a dentist, compared with 7.1% in the intermediate group and 9.9% in the routine and manual occupations. (Table 8A.23)
8.4 Social networks and support
This section focuses on the quantity and quality of ELSA respondents’ social ties, as reported in the self-completion questionnaire.
Frequency of contact with social networks
ELSA respondents, especially women, report frequent contact with their children: across age groups, more than half of all respondents see their children at least once a week and more than 80% of men and more than 90% of women speak on the phone with their children this often. Fewer than 10% of men and women meet or speak on the phone with their children as infrequently as only once or twice a year or less frequently. (Table 8A.25) Friends also appear to be an important part of ELSA respondents’ networks: for both men and women, and across age groups, more than half of respondents report meeting up with friends at least once a week, though again the proportion of respondents falling into this category is higher for women (61.5% overall) than for men (56.9% overall). (Table 8A.26)
Compared with children and friends, other family members are seen less frequently, but there is still frequent phone contact with this group. For example, 60.5% of women and 44.5% of men in the sample as a whole have phone contact with relatives at least once a week. (Table 8A.27)
In general, gender differences in frequency of contact with social networks, with women having more contact of all modes with their children, other relatives and friends, are more pronounced than age differences. However, there is a clear pattern whereby written contact (letter or email) with network members decreases with age, possibly due to the greater likelihood of younger individuals communicating by email.
again possibly reflecting greater access to email, perhaps through one’s employer. (Tables 8A.28–8A.30)
There are several interesting variations in frequent social contact (that is, at least once a week) by NS-SEC occupational category. For example, in the sample as a whole, the proportion of individuals having face-to-face contact at least once a week with children and other relatives increases with decreasing occupational class. This is true for both men and women. These findings may be due, in part, to a greater tendency for people of higher occupational status to migrate away from family and friends. However, phone contact with network members appears to be less strongly related to occupational classification and a consistent pattern cannot be found. Frequency of written contact (letter or email) with children, friends and other relatives is highest among those with managerial and professional occupations. This may be because individuals with higher occupational status are more likely to use email or to be more geographically distant from children, friends and other relatives. (Tables 8A.31–8A.33)
Number of close ties
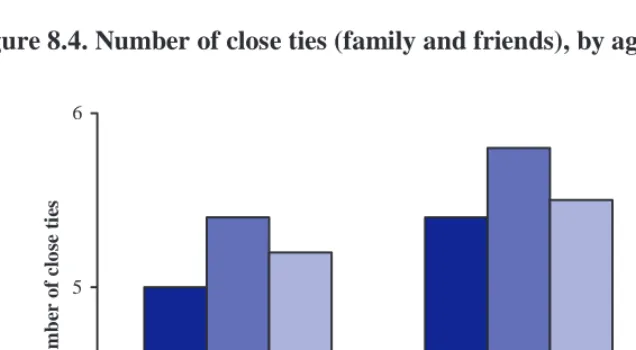
The total number of friends and other relatives (not counting children or spouses) that ELSA respondents report feeling close to peaks in the 60–74 age group for both sexes, though, notably, this number is higher in the 75-and-older age group for both sexes than it is in the 50–59 group. Across age groups, men report an average of 5.2 close relationships with friends and other relatives and women 5.5. (Table 8A.34, Figure 8.4)
Figure 8.4. Number of close ties (family and friends), by age and sex
4 5 6
men women
num
be
r o
f cl
o
se
t
ie
s
50-59
60-74
75+
Positive and negative social support
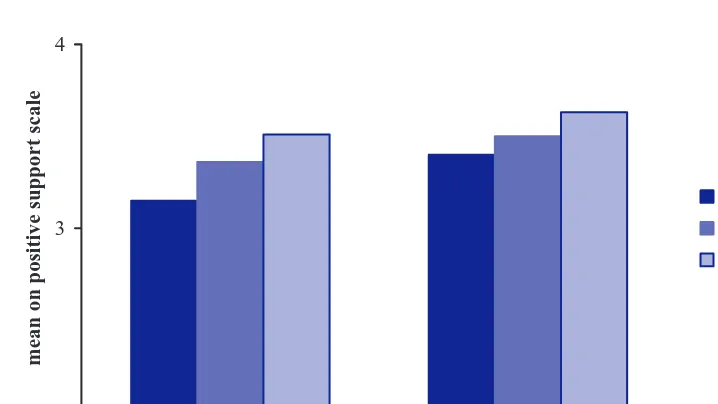
Men across age groups report feeling closer to their spouse/partner than do women. In addition, there appears to be a slight increase with age in feelings of closeness to spouse for both men and women. Across age groups, men report more positive support from their spouse than women do, while women report more positive support from children, other relatives and friends than do men. Positive support from children and other relatives appears to increase linearly with age for both sexes. For women, positive support from friends decreases linearly with age. Women report more negative support from their spouse. Negative support from every kind of relationship – with spouse, children, other family and friends – decreases with advancing age, for both genders. These age differences suggest that people tend to view their relationships more positively as they get older, that older birth cohorts view their relationships more positively and/or that there is an actual – and positive – difference in how network members relate to an older person as he or she ages (Tables 8A.35–8A.38, Figure 8.5)
Figure 8.5. Positive support from children, by age and sex
2 3 4
men women
m
ean
o
n
p
o
si
ti
v
e suppo
rt
sc
a
le
50-59
60-74
75+
Employment status was examined in relationship to overall measures of positive and negative support, summed across relationships. In the 50–59 age group, economically active men and women tended to report more positive support and less negative support than their non-working counterparts. This pattern is not evident in the 60–74 group, and indeed working men and women of this age report more negative support than their economically inactive counterparts. (Table 8A.39)
8.5 Conclusion
Researchers and policy-makers are becoming increasingly aware that one’s environment – that is, one’s home, neighbourhood and community, as well as the network of people one interacts with – can have important effects on health and well-being. Government-funded neighbourhood renewal projects are one example of policy recognition of the critical role played by the quality of one’s surroundings. As people age, they may become less mobile and therefore may depend to an even greater extent than younger people on what their local environment and personal social networks have to offer. The age-related patterns found in this chapter – for example, that each successive age group reports worse social capital – are thus of special interest, though only future waves of ELSA data can permit age-related effects to be disentangled from cohort ones.
The intersection of gender and age is a recurrent theme throughout sections of this chapter, with many of the analyses pointing to a potentially vulnerable position of women in the oldest groups. Such women have the lowest ‘accommodation density’, suggesting that they may be more prone to isolation than any other group. Women overall are less likely than men to have ease of access to local amenities, and there is an interaction between age and sex in the dramatically increasing rates of people in their 80s who cannot get to many local amenities. Women of all ages report worse social capital than men, and the highest prevalence of poor social capital in the older population is found among women over 80. Women are also less likely to have adaptations to their accommodation, in spite of having higher rates of disability (see Chapter 7). In contrast, women appear to have stronger personal relationships than men in terms of number of close ties, frequency of social contact and perceived support from family and friends. Future work with ELSA data may help determine the extent to which these richer personal resources help to offset some of the disadvantage experienced by older women in interacting with their local environments. Future waves of ELSA data will also reveal whether gender differences in social relations are cohort-driven – that is, whether evolving gender norms over time (such as less strictly defined roles at work and at home) help to reduce these differences.
these have been noted above. Others include such questions as whether decreases in housing density are associated with increased perceptions of loneliness, and whether gender and class differences in ownership of a computer – which is assuming a central role in communication and access to information – will diminish over time.
References
Arber, S. and Ginn, J. (1993), ‘Gender and inequalities in health in later life’, Social Science and Medicine, 36: 33–46.
Evandrou, M. and Victor, C.R. (1989), ‘Differentiation in later life: social class and housing tenure cleavages’, in B. Bytheway (ed.), Becoming and Being Old, London: Sage.
Fox, A.J. and Goldblatt, P.O. (1982), Longitudinal Study: Socio-Demographic Mortality Differentials, London: HMSO.
Harpham, T., Grant, E. and Thomas, E. (2002), ‘Measuring social capital within health surveys: key issues’, Health Policy and Planning, 17: 106–11.
House, J.S., Landis, K.R. and Umberson, D. (1988), ‘Social relationships and health’, Science, 241: 540–5.
Lloyd, K.M. and Auld, C.J. (2002), ‘The role of leisure in determining quality of life: issues of content and measurement’, Social Indicators Research, 57: 43–71.
Lochner, K., Kawachi, I. and Kennedy, B.P. (1999), ‘Social capital: a guide to its measurement’, Health and Place, 5: 259–70.
Macintyre, S., Maciver, S. and Sootman, V. (1993), ‘Area, class and health: should we be focusing on places or people?’, Social Policy, 22: 213–34.
Martelin, T. (1994), ‘Mortality by indicators of socioeconomic status among the Finnish elderly’, Social Science and Medicine, 38: 1257–78.
Midwinter, E. (1992), Leisure: New Opportunities in the Third Age, London: Carnegie Inquiry into the Third Age.
Smith, J.P. and Kington, R. (1997), ‘Demographic and economic correlates of health in old age’, Demography, 34:159–70.
Siegrist, J. (2002), ‘Place, social exchange and health: proposed sociological framework’, Social Science and Medicine, 51: 1283–93.