Analisis Sistem Pengukuran pada Interpretasi Visual
Inspeksi Hasil Pengelasan Menggunakan Attribut Agreement
Analysis di PT. Alstom Power ESI Surabaya
Oleh :
Nor Imanda
1309 100 055
BAB I
LATAR BELAKANG
Proses Produksi
D ef ect Pr od uctInspeksi oleh inspektor
Quality control
G ood P rod uc tHigh Cost
Production
Measurement
System Analysis
Attribut
Agreement
Analysis
Penelitian Sebelumnya
Farkhad Kooshan (2012)
MSA pada produksi ring piston, analisis Gage R&R
kemampuan alat ukur ring piston dapat diterima,
Attribut Agreement Analysis kemampuan inspektor
membedakan jenis cacat sudah cukup tingggi
Orzan & Buzatu (2012)
Membandingkan hasil pengukuran dua alat yang memiliki
fungsi sama yaitu caliper dan 3D measuring machine. Caliper
memiliki Gage R&R lebih baik dari 3D measuring machine
PERMASALAHAN
1.
Bagaimana kapabilitas proses inspeksi visual yang
dilakukan oleh inspektor QC sebelum dan setelah pelatihan
interpretasi inspeksi visual hasil pengelasan?
2.
Bagaimana konsistensi inspektor QC dalam
menginterpretasikan visual inspeksi pada hasil pengelasan
sebelum dan setelah pelatihan interpretasi visual inspeksi
pengelasan?
3.
Faktor apa saja yang menyebabkan rendahnya
konsistensi inspektor QC dalam menginterpretasikan
visual inspeksi hasil pengelasan?
Tujuan
1.
Mengetahui kapabilitas proses inspeksi visual yang dilakukan
oleh inspektor QC sebelum dan setelah pelatihan interpretasi
inspeksi visual hasil pengelasan.
2.
Mengetahui konsistensi inspektor QC dalam
menginterpretasikan visual inspeksi pada hasil pengelasan
sebelum dan setelah pelatihan interpretasi visual inspeksi
pengelasan.
3.
Mengetahui faktor apa saja yang menyebabkan kurangnya
kemampuan inspektor QC dalam melakukan inspeksi visual
Manfaat
1. Perusahaan dapat mengetahui bagaimanakah
kemampuan inspektor dari Departemen Quality
Control
dalam menilai secara visual hasil dari
pengelasan
2. Perusahaan dapat meyakinkan konsumen bahwa
produk-produk yang dihasilkan dapat dipercaya
ketepatannya karena inspektor
Quality Control
telah
diuji melalui tahap
Attribut Agreement Analysis
Batasan Masalah
Analisis terhadap konsistensi dan kemampuan
inspektor
Quality Control
hanya sebatas pada
kemampuan inspektor dalam menilai hasil
pengelasan, apakah sudah konsisten benar atau
belum dalam menilai bahwa produk diterima atau
ditolak, serta dapat membedakan jenis cacat yang
ada.
BAB II
Diagram Kontrol Atribut
Diagram kontrol merupakan salah satu alat statistik yang
berfungsi untuk memonitor suatu proses produksi
Apabila dalam suatu proses produksi karakteristik kualitas
tidak dapat diukur tetapi dapat dikategorikan ke dalam
produk cacat atau tidak cacat maka diagram kontrol yang
digunakan untuk memonitoring proses tersebut ialah
diagram kontrol atribut (Montgomery, 1998)
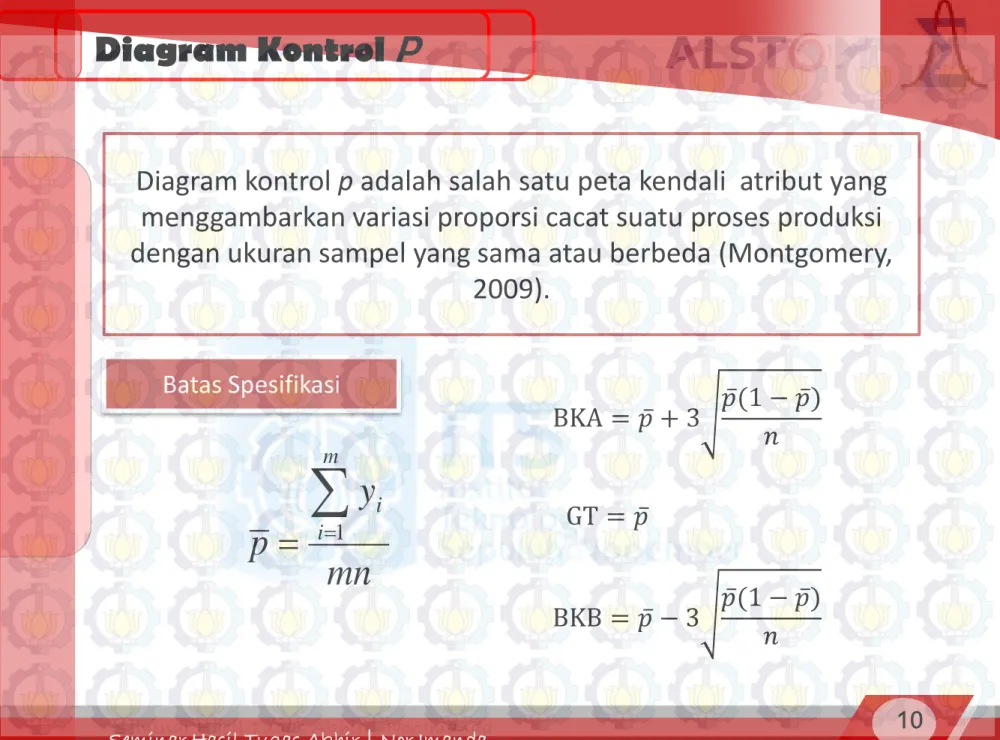
Diagram Kontrol
P
Diagram kontrol p adalah salah satu peta kendali atribut yang
menggambarkan variasi proporsi cacat suatu proses produksi
dengan ukuran sampel yang sama atau berbeda (Montgomery,
2009).
Batas Spesifikasi
BKA = 𝑝̅ + 3
𝑝̅(1 − 𝑝̅)
𝑛
BKB = 𝑝̅ − 3
𝑝̅(1 − 𝑝̅)
𝑛
GT = 𝑝̅
mn
y
p
m i i∑
==
1Kapabilitas Proses
Parameter
Menganalisa kapabilitas proses
untuk mengetahui tingkat
presisi dan akurasi proses
produksi. Akurasi menunjukkan
kedekatan antara nilai prediksi
dengan nilai aktual. Presisi
menunjukkan seberapa besar
nilai prediksi satu sama lain.
Parameter
𝑝
𝑝𝑝%=
𝑍(𝑝̅)
3
𝑝
𝑝%=
𝑍(𝑝̅ ÷ 2)
3
ppm
Total= 𝑝̅x10
6Measurement System
Measurement System
Variabel
Attribute
Caliper
X-Meter
Ruler
Go-Nogo
Gages
Visual
Inspection
Measurement System Error
Ketepatan
Attribute Agreement Analysis
Atribute agreement analysis merupakan suatu sistem pengukuran
dimana nilai pengukurannya adalah berupa data dengan skala
nominal ataupun ordinal (Montgomery, 2009)
Digunakan jika,
terdapat perbedaan keputusan antara inspektor yang satu dengan
yang lain terhadap hasil pengukuran, dan juga inspektor yang sama
sulit untuk membedakan hasil pengukuran yang dilakukan secara
berulang-ulang pada part yang sama
Struktur Data
Subgru p (i) Sampel (j) Inspektor 1 ⋯ Inspektor (l) Trial 1 Trial 2 ⋯ Trial k ⋯ Trial 1 Trial 2 ⋯ Trial k 1 1 x1111 x1121 ⋯ x11k1 ⋯ x111l x112l ⋯ x11kl ⋮ ⋮ ⋮ ⋮ ⋮ ⋮ ⋮ ⋮ ⋮ ⋮ j x1j11 x1j21 ⋯ x1jk1 ⋯ x1j1l x1j2l ⋯ x1jkl ⋮ ⋮ ⋮ ⋮ ⋮ ⋮ ⋮ ⋮ ⋮ ⋮ n x1n11 x1n21 ⋯ x1nk1 ⋯ x1n1l x1n2l ⋯ x1nkl ⋮ ⋮ ⋮ ⋮ ⋮ ⋮ ⋮ ⋮ ⋮ ⋮ ⋮ i1 xi111 xi121 ⋯ xi1k1 ⋯ xi11l xi12l ⋯ xi1kl
⋮ ⋮ ⋮ ⋮ ⋮ ⋮ ⋮ ⋮ ⋮ ⋮
j xij11 xij21 ⋯ xijk1 ⋯ xij1l xij2l ⋯ xijkl
⋮ ⋮ ⋮ ⋮ ⋮ ⋮ ⋮ ⋮ ⋮ ⋮
Kappa-Statistic k : Measurement of Agreement
Kappa Statistik (k) merupakan suatu koefisien yang digunakan
untuk mengevaluasi kesesuaian diantara beberapa penilaian
Fleiss’kappa digunakan ketika beberapa penilai (appraisers)
melakukan penilaian terhadap data kategoris ke dalam sejumlah
keputusan.
Asumsi yang harus dipenuhi ialah penilaian harus benar-benar
dilakukan secara acak
Suatu penilaian terhadap kesepakatan dapat diimplementasikan ketika
terdapat beberapa kategori penilaian pada sejumlah item, maka kappa akan
memberikan ukuran yang menunjukkan seberapa konsisten kategori
penilaian tersebut berada
Kappa Statistic
𝑝̅ =
1
𝑛 � 𝑃𝑃
𝑛 𝑖=1=
𝑛𝑛 𝑛 − 1 (� � 𝑛
𝑃
𝑖𝑖2 𝑝 𝑖=1 𝑛 𝑖=1− 𝑛𝑛)
𝑝̅
𝑒= � 𝑝
𝑖2 𝑝 𝑖=1𝑲 =
𝒑� − 𝒑�
𝟏 − 𝒑�
𝒆 𝒆𝑃
𝑖=
𝑛𝑛 � 𝑥
1
𝑖𝑖 𝑛 𝑖=1𝐾
𝑖= 1 −
𝑛𝑛(𝑛 − 1)𝑃
∑
𝑛𝑖=1𝑥
𝑖𝑖(𝑛 − 𝑥
(1 − 𝑃
𝑖𝑖)
)
K individu :
xij : jumlah penilaian pada sampel i (i = 1,2, ..., n) j : kategori (j = 1,2, .., k)
Klasifikasi Kappa
Kappa
Agreement
< 0
Tidak ada kesesuaian0.00-0.20
Konsistensi Rendah0.21-0.40
Konsistensi Sedang0.41-0.60
Konsistensi Cukup0.61-0.80
Konsistensi Baik0.81-1.00
Konsistensi SempurnaKlasifikasi dari kappa-statistic ditunjukkan oleh Landis &
Koch (1977) (Landis & Koch, 1977)
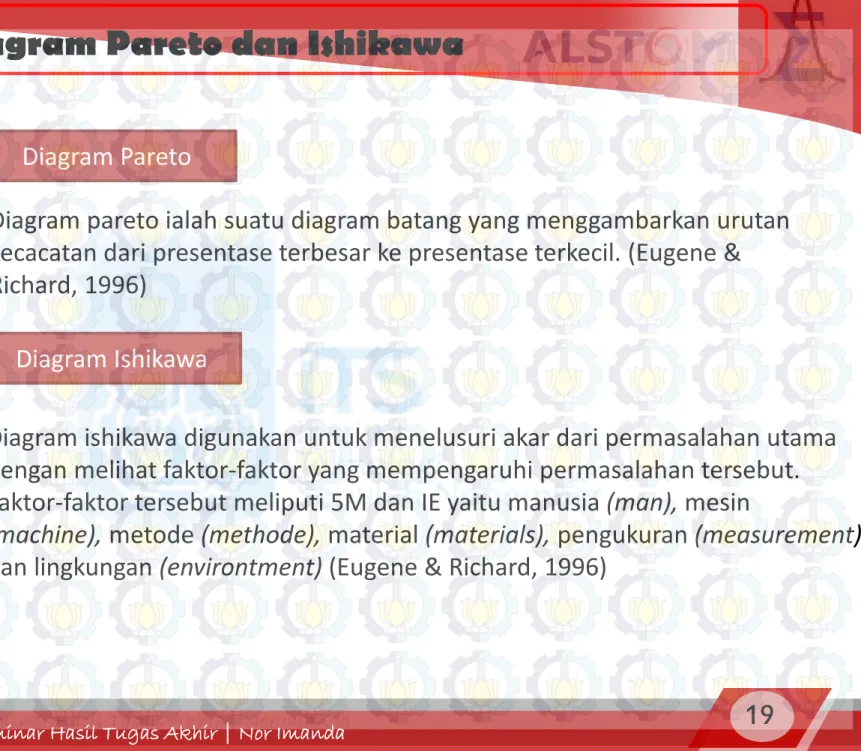
Diagram Pareto dan Ishikawa
Diagram Pareto
Diagram pareto ialah suatu diagram batang yang menggambarkan urutan
kecacatan dari presentase terbesar ke presentase terkecil. (Eugene &
Richard, 1996)
Diagram Ishikawa
Diagram ishikawa digunakan untuk menelusuri akar dari permasalahan utama
dengan melihat faktor-faktor yang mempengaruhi permasalahan tersebut.
Faktor-faktor tersebut meliputi 5M dan IE yaitu manusia (man), mesin
(machine), metode (methode), material (materials), pengukuran (measurement)
Visual Inspeksi Hasil Pengelasan
Visual Inspeksi Hasil Pengelasan adalah menginterpretasi hasil
pengelasan sesuai standar penerimaan (QCP, 2012).
Standar Penerimaan : ASME Section 1
Quality Control Procedure (QCP) : salah satu prosedur resmi
mencangkup prosedur inspeksi visual pengelasan untuk
mendapatkan hasil pengelasan yang dapat diterima dengan
parameter-parameter yang telah ditentukan
DISKONTINUITAS
merupakan suatu ketidaksesuaian
dalam pengelasan yang belum tentu
dibandingkan jika dengan standart
tergolong cacat.
BAB III
Sumber Data
Sumber Data
Data primer yang diambil secara harian pada tanggal 13 Februari 2013 – 5 April 2013
Unit Pengukuran
i = banyaknya specimen (subgrup) hasil pengelasan yang akan diukur yaitu 5 specimen. j = banyaknya sampel (kriteria inspeksi) hasil pengelasan pada setiap specimen (subgrup). l = banyaknya inspektor yang melakukan pengukuran
k = banyaknya pengulangan untuk setiap pengukuran pada masing-masing specimen (subgrup)
3 Inspectors 3 Times 5 Samples 3 Inspectors 2 Times 5 Samples
Sumber Data
Specimen
Part 2 Tube dengan Dimensi OD 50 mm, ID 35mm, dan Length 270mm
Part 1 Nozzle Part 3 Plate
Part 4 Tube dengan Dimensi OD 50 mm, ID 35mm, dan Length 230mm
Part 5 Tube dengan Dimensi OD 50 mm, ID 35mm, dan Length 270mm
Variabel Penelitian
1. Kriteria Kelengkapan Hasil Inspeksi
No Report Completeness 1 Report No 2 Test Ident 3 WPS No 4 Welder No 5 Welding Position 6 Type of Weld 7 Dimension 8 Application standard 9 Acceptance Criteria
10 Examination Device used
11 Initial Prepared/ inspected by
12 Sign in 13 Date
2. Kriteria Keputusan
No Accept/Reject 1 Out side 2 InsideVariabel Penelitian
3. Kriteria Hasil Interpretasi (Diskontinuitas)
No Observation Result 1 Number Indication 2 Type of Indication - 1 3 Location of Indication - 1 4 Size of Indication - 1 5 Type of Indication - 2 6 Location of Indication - 2 7 Size of Indication - 2 8 Type of Indication - 3 9 Location of Indication - 3 10 Size of Indication - 3 11 Type of Indication - 4 12 Location of Indication - 4 13 Size of Indication - 4 14 Type of Indication - 5 15 Location of Indication - 5 No Observation Result 18 Location of Indication - 6 19 Size of Indication - 6 20 Type of Indication - 7 21 Location of Indication - 7 22 Size of Indication - 7 23 Type of Indication - 8 24 Location of Indication - 8 25 Size of Indication - 8
26 Size of Fillet weld
27 Size of Fillet weld
28 Size of Fillet weld
29 Size of Fillet weld
30 Size of reinforcement weld ( 0 - 90 )
31 Size of reinforcement weld ( 90 - 180 )
Langkah Analisis
Perumusan Masalah dan Tujuan Penelitian
Identifikasi Variabel dan Pengumpulan Data
Analisis Data :
a. Pengontrolan kualitas dengan menggunakan diagram kontrol p dan perhitungan kapabilitas untuk data atribut.
b. Attribute agreement analysis
Hasil pengontrolan kualitas Attribute agreement analysis Tahap I(kappa value < 80%) inspeksi ulang dengan sosialisasi dan persamaan persepsi mengenai jenis-jenis cacat pada hasil pengelsan. Pengontrolan kualitas dan Attribute agreement analysis tahap II
Kriteria Penerimaan Attribute Agreement
Analysis
% Match Within Appraiser
% Match Each Appraiser to Standard
% Match Between appraiser
% Match All Appraiser to Standard
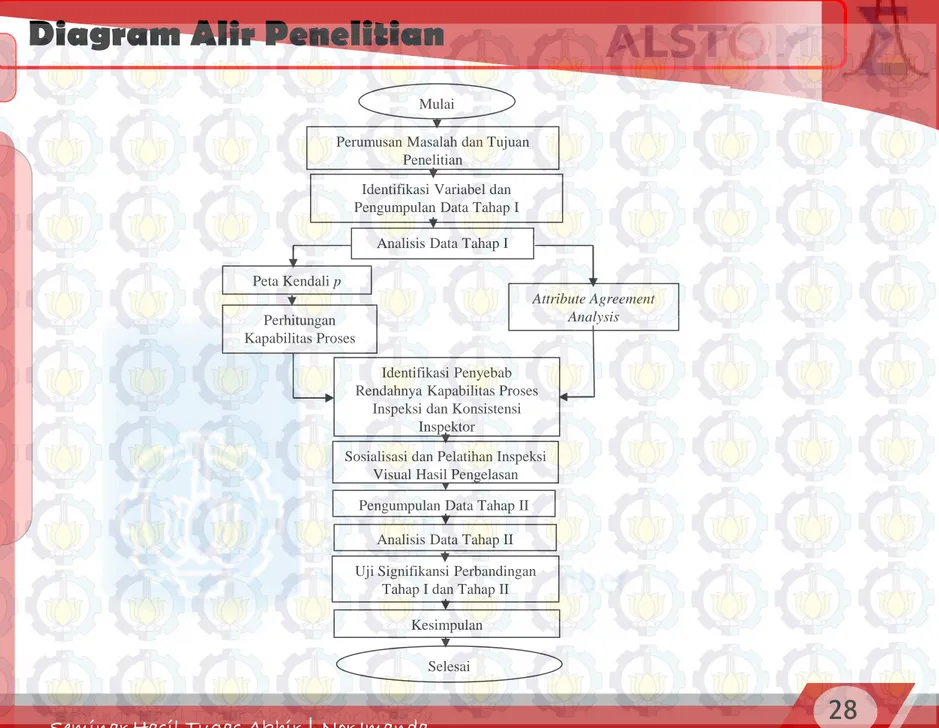
Diagram Alir Penelitian
Peta Kendali p
Attribute Agreement Analysis
Identifikasi Penyebab Rendahnya Kapabilitas Proses
Inspeksi dan Konsistensi Inspektor
Pengumpulan Data Tahap II
Kesimpulan Perumusan Masalah dan Tujuan
Penelitian Identifikasi Variabel dan Pengumpulan Data Tahap I
Analisis Data Tahap I Mulai
Perhitungan Kapabilitas Proses
Sosialisasi dan Pelatihan Inspeksi Visual Hasil Pengelasan
Analisis Data Tahap II Uji Signifikansi Perbandingan
BAB IV
1. ANALISIS KAPABILITAS PROSES
a. Variabel Kelengkapan
61 55 49 43 37 31 25 19 13 7 1 1,0 0,8 0,6 0,4 0,2 0,0 Sample Pr op or ti on _ P=0,631 UCL=1 LCL=0 61 55 49 43 37 31 25 19 13 7 1 1,0 0,8 0,6 0,4 0,2 0,0 Sample Pr op or ti on _ P=0,364 UCL=1 LCL=0 1 7 13 19 25 31 37 43 49 55 61 1,0 0,8 0,6 0,4 0,2 0,0 Sample Pr op or ti on _ P=0,246 UCL=0,992 LCL=0 1 1 1 1 1 1 1 1 1 1 1 1 1 1 1 1Inspektor 1 Inspektor 2 Inspektor 3
ppm
Total631000
364000
-
𝐏
𝐩𝐩
%
0,112
0,116
-
𝐏
𝐩
%
0,160
0,303
-
Inspektor 1 Inspektor 2 Inspektor 3OUT Of Control
1. ANALISIS KAPABILITAS PROSES
b. Variabel Keputusan
Inspektor 2
ppm
Total333000
𝐏
𝐩𝐩
%
0,144
𝐏
%
Inspektor 1 Inspektor 2 Inspektor 3 10 9 8 7 6 5 4 3 2 1 0,7 0,6 0,5 0,4 0,3 0,2 0,1 0,0 Sample Pr op or ti on _ P=0,1 UCL=0,6196 LCL=0 1 10 9 8 7 6 5 4 3 2 1 1,0 0,8 0,6 0,4 0,2 0,0 Sample Pr op or tio n _ P=0,333 UCL=1 LCL=0 10 9 8 7 6 5 4 3 2 1 1,0 0,8 0,6 0,4 0,2 0,0 Sample P ro p o rt io n _ P=0,2 UCL=0,893 LCL=0 11. ANALISIS KAPABILITAS PROSES
c. Variabel Diskontinuitas
34 31 28 25 22 19 16 13 10 7 4 1 1,0 0,8 0,6 0,4 0,2 0,0 Sample Pr op or ti on _ P=0,765 UCL=1 LCL=0,030 1 1 1 1 1 1 1 1 34 31 28 25 22 19 16 13 10 7 4 1 1,0 0,8 0,6 0,4 0,2 0,0 Sample P ro p o rt io n _ P=0,686 UCL=1 LCL=0 34 31 28 25 22 19 16 13 10 7 4 1 1,0 0,8 0,6 0,4 0,2 0,0 Sample P ro p o rt io n _ P=0,765 UCL=1 LCL=0,030 1 1 1 1 1 1 1 1 1,0 0,8 0,6 0,4 0,2 0,0 Pr op or ti on _P=0,588 UCL=1 LCL=0 1,0 0,8 0,6 0,4 0,2 0,0 P ro p o rt io n _ P=0,706 UCL=1 LCL=0 1,0 0,8 0,6 0,4 0,2 0,0 P ro p o rt io n _ P=0,627 UCL=1 LCL=0I1
I2
I3
I1
I2
I3
NOZZLE
PLATE
1. Analisis Kapabilitas Proses
Inspektor Nozzle Plate Tube
ppmTotal 𝐏 𝐩𝐩% 𝐏𝐩% ppmTotal 𝐏𝐩𝐩% 𝐏𝐩% ppmTotal 𝐏𝐩𝐩% 𝐏𝐩% 1 - - - 588000 0,07 0,18 - - - 2 - - - 706000 0,18 0,13 - - - 101 91 81 71 61 51 41 31 21 11 1 1,0 0,8 0,6 0,4 0,2 0,0 Sample Pr op or ti on _ P=0,203 UCL=0,899 LCL=0 1 1 1 1 1 1 1 1 1 1 1 1 1 1 1 1 1 1 1 101 91 81 71 61 51 41 31 21 11 1 1,0 0,8 0,6 0,4 0,2 0,0 Sample Pr op or ti on _ P=0,190 UCL=0,868 LCL=0 1 1 1 1 1 1 1 1 1 1 1 101 91 81 71 61 51 41 31 21 11 1 1,0 0,8 0,6 0,4 0,2 0,0 Sample Pr op or ti on _ P=0,294 UCL=1 LCL=0
TUBE
I1
I2
I3
c. Variabel Diskontinuitas
2.
AttributeAgreement Analysis
a. Variabel Kelengkapan
0% 20% 40% 60% 80% 100% 1 2 3Masing-masing Inspektor
0.00% 10.00% 20.00% 30.00% 40.00% 50.00% 60.00% 70.00% 80.00% 1 2 3Masing-masingInspektor vs
Standart
100 80 60 40 20 Pe rc en t 95,0% C I P ercent 100 80 60 40 20 Pe rc en t 95,0% C I P ercent Assessment AgreementWithin Appraisers Appraiser vs Standard Kappa = 0,48 Kappa = 0,78 Kappa = 1 Kappa = -0,19 Kappa = 0,45 Kappa = 0,13 90% 80%
2.
Attribut Agreement Analysis
a. Variabel Kelengkapan
Response Kappa (Inspektor QC) Kappa (Inspektor QC vs Standart) ASME Sec 1 0,212846 0,305735 No 0,344784 -0,271963 QCP-7.2 , 2nd Edition Rev-02 0,158739 0,301852 0.00% 10.00% 20.00% 30.00% 40.00%All Inspector All Inspector vs
Standard
Semua Inspektor
Kappa = 0,41 Kappa = 0,13 90% 80%2.
Attribut Agreement Analysis
b. Variabel Keputusan
0% 20% 40% 60% 80% 100% 1 2 3Masing-masing inspektor
0.00% 20.00% 40.00% 60.00% 80.00% 1 2 3Masing-masing inspektor vs standart
100 90 80 70 60 50 40 30 Pe rc en t 95,0% C I P ercent 100 90 80 70 60 50 40 30 Pe rc en t 95,0% C I P ercent Assessment Agreement
Within Appraisers Appraiser vs Standard
Response Kappa (Inspektor QC) Kappa (Inspektor QC vs Standart) Acceptable 0,238722 0,329171 Unacceptable 0,238722 0,329171 90% 80% Kappa = 0,65 Kappa = -0,34 Kappa = 0,28 Kappa = 0,44 Kappa = -0,2 Kappa = 0,75
2.
Attribut Agreement Analysis
a. Variabel Diskontinuitas
Inspektor
Kappa (Nozzle) Kappa (Plate) Kappa (Tube)
Inspektor Inspektor vs standart Inspektor Inspektor vs standart Inspektor Inspektor vs standart 1 0,255 -0,180 0,478 0,118 0,818 0,409 2 1,000 -0,222 0,701 -0,146 0,601 0,537 3 0,440 0,075 0,379 0,214 0,766 0,389 100 80 60 40 20 P e r c e n t 95,0% CI Percent 100 80 60 40 20 P e r c e n t 95,0% CI Percent
Date of study: 01 Mei 2013 Reported by: Nor Imanda
Name of product: Attribut Agreement Type of Defect Sample 1 Misc:
Assessment Agreement
Within Appraisers Appraiser vs Standard
100 80 60 40 20 P e r c e n t 95,0% CI Percent 100 80 60 40 20 P e r c e n t 95,0% CI Percent
Date of study: 01 Mei 2013 Reported by: Nor Imanda
Name of product: Attribut Agreement by Type Defect Sample 3 Misc:
Assessment Agreement
Within Appraisers Appraiser vs Standard
90 80 70 60 P e r c e n t 95,0% CI Percent 90 80 70 60 P e r c e n t 95,0% CI Percent
Date of study: 01 Mei 2013 Reported by: Nor Imanda
Name of product: Attribut Agreement Type of Defect Sample 2 4 5 Misc:
Assessment Agreement
2.
Attribut Agreement Analysis
c. Variabel Diskontinuitas
-0.2 -0.1 0 0.1 0.2 0.3 0.4 0.5Nozzle Plate Tube
0.214 0.185
0.467
-0.109
0.062
0.445
Inspektor Inspektor vs Standart
Discontinuity Nozzle Fillet Tube
Type of Indication 0,043 0,175 0,466
Location of Indication 0,063 0,066 0,434
Size of Indication -0,046 * 0,389
Size of Fillet weld -0,015 0,053 *
Size of reinforcement weld
-0,030 * 0,128
2.
Attribut Agreement Analysis
a. Nozzle
Diskontinuitas Nozzle Other Ukuran Indikas i Ukuran Reinfo rceme nt Ukuran Fillet Lokasi Indikas i Tipe In dikasi 250 200 150 100 50 0 100 80 60 40 20 0 Pe rce nt 0 5 10 15 20 25 19 2 21 10 2 2 6 6 6 2 2 Inspektor 1 Inspektor 2 Inspektor 321 21
10 8
2.
Attribut Agreement Analysis
b. PLATE
Diskontinuitas Plate Other Ukuran Fillet Ukuran Indikas i Tipe In dikasi Lokasi Indikas i 200 150 100 50 0 100 80 60 40 20 0 Per cen t 0 5 10 15 20 25Inspektor 1 Inspektor 2 Inspektor 3
24 24
9
6
Tipe Indikasi Inspekt or 1
Inspekt or 2
Inspekt or 3
Tidak Ada Indikasi 12 18 9
RIP - - 2
SPTR - 1 -
IW - 3 3
Tack Weld on Base Metal
2.
Attribut Agreement Analysis
TUBE
Diskontinuitas Tube Other Tipe In dikasi Jumlah Indikas i Alignm ent Lokasi Indikas i Ukuran Indikas i Ukuran Reinfo rceme nt 200 150 100 50 0 100 80 60 40 20 0 Pe rce nt Ukuran Reinforcement Inspekto r 1 Inspekto r 2 Inspekto r 3 Tidak ada indikasireinforcement 12 10 12 Salah Ukuran 7 2 5
6
3
4
1
10
20
Analisis Sebab Akibat
Problem
Potential causes Source
3. Kapabilitas Proses Tahap II
a. Variabel Kelengkapan
61 55 49 43 37 31 25 19 13 7 1 1,0 0,8 0,6 0,4 0,2 0,0 Sample Pr op or ti on _ P=0,323 UCL=1 LCL=0 61 55 49 43 37 31 25 19 13 7 1 1,0 0,8 0,6 0,4 0,2 0,0 Sample P ro p o rt io n _ P=0,023 UCL=0,342 LCL=0 1 1 61 55 49 43 37 31 25 19 13 7 1 0,50 0,25 0,00 -0,25 -0,50 Sample Pr op or ti on _ P=0 UCL=0 LCL=0 Inspektor 1 Inspektor 3 ppmTotal 323000 0P
pk% 0,153 -𝑃
𝑝% 0,329 -Kapabilitas Proses
I1
I2
I3
3. Kapabilitas Proses Tahap II
a. Variabel Keputusan
10 9 8 7 6 5 4 3 2 1 0,50 0,25 0,00 -0,25 -0,50 Sample P ro p o rt io n _ P=0 UCL=0 LCL=0 10 9 8 7 6 5 4 3 2 1 1,0 0,8 0,6 0,4 0,2 0,0 Sample P ro p o rt io n _ P=0,1 UCL=0,736 LCL=0 1 10 9 8 7 6 5 4 3 2 1 1,0 0,8 0,6 0,4 0,2 0,0 Sample Pr op or ti on _ P=0,1 UCL=0,736 LCL=0 13. Kapabilitas Proses Tahap II
a. Variabel Diskontinuitas
34 31 28 25 22 19 16 13 10 7 4 1 1,0 0,8 0,6 0,4 0,2 0,0 Sample Pr op or ti on _ P=0,691 UCL=1 LCL=0 34 31 28 25 22 19 16 13 10 7 4 1 1,0 0,8 0,6 0,4 0,2 0,0 Sample Pr op or ti on _ P=0,706 UCL=1 LCL=0 34 31 28 25 22 19 16 13 10 7 4 1 1,0 0,8 0,6 0,4 0,2 0,0 Sample Pr op or ti on _ P=0,691 UCL=1 LCL=0 34 31 28 25 22 19 16 13 10 7 4 1 1,0 0,8 0,6 0,4 0,2 0,0 Sample Pr op or ti on _ P=0,529 UCL=1 LCL=0 34 31 28 25 22 19 16 13 10 7 4 1 1,0 0,8 0,6 0,4 0,2 0,0 Sample P ro p o rt io n _P=0,588 UCL=1 LCL=0 1,0 0,8 0,6 0,4 0,2 0,0 Pr op or ti on _ P=0,632 UCL=1 LCL=0Nozzle
PLATE
3. Kapabilitas Proses Tahap II
c. Variabel DISKONTINUITAS
101 91 81 71 61 51 41 31 21 11 1 1,0 0,8 0,6 0,4 0,2 0,0 Sample Pr op or tio n _ P=0,141 UCL=0,879 LCL=0 1 1 1 1 1 1 1 1 1 101 91 81 71 61 51 41 31 21 11 1 1,0 0,8 0,6 0,4 0,2 0,0 Sample Pr op or tio n _ P=0,184 UCL=1 LCL=0 101 91 81 71 61 51 41 31 21 11 1 1,0 0,8 0,6 0,4 0,2 0,0 Sample Pr op or ti on _ P=0,267 UCL=1 LCL=0Inspektor Nozzle Plate Tube
ppmTotal
𝐏
𝐩𝐩%
𝐏
𝐩% ppmTotal𝐏
𝐩𝐩%𝐏
𝐩% ppmTotal𝐏
𝐩𝐩%𝐏
𝐩%1 691000 0,166 0,132 529000 0,024 0,210 - - -
2 706000 0,181 0,126 588000 0,074 0,181 184000 0,300 0,443
4. Attribut Agreement Analysis Tahap II
a. Variabel Kelengkapan
90.0% 92.0% 94.0% 96.0% 98.0% 100.0% 1 2 3 4Masing-masing inspektor
0.00% 50.00% 100.00% 1 2 3 4Masing-masing inspektor vs
standart
Kappa = 0,87 Kappa = 0,2 Kappa = 0,94 Kappa = 1 Kappa = 0,9 Kappa =1 100 90 80 70 60 P er ce n t 95,0% C I Percent 100 90 80 70 60 P er ce n t 95,0% C I PercentWithin Appraisers Appraiser vs Standard
0.2 0.4 0.6 0.8 Tahap I Tahap II PerbandinganKoefisien Kappa Keseluruhan Inspektor Tahap
3. Kapabilitas Proses Tahap II
b. Variabel Keputusan
Inspector Response Kappa (Inspektor QC) Kappa (Inspektor QC vs Standart) 1 Acceptable 1,000 1,000 Unacceptable 1,000 1,000 2 Acceptable 1,000 0,733 Unacceptable 1,000 0,733 3 Acceptable 1,000 0,733 Unacceptable 1,000 0,733 90% 80% 3 2 1 100 90 80 70 60 Appraiser Pe rc en t 95,0% C I P ercent 3 2 1 100 90 80 70 60 Appraiser Pe rc en t 95,0% C I P ercent
Within Appraisers Appraiser vs Standard
0 0.2 0.4 0.6 0.8 1 Tahap I Tahap II
Perbandingan Koefisien Kappa Variabel Keputusan Keseluruhan Inspektor Tahap I dan II
4. Attribut Agreement Analysis
c. DISKONTINUITAS
Inspektor
Kappa (Nozzle) Kappa (Fillet) Kappa (Tube)
Inspektor Inspektor vs standart Inspektor Inspektor vs standart Inspektor Inspektor vs standart 1 0,580 -0,118 0,918 0,232 0,620 0,602 2 1,000 -0,193 0,794 0,114 0,622 0,519 3 0,207 0,003 0,865 0,017 0,858 0,433 3 2 1 100 80 60 40 20 Appraiser P er ce n t 95,0% C I Percent 3 2 1 100 80 60 40 20 Appraiser P er ce n t 95,0% C I Percent
Within Appraisers Appraiser vs Standard
(a) 3 2 1 100 80 60 40 20 Appraiser P er ce n t 95,0% C I Percent 3 2 1 100 80 60 40 20 Appraiser P er ce n t 95,0% C I Percent
Within Appraisers Appraiser vs Standard
95 90 85 80 75 70 65 P er ce n t 95,0% C I Percent 95 90 85 80 75 70 65 P er ce n t 95,0% C I Percent
4. Attribut Agreement Analysis
DISKONTINUITAS
0 0.1 0.2 0.3 0.4 0.5 0.6Nozzle Plate Tube
Tahap I Tahap II
Perbandingan Nilai Kappa pada Inspektor Tahap I dan Tahap II -0.2 -0.1 0 0.1 0.2 0.3 0.4 0.5 0.6
Nozzle Plate Tube
Tahap I Tahap II
Perbandingan Nilai Kappa pada Inspektor vs Standar Variabel Diskontinuitas Tahap II
4. Attribut Agreement Analysis
DISKONTINUITAS
Jumlah 48 47 30 29 24 7 Percent 25,9 25,4 16,2 15,7 13,0 3,8 Cum % 25,9 51,4 67,6 83,2 96,2 100,0 Diskontinuitas nozzle Othe r Ukura n Ind ikasi Ukur an Fi llet Ukura n Rein force ment Tipe I ndika si Loka si Ind ikasi 200 150 100 50 0 100 80 60 40 20 0 P e rc e n t Jumlah_1 61 31 27 18 8 0 Percent 42,1 21,4 18,6 12,4 5,5 0,0 Cum % 42,1 63,4 82,1 94,5 100,0 100,0 Diskontinuitas plate Othe r Jumlah Indik asi Ukur an Fi llet Ukura n Ind ikasi Tipe I ndika si Loka si Ind ikasi 160 140 120 100 80 60 40 20 0 100 80 60 40 20 0 Pe rc en t Diskontinuitas tube Other lah In dikasi inforce ment ran In dikasi asi Indik asi Tipe I ndikas i 300 250 200 150 100 50 0 100 80 60 40 20 0 Pe rc en tNozzle
Tube
Plate
BAB V
Kesimpulan
1. Analisis Kapabilitas Proses pada Tahap 1 menunjukkan kualitas proses inspeksi visual hasil pengelasan yang dilakukan oleh masing-masing inspektor QC terhadap variabel kelengkapan, keputusan dan diskontinuitas masih sangat rendah. Sedangkan pada Tahap II terjadi peningkatan pada variabel kelengkapan
dan keputusan
2 a. Hasil dari variabel kelengkapan menunjukkan bahwa konsistensi antar inspektor terhadap diri sendiri masih kurang, begitu juga konsistensi terhadap standar.
2b. Hasil variabel keputusan dalam menentukan diterima dan ditolaknya specimen menunjukkan bahwa inspektor masih belum konsisten secara benar dalam
Kesimpulan
3. Rendahnya kualitas proses inspeksi dan konsistensi inspektor QC disebabkan oleh tidak ada pemetaan kompetensi dan pelatihan yang menunjang, tidak terdapat prosedur yang
mengatur agar inspektor secara rutin mengecek QCP, tidak terdapat tes persamaan persepsi untuk visual secara berkala, dan tes visual kepada inspektor baru, padatnya
jadwal proyek.
2c. Hasil variabel diskontinuitas menunjukkan bahwa inspektor belum konsisten secara benar dalam mendeteksi dan menilai diskontinuitas pada pengelasan.
2d. menggunakan uji Wilcoxon diketahui bahwa konsistensi yang meningkat dengan signifikan pada tahap II ialah pada variabel kelengkapan dan variabel keputusan oleh masing-masing inspektor dan juga terhadap standar, dan variabel diskontinuitas plate
Saran
1. Sosialisasi dan pelatihan dilakukan bukan hanya dengan presentasi dan tanya jawab lisan, namun langsung praktek untuk setiap inspektor
2. Tingkat kesulitan pada inspeksi visual yang sangat tinggi karena setiap orang memiliki sudut pandang dan persepsi yang berbeda-beda sehingga perlu
ditekankan pada saat pelatihan tentang persamaan titik lokasi awal interpretasi kususnya pada diskontinuitas sehingga sudut pandang terhadap
indikasi secara visual bisa seragam
3. Untuk penelitian selanjutnya, tidak sebatas hanya mengetahui hasil pada tahap pertama dan kedua, namun ditekankan pada ide-ide perbaikan sampai
Daftar Pustaka
American Welding Society. (2004). The Everyday Pocket Handbook for visual
Inspection and Weld Discontinuities-Causes and Remedies. United States:
United States of America.
Bothe, D. R., 1997. Measuring Process Capability. McGraw-Hill. New York.
Cohen, J. (1960). A Coefficient of Agreement for Nominal Scales. Educational
and Psychological Measurement, 20(1), 37-46.
Crosby, D. C. (1998). A Managers Guide to Gauge R&R. Rubber World 218.
Dhuhuri, I. (2012). Visual Inspection of Weld Procedure. In P. A. ESI, Quality
Control Procedure 7.2 (pp. 1-20). Surabaya.
Dietrich, E. (2002). Measurement System Capability. Birkenau: Q-DAS.
Eugene, L. G., & Richard, S. L. (1996). Statistical Quality Control (7th ed.).
united state: McGraw-Hill Companies.
Daftar Pustaka
Fleiss, J. L. (1981). Statistical Methods for rates and Proportions 2nd Editions. john Wiley & Sons.
Ford Motor Company. (2002). Measurement System Analysis Refrence Manual (3th ed.). Daimler Chrysler Corporation, General Motors Coorporation.
Gaspersz, V. (2003). Metode Analisis untuk Peningkatan Kualitas. Jakarta: Gramedia Pustaka Utama.
Issa, B. (2007). Six Sigma Statistics with Excel and Minitab. New York: The McGraw-Hill Companies.
Iulian, O. A., & Constantin, B. (2012). Multicritical Optimization Applied for Choosing The Measuring Instrument. Regent, 13.
Kooshan, F. (2012). Implementation of Measurement System Analysis System (MSA): In The Piston Ring Company "Case Study". International Journal of Science and Technology,
Daftar Pustaka
Johnson, N. L., & Kotz, S. (1969). Discrete Distributions. John Wiley & Sons, Inc. Kunz, A. (n.d.). Misclassification and kappa-statistic: theoretical relationship and consequences in application. Analyse Fehlerbehafteter Daten. Munchen: Institut Fur Statistik.
Kuswandi, & Mutiara, E. (2004). DELTA, Delapan Langkah dan Tujuh Alat Statistik untuk
Peningkatan Mutu Berbasis Komputer. Jakarta: PT. Elex Media Komputindo.
Landis, J., & Koch, G. (1977). The Measurement of Observer Agreement for categorical Data. Biometrics, 159-174
Mega, R. A., Yanti, T. S., & Lisnur, W. (2009, Nopember). Uji Keberartian Koefisien raw Agreement. Statistika, 9(2), 83-88.