Vulnareble Regions and Disaster Management
A GIS Model for Predicting Disaster Prone Areas Affected by
Global Sea-Level Rise: a Case Study of Semarang City
Anang Wahyu Sejati 1, Imam Buchori 2
Department of Urban and Regional Planning, Diponegoro University, Semarang
[email protected]; [email protected]
Abstract
The issue of global warming that increases sea level will certainly have an effect on sustainability of coastal areas, including coastal cities. Some studies predict that in 2050 the potentially flooded areas around the world will increase approximately one to three meters (WOC, 2007). This tendency will in turn influence the sustainability of many Indonesian cities, particularly those located on coastal areas. Regarding the above issue, this research aims at developing a spatial model using Geographic Information System (GIS) for predicting/delineating disaster prone areas in coastal cities. The model
involves some GIS analysis’ capabilities, such as spatial overlay, weighting method and spatial query
to delineate flooded areas based on the increase of global sea level and its topography. To test the developed model, Semarang City is selected as the case study with consideration that some previous researches have been done in this area so that most of required data have been collected. The model is then validated using empirical data and field visits to compare between the result and the current situation. The result of application shows that the developed model is satisfied. As for the case of Semarang City, the result shows that 71.6 km2 of Semarang coastal areas are potentially flooded,
which 5.04 km2 are highly risk. By superimposing the potentially flooded areas and some vulnerability
aspects, the model delineates disaster prone zones as high, moderate and low level. In spite of the fact that the model development purpose is accomplished, further studies are still needed, particularly to specify variables of vulnerability due to the characteristics of the city. Besides, a 3D model can also be combined with the developed model to improve its visual view.
Keywords: GIS, Disaster Prone Areas, Sea-level rise.
1. Introduction
Many coastal cities in the world presently face a serious problem relating to flood tide and flood from both river and sea inundation (in Indonesia is
known as “rob”) affected by the rise of global sea
level due to the issue of global warming. The sea tidal is acually not only influenced by the moon and the sun gravitations, as mentioned by Newton and Laplace theory, but also by global temperature. The heater the weather is, the higher the sea elevation will be (Miossec, 2002).
Some researches done by the National Centre for Scientific Research (CNRS) that is located in Paris revealed that the melting ice in Arctic of North Pole, which lost area is more than twice of France or ten times of Java Island, in the last two years, has been significantly influencing the volume of global sea water. In turn, the sea level around the world has also been increasing (Diposaptono, 2008).
The rise of sea level also puts many Indonesian cities, particularly those located in coastal areas, in danger. However, some regulations aiming at managing coastal areas have been issued by the Indonesian government, such as Law 26/2007 on Spatial Planning, Law 27/2007 on Coastal and Small Islands, and Law 24/2007 on Disaster. Those laws order that spatial planning should consider characteristics of the
planned area, particularly relating to disaster impacts, hazards and vulnerabilities. For this area, the spatial plan should be accomplished by a mitigation system that can minimize disaster risks. For coastal areas, the mitigation system should consider hazard impacts and vulnerabilities of
flood tide and “rob”. By identifying its disaster impacts, the hazards and vulnerabilities can also be predicted (see Wahyudi, 1999).
Meanwhile, some studies estimate that in 2050 the global sea level will rise approximately one to three meters (WOC, 2007). If it really occurs, it will certainly endanger many cities and regions. Therefore, urban and regional development should consider this issue in order to assure that they will be sustainable in the future.
Vulnareble Regions and Disaster Management
regional planning, particularly costal development and planning based on disaster mitigation concept.
2. Methodology
This research can be categorized as a model development research, which uses model development stages as follows: identifying the purpose of the model; identifying the components of the model/system; identifying the time scale of the model; selecting from a range of model building techniques in representing the concept; and assessing the model to be calibrated and tested. Since the developed model works with spatial information, it can therefore be categorized as spatial model, in which the reality is presented by maps and other spatial information.
The main GIS software used is ArcView 3.3, assisted by Global Mapper 7.1 for deriving Digital Elevation Model (DEM)-map into contour map. The base map for analysis is on the scale of 1:10,000. Some variables requiring more detail information, such as buildings and roads, will use 1:5,000 of base map scale. However, the superimpose analysis will still be based on the scale of 1:10,000.
Furthermore, the model development actually consists of several objectives, as follows:
To identify potential hazard of flood tide and
“rob” affected by the rise of global sea level. For
this, the required data are tidal map, land subsidence map, data prediction of the rise of global sea level, which is represented by DEM or contour map and environmental geology map that indicate the tendency of land subsidence. Its scoring variable is as shown in Table 1.
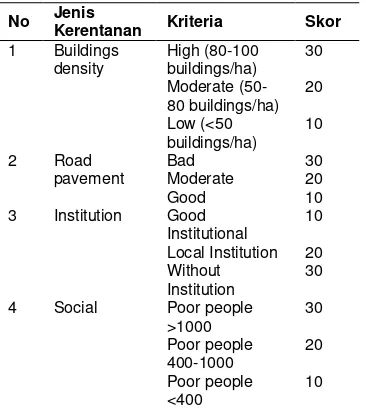
To identify the settlement, infrastructure, social, and institutional vulnerabilities. Settlement vulnerability is based on its density, which in this model is divided into three categories, i.e. high density (80-100 buildings/ha), moderate density (50-79 buildings/ha), and low density (less than 50 buildings/ha). Infrastructure vulnerability is measured based on the road pavement. The harder the pavement, the lower the vulnerability level. Social vulnerability is based on the poverty level of each administrative unit, which in this case is kelurahan (urban village) administrative boundary. Institutional vulnerability is based on the presence or absence of disaster unit within the local government organization system. The score of each category is as shown in Table 2.
To develop spatial model representing risk levels
of the flooded and “rob” areas. They are
Table 1. Hazard scoring factor
No
Source: Diposaptono with modification, 2009
Table 2.Vulnerability scoring factor
No Jenis
Kerentanan Kriteria Skor
1
Source: Diposaptono with modification, 2009
3. Model Application 3.1 Hazard Model
Vulnareble Regions and Disaster Management
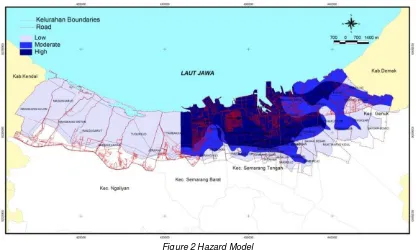
Figure 2 Hazard Model
Based on the data above, the seawater inundated land on 2050 can be predicted. Below is the calculation of inundation on 2050 referring to the data on 2006 that is 8 cm of change and 5 cm of land subsidence. The height of seawater flooding the land is counted for 2.55. This means that more or less the land is inundated 1-3 m high with different level of hazard. The Figure 2 is the map of hazard. Based on the above result, areas which are adjacent to the coast to 2.5 km to the south are the most hazaradous areas. While areas with the lowest hazardous are areas which are not regarded as coastal area such as some sub-districts in Semarang Tengah and Gayamsari. This hazard model, therefore, can be used as an input for 2050 planning especially for areas that are predicted to be flooded by the sea level rise due to climate change.
3.2 Settlement Vulnerability Model
Settlement vulnerability is assessed through settlement which is assumed as residents concentration. Density is calculated based on the rule of settlement density with score which has been discussed before. The result of modeling process for settlement is described in Figure 3.
From the result, the vulnerability level can be seen based on the color on the map legend. The highest vulnerability is on the dense population which width is 20 km2 such as Semarang Tengah Sub-district, Semarang Timur, and Gayamsari.
Meanwhile, the moderate level of vulnerability is on some of Genuk areas because these areas are focused for industry and transportation. The low vulnerability is mostly on Tugu Sub-district, Tanjung Mas Harbor area, and Terboyo area. This is caused by the major land use in the areas which are not for settlement and
Vulnareble Regions and Disaster Management
Figure 3 Settlement Vulnerability Model
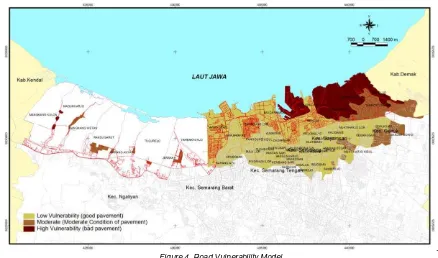
3.3 Road Vulnerability Model
This vulnerability factor is assessed on the paved roads which then are zoned for areas with different level of quality. From the data, damaged
Vulnareble Regions and Disaster Management
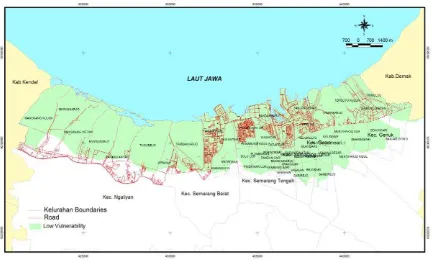
institutional vulnerability in Semarang coastal areas is 10 as shown in Figure 5.
3.5 Social Vulnerability Model
Social vulnerability is assessed based on the number of poor residents in each area. The unit used for analysis is kelurahan administrative unit which poverty data is taken from Bappeda
Semarang 2008. Database input is used to determine the vulnerability level which standard has been set, that is less vulnerable whenever the population is less than 400 inhabitants per area, vulnerable whenever the population is 400-1000 inhabitants, and highly vulnerable whenever the population is more than 1000 inhabitants.
Figure 5. Institutional Vulnerability Model
The assessment is conducted because an area having higher poverty level is regarded not ready to cope with disaster. Thus, it is assumed that the area is vulnerable to any possible disaster because poverty is identical with poor facility and unhealthy environment as well as poor physical quality of the settlement. Spatially, the data is entered and transferred into geographic information system model and result on the social vulnerability model as shown in Figure 6.
Vulnareble Regions and Disaster Management
Figure 6. Social Vulnerability Model
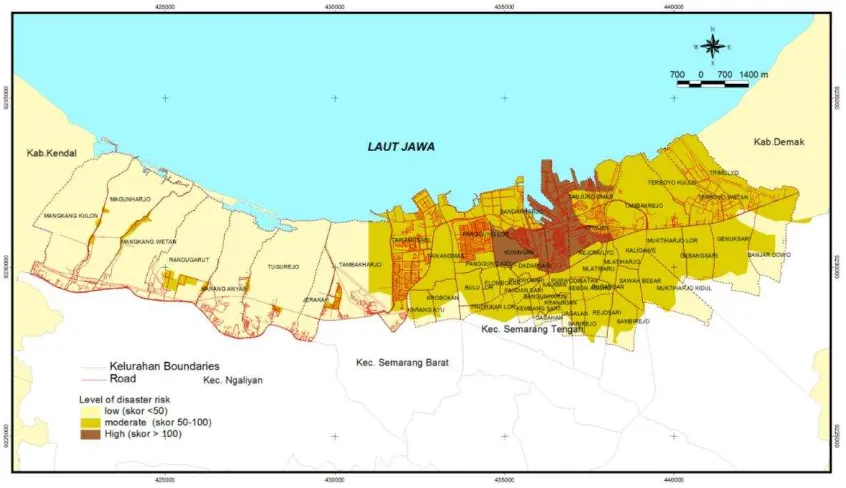
3.6 Disaster Risk Model
As explained in model development section, the disaster risk is obtained from the overlay of hazard and vulnerability which have been scored for each variable. There are three level of zones classification on Semarang coastal areas based
Vulnareble Regions and Disaster Management
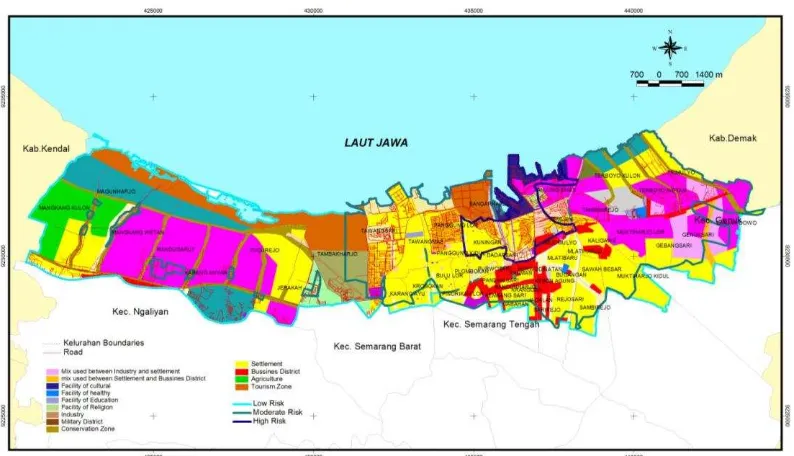
Figure 8. Overlay of Disaster Risk and Land Use Existing
3.7 Research Findings
After including the hazard factor resulted from contour derivation and land subsidence, prone zones to the outer of Semarang coastal areas are attained. It means that in 2050, the hazard of tide is not only on coastal areas but also other areas. The width for each hazard level is 19.09 km2 (high), 13.66 km2 (moderate), and low (39.59 km2).
There are zones for different areas for each vulnerability category based on the score which is suitable for this research. For this research, the determining factors for coastal areas are settlement, infrastructure, social, and institutional vulnerability. The width is adjusted with the vulnerable areas, meaning that each prone area is areas within disaster prone zone.
On the settlement vulnerability, the settlement vulnerability model in each level is highly vulnerable (23.38 km2) which majority is at Semarang Tengah, Semarang Utara, Semarang Timur, and Gayamsari Sub-district. The width of moderate vulnerable area is 6.67 km2 which majority is at Genuk and Tugu Sub-district, while the less vulnerable area (41.01 km2) is less populated area such as Tugu Sub-district and the north of Semarang Barat.
On infrastructure vulnerability, the width of highly vulnerable area is 8.02 km2 at Terboyo in which road networks are severely damaged. The moderate vulnerable area is 6.64 km2 at Genuk and Semarang Timur Sub-district. The less moderate areas are Semarang Barat, Semarang Tengah, Semarang Timur, and Gayamsari Sub-district which is 28.2 km2 width.
Social vulnerability on Semarang coastal area with high vulnerability is the areas with poor residents such as Kelurahan Bandarharjo (1585 inhabitants), Tanjung Mas (2385 inhabitants), and Kemijen (1281 inhabitants) which have the biggest poor residents.
Besides, disaster prone areas also have high social vulnerability such as Rejosari (1199 inhabitants) and Rejosari (1460 inhabitants).
The institutional vulnerability is low for all disaster prone areas since Semarang City especially its coastal areas have already established disaster control institution.
Based on overlay result, the hazard and vulnerability factors result on zoning model of high disaster risk at Semarang Utara areas such as Kelurahan Panggung Kidul, Dadapsari, Kuningan, Kemijen, Tnajung Emas, and some areas in Bandarharjo; ang low disaster risk that are Rejosari and Tugu Sub-district covering Mangunharjo and Mangkang Wetan area.
The width of high disaster risk is 5.04 km2, moderate disaster risk is 39.67 km2, and low disaster risk is 37.73 km2.
On the three levels of disaster risk, the biggest land use is for settlement and service trade. It is vulnerable that the plan shall consider how to protect and reduce the land use which gives opportunities for people to reside such as height that is developed by the model is close to the calculation result and that the study from some sources observing existing condition and reliability of the model is moderate, thus the model can be developed to reach high reliability.
Vulnareble Regions and Disaster Management
are possibly developed such as vulnerability which is first attained from historic and height which is obtained from DEM value derivation that in this research is used to obtain additional factor influencing the height such as land subsidence, as well as for the vulnerability factors which is possible to develop to determine the model of disaster risk zones.
High disaster prone areas are mostly in dense population and poor social level.
After conducting the application, the areas with high disaster risk (5.04 km2 width) are areas at Semarang Utara such as Kelurahan Panggung Kidul, Dadapsari, Kuningan, Kemijen, Tanjung Emas, and some areas at Bandarharjo. The low disaster risk is Rejosari and Tugu Sub-district covering Mangunharjo and Mangkang Wetan. The widest disaster risk is moderate disaster risk (29.7 km2) which is potential to be high disaster risk by considering the development intensity which reaches to coastal areas.
This model is relatively dynamic to develop and adjust to the development of variables adjusted with the condition of research areas. Yet, vulnerability factors must be included in disaster risk zoning to determine the risk, while its variables are open to develop.
References
Brimicombe, Alain. 2003 Environmental Modelling Using GIS. London Press
Dahuri, H.R., Rais, J., Ginting, S.P., dan Sitepu, M.J., 2001. Integrated Management of Coastal Areas and Marine Resource, PT Pradnya Paramita, Jakarta.
Davis, G.B. 1974. Management Information
System: Conceptual Foundation, Structure, And Development. New York: MC Graw Hill. Department of Fishery and Marine, 2002.
Ministerial Decree No. 34 Tahun 2002,
Jakarta.
Diposaptono,et.al, 2008. Dealing With Climate Change in Coastal Areas and Small Islands. Populer: Bogor.
ESRI, 1996. GIS for School and Libraries Version 5, Environmental Research Institute.
Kay R and Alder J, 1999. Coastal Planning and
Management, E & FN Spon, an imprint of Routledge, London.
Kodoatie, R.J., 2004. Flood (Banjir), Pustaka Pelajar: Yogyakarta.
Laurini, Robert. 2001. Information Systems for
Muhrozi, 2004. Independent Research of
Semarang’s Land Subsidence., Unpublished.
Prahasta, Eddy. 2001a.Sistem Informasi
Geografis “Tutorial ArcviewI.” Bandung: CV. Informatika.
________________2001b. Geographic
Information System “Tutorial Arcview II Avenue Programming Language”. Bandung: CV. Informatika
Ramdhani A dan Suryadi K. 1998. Decision Supporting System. Bandung: Rosda
Realino, B. 1998. Geographic Information System with PC ArcInfo. Jakarta: Lab. GIS & Geomatics-BPP Teknologi.
Semarang Detail Urban Spatial Plan 2000-2010. Regional Development Planning Board Semarang
Indonesia Republic, 2007. Laws No. 24, 2007 on Disaster, National Secretariat, Jakarta. Indonesia Republic, 2007. Laws No. 26, 2007 on
Spatial Planning, National Secretariat, Jakarta. Indonesia Republic, 2007. Laws No. 27 on 2007 on Coastal and Small Islands Management.
National Secretariat, Jakarta.
Sejati, Anang Wahyu. 2007. Model of Coastal Land Use Determination by Using Geographic Information System (GIS) (Case Study: Semarang Coastal Area). Unpublished thesis. Regional and Urban Development Department. Engineering Faculty, Diponegoro University.
Supriharyono, 2000. Natural Resource Conservation and Management in Tropical Coastal Areas, PT. Gramedia, Jakarta. Wahyudi, Imam.2002. A Research on Tide
Change towards Inundation. Jurnal Pondasi: Unisula Press
Igawa, N. and H. Nakamura, (2001). All Sky Model as a standard sky for the simulation of daylite environment. Building and Environment, 36: p. 763-70.
International Daylight Monitoring Programme, [Online], Available: http://idmp.entpe.fr/ [16 June 2008].
Kittler, R., (1985). Luminance distribution characteristics of homogeneous skies: a measurement and prediction strategy. Lighting Research and Technology, 17(4): p. 183-8. Perraudeau, M., (1988). Luminance models. In
National Lighting Conference. Cambridge, UK, March 27-30.