ANALYSIS OF URBAN DEVELOPMENT BY MEANS OF MULTI-TEMPORAL
FRAGMENTATION METRICS FROM LULC DATA
M. Sapena, L.A. Ruiz*
Geo-Environmental Cartography and Remote Sensing Group, Universitat Politècnica de València, Camino de Vera s/n, 46022 Valencia, Spain - [email protected], [email protected]
KEY WORDS: Fragmentation Metrics, Urban Change, Growth Patterns, IndiFrag, LULC, Remote Sensing, Multi-temporal
ABSTRACT:
The monitoring and modelling of the evolution of urban areas is increasingly attracting the attention of land managers and administration. New data, tools and methods are being developed and made available for a better understanding of these dynamic areas. We study and analyse the concept of landscape fragmentation by means of GIS and remote sensing techniques, particularly focused on urban areas. Using LULC data obtained from the European Urban Atlas dataset developed by the local component of Copernicus Land Monitoring Services (scale 1:10,000), the urban fragmentation of the province of Rome is studied at 2006 and 2012. A selection of indices that are able to measure the land cover fragmentation level in the landscape are obtained employing a tool called IndiFrag, using as input data LULC data in vector format. In order to monitor the urban morphological changes and growth patterns, a new module with additional multi-temporal metrics has been developed for this purpose. These urban fragmentation and multi-temporal indices have been applied to the municipalities and districts of Rome, analysed and interpreted to characterise quantity, spatial distribution and structure of the urban change. This methodology is applicable to different regions, affording a dynamic quantification of urban spatial patterns and urban sprawl. The results show that urban form monitoring with multi-temporal data using these techniques highlights urbanization trends, having a great potential to quantify and model geographic development of metropolitan areas and to analyse its relationship with socioeconomic factors through the time.
1. INTRODUCTION
Monitoring, assessing the influences of LULC change, and measuring landscape patterns and their change processes have become a priority for researchers, land managers and policy makers (Liu et al., 2010; Malaviya et al., 2010). The continuous changes of LULC are produced by the dynamic features of urban areas (Hermosilla et al., 2012). Recent researches are focused on quantifying urban growth and identifying the types (Liu et al., 2010; Sun et al., 2013). The knowledge of how urban areas are distributed and its variation is essential to successfully manage urban environmental impacts. Multi-temporal analysis allows for the detection of changes over the time, deducing landscape evolution, and understanding the consequences of human activities in the environment (Ruiz et al., 2013). The evolution of spatial structure in a city is a result of natural, social, economic and technology factors (Tian et al., 2011). The population increase in urban areas demands more natural resources, including land for building housings and industrial, commercial and transport infrastructures. The trend to move out of city centres to the suburbs often drives the development of urban sprawl (European Commission, 2012). This urban expansion usually grows in a scattered way throughout countryside. Commonly, drivers of urban sprawl can be grouped into economic factors, demographic factors, housing preferences, social aspects, transportation, and regulatory frameworks (EEA, 2011).
Low density and scattered urban sprawl can create negative environmental, social and economic impacts for cities and rural areas. Air pollution due to car dependency lifestyle, forced by dispersed land development, or the increasing loss of land resources as agriculture and green areas reducing biodiversity, are examples of such environmental impacts. Thus, the study of
urban landscape over the time is essential for monitoring and mitigating ecological consequences (Zhou and Wang, 2011; Sun et al., 2013). Landscape patterns have been defined as the spatial arrangement of several landscapes elements in various magnitudes, and this arrangement reveals the heterogeneity of the landscape, which is the result of diverse ecological processes (Liu et al., 2010). Quantifying these patterns and their changes will be beneficial for a sustainable urbanization development (Tian et al., 2011).
Landscape metrics have been widely used for describing the spatial heterogeneity of land use and urban morphological characteristics, but also to analyse land use dynamics, urban growth processes and changing patterns (Lausch and Herzog, 2002; Malaviya et al., 2010; Zhou and Wang, 2011; Sun et al. 2013; Godone et al, 2014). These patterns have been proved to reflect, very often, policy adjustments and economic developments throughout the time (Tian et al., 2011). Nevertheless, there are some constraints for quantifying urban dynamics (Liu et al., 2010), and various researches proposed new multi-temporal indices for understanding spatio-temporal land use dynamics in growing regions (Pan et al., 2011; Yin et al., 2011). Multi-temporal indices allow for the analysis of the landscape evolution, and the relationship with its spatial distribution (Liu et al., 2010).
The development of new multi-temporal databases of land use land cover (LULC) data makes the study of urban sprawl, landscape patterns, and urban fragmentation more feasible. A good example is the European Urban Atlas (UA) (Copernicus, 2010), created to compare land use patterns amongst cities. It is mainly derived from satellite images using a cost-efficient method. The purpose of the UA is to make available high-resolution hotspot mapping of changes in urban spaces,
providing the basis to obtain indicators for a variety of users.
In this framework, the main objectives of this study are: (1) To introduce a software tool (IndiFrag) for the extraction of urban LULC metrics at different levels and using multi-temporal data; (2) to assess the capabilities of these metrics in the analysis of urban sprawl dynamics based on preliminary data from the Urban Atlas; and (3) to preview and discuss their use for comparison of the expansion patterns of different cities, their relation with socio-economic variables, and for the definition of models of urban growing based on these data that are becoming available in a regular basis.
2. DATA AND MATERIALS 2.1 Dataset
This study was conducted using the European Urban Atlas database, distributed by the European Environment Agency (EEA) as part of the local component of the GMES/Copernicus land monitoring services. This database provides inter-comparable, high-resolution land use maps for 305 and 695 large urban zones and their surroundings, with more than 100,000 and 50,000 inhabitants for the referenced years 2006 and 2012, respectively. It has an equivalent geometric scale of 1:10,000, and a minimum overall accuracy of 80%, with 85% in artificial surfaces (Meirich, 2008). The UA-2006 is validated and currently available, while the UA-2012 is still under a quality revision process, and partially available through a Web Map Server (WMS). Considering this restriction, the dataset selected for this preliminary study was composed of 2006 and 2012 LULC data in vector format from the province of Rome, in the region of Lazio, Italy, approximately located between
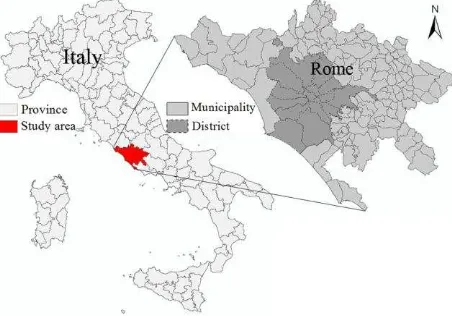
geographic coordinates 41º24’ - 42º17’ N and 11º44’ - 13º18’ E (Figure 1).
Figure 1. Geographic location of the Urban Atlas dataset used: Province of Rome, region of Lazio, Italy
Additionally, the municipality boundaries inside the province of Rome were obtained from the Global Administrative Areas database (GADM, 2011), and the district boundaries inside the municipality of Rome from Iptsat (2013). Both datasets were available in vector format, and after a revision and edition process to match their boundaries were finally merged into a single coverage.
Statistical data of population were obtained from the Italian National Institute of Statistics (Istat) for each municipality
inside the province of Rome. A total of 121 municipalities and 15 districts of the municipality of Rome were available, making a total study area of 5,352 km².
2.2 Urban fragmentation and multi-temporal metrics The processing tool used for the extraction of landscape metrics from LULC data was IndiFrag (Sapena and Ruiz, 2015). This software uses data in vector format, and computes a set of fragmentation indices that can be categorised into five semantic groups according to the measured properties: area and perimeter, shape, aggregation, diversity, and contrast. The metrics are calculated and referred to cartographic objects at several hierarchical levels: object, class and super-object. IndiFrag tool allows working with different super-objects in the study area at the same time. For instance, in our case they would be the administrative boundaries of municipalities and districts. The application to datasets of different periods allows for the analysis of changes in terms of fragmentation and urban morphology. In order to improve the performance of landscape indices for measuring landscape patterns and their change processes, a multi-temporal module was developed and included in the tool IndiFrag. This new component computes a set of multi-temporal indices that were carefully selected from the related bibliography. Therefore, two groups of metrics will be used to perform the multi-temporal analysis, those obtained by comparing the indices independently extracted from the two dates, and those extracted directly from multi-temporal LULC data. These new indices would be applied in three calculation levels according to the complexity degree of the objects.
3. METHODOLOGY 3.1 Legend adaptation
The first step of data pre-processing consisted on the unification of the legends from the two datasets and the simplification for the purposes of urban evolution. The original 20 and 27 thematic classes from the UA-2006 and UA-2012, respectively, were reclassified to 8 aggregated land use classes following the criteria of class similarities, thematic coherence, and simplification for processing efficiency and ease interpretation. Figure 2 shows the correspondence between the UA-2006 legend and the new legend. A detailed description of the mapping units and legend of the UA can be found in Meirich (2008).
3.2 Urban fragmentation indices
A set of urban fragmentation indices from those computed by IndiFrag was selected for processing in this study at three hierarchical levels: patch (object level), land uses (class level), and municipality or district boundary (super-object level). These indices were applied to the LULC UA-2006 and UA-2012 from the province of Rome in order to analyse changes and highlight growth patterns. The indices chosen were: (i) Urban Density, that quantifies the proportion of artificial area, is the ratio between the classified urban area and the super-object area. In this case, the classified as urban is composed of housing, commercial, industrial and landmark buildings, roads, barren land and leisure areas, and the super-objects are defined by the administrative boundaries; (ii) Weighted Standard Distance, measures the degree to which features are concentrated or scattered around the centroid of the objects of a given class, weighted by the size of each object; (iii) Euclidean Nearest Neighbour Mean Distance, is the mean of the distances between the edges of the objects of the same class, providing a measure of the scattering of similar objects; (iv) Shannon Diversity, that represents the abundance and evenness of the classes present, and it is not affected by the spatial distribution of objects; and (v) Edge Contrast Ratio, which quantifies the degree of contrast between objects from different land uses, the road network was excluded from the process to obtain a more realistic index.
3.3 Multi-temporal indices
The multi-temporal indices are also classified in three levels, but organised depending on the complexity degree of the objects: (i) First level, where the class under analysis is urban land use, composed of all the artificial surfaces or urban areas (i.e. housing, commercial, roads, barren land, leisure and green areas), working in fact as a binary mask; (ii) the second level distinguish between different classes, therefore each land cover class generates a different mask; and (iii) the third level is
equivalent to the LULC change matrix (Malaviya et al., 2010), where every object works as a pixel, and the number of objects and total area of change between classes are computed. In our case, the three levels were applied to each municipality and district, as well as to the total study area, obtaining change metrics at global and local scales (at province of Rome level, and at municipality and district level, respectively). IndiFrag compiles the results into the attribute table of each shapefile, and a text file with a summary of the results is also generated.
The following multi-temporal metrics applied to urban studies were found in the literature: (i) Landscape Expansion Index (LEI), Mean Expansion Index (MEI) and Area-Weighed Mean Expansion Index (AWMEI) from Liu et al. (2010), these indices are useful for describing growth types; (ii) Annual Urban Expansion Intensity Index (AUEII) from Yin et al. (2011) evaluates the spatial distribution of urban expansion; (iii) Rate of Change (r) from Malaviya et al. (2010), it measures the change relative to the time interval; (iv) Annual Growth Rate (GR) from Tian et al. (2011) representing the average of change in a land use; (v) Land-Use Degree ratio index (LUD) and Land-Use Change (LUC), from Pan et al. (2011), based on the urban exploitation degree of change; (vi) Urban Expansion Intensity (UEI) from Jing and Jianzhong (2011), it reflects the rate of urban expansion during a certain period of time; (vii) methods based on concentric and sector analysis, from Yin et al. (2011), used for characterizing the amount and spatial distribution of changes; and (viii) Change ( ) and Change Rate ( ) from Tian et al. (2014), that represent the absolute value and the rate of annual change, respectively.
The indices r and GR were rejected since they express the ratio of annual change, as UEI. and are proportional and only useful when different periods of time are analysed. However, in our case there was only a time interval, so none of them were included. The correlation of the remaining indices was assessed at the first level (urban land use) for all the administrative Figure 2. Reclassification of the UA legend into more general classes. Dark boxes represent the new classes. Modified from Meirich
objects of the study area, obtaining the values of Table 1. Due to the high correlation between MEI and AWMEI, only AWMEI was calculated, since it provides a relative measure about the type of urban growing.
MEI AWMEI AUEII UEI Ar LUC MEI - 0.970 0.361 0.019 0.302 0.234 AWMEI 0.970 - 0.309 0.046 0.275 0.176 AUEII 0.361 0.309 - -0.481 0.713 0.727 UEI 0.019 0.046 -0.481 - -0.296 -0.513 Ar 0.302 0.275 0.713 -0.296 - 0.524 LUC 0.234 0.176 0.727 -0.513 0.524 -
Table 1. Correlation values of the selected multi-temporal indices
The selected indices based on the correlation and redundancy analysis (LEI, AWMEI, AUEII, LUD, LUC, and UEI) were developed as a new module in IndiFrag, and they are described in the following sections.
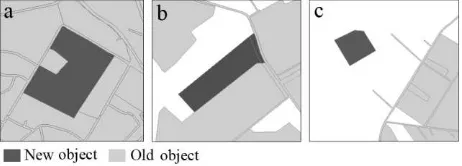
3.3.1 Urban growth types: The type of urban sprawl can be described by quantifying three growth types: infilling, edge-expansion, and outlying (Wilson et al., 2003; Liu et al., 2010; Sun et al., 2013). Infilling refers to the gap inside old urban patches of the same class that have been partially or totally filled with a newly grown patch of the same class (Figure 3a). Edge-expansion occurs when a new urban patch appears on the contour of an existing patch from the same class (Figure 3b). The outlying growth occurs when the new urban patches are isolated (Figure 3c).
Liu et al. (2010) proposed several indices to quantify urban dynamics, and they were slightly modified and implemented in IndiFrag. First, the objects are classified in two groups, i.e. new developed and old objects. Those objects that existed in both dates are classified as old, while those that did not exist in the first date are new. The ratio between the length of the common edge and the object perimeter was employed to distinguish between these growth types.
The Landscape Expansion Index (LEI) provides a deeper insight of landscape patterns and temporal dynamics, and it is calculated only for new objects as:
(1)
where = length of the shared edge = perimeter of the new object
It ranges from 0 to 100, where infilling type is 100 ≥ > 50, edge-expansion 50 ≥ > 0, and outlying = 0. This index generates an output bar graph that represents the absolute area of each growth type in the total study area (the province of
Rome). Its value at super-object level (municipality and district) is also calculated and reported.
The Area-Weighted Mean Expansion Index (AWMEI) weights the area of each object. It reflects the aggregation properties of the object mosaic. Its formula is:
∑ (2)
where = for a new object = area of a new object
= total area of new objects
A high value of AWMEI indicates a compacted pattern of the urban growth, while a low value represents a scattered trend.
3.3.2 Proportion of Change: The Annual Urban Expansion Intensity Index (AUEII) represents the spatial distribution of urban expansion divided by the number of years of the study period, and it evidences urbanization speed (Yin et al, 2011). However, since in this case there is only one period of time, the number of years was excluded from the formula. This index was applied to every class independently, and it was renamed Proportion of Change index. This ratio represents the change of a particular class with respect to the total area of the administrative boundary, and it is useful to assess the relative area of change of the different classes.
% (3)
where = class area within the target area at time n+i = class area within the target area at time i
= total area of the target area at time n+i
3.3.3 Estimation of the degree of LULC change: Pan et al, (2011) proposed change analysis indices that group land uses into four levels based on their urban exploitation degree. The Land Use Degree ratio index (LUD) for each date and the Land Use Change (LUC) index are expressed as:
∑ (4)
∑ ∑
∑ (5)
where = level of land use type (1= barren land, 2= forest and water, 3= agricultural and leisure areas and 4= housing, commercial and roads)
= percentage of the land use in the target area = percentage of the land use in the target area at first date.
= percentage of the land use in the target area at second date.
When LUC is higher than zero means that the LULC of the target area is in developing stage, otherwise it is in adjusting or declining stage.
3.3.4 Dynamic analysis: Concerning the attempts to characterise the evolution of urban expansion, Jing and Jianzhong (2011) proposed the Urban Expansion Intensity index (UEI) and the City Centre Coordinates (CCC). The former index was applied to all classes, and its formula is:
(6)
where = class area within the target area at time n+i = class area within the target area at time i
= interval of the period in years
This index averages the annual rate of change of a land use type or class. The CCC reflects the area of a land use changed in a period of time, and it shows the tendency of aggregation with respect to the geometric centre and its displacement.
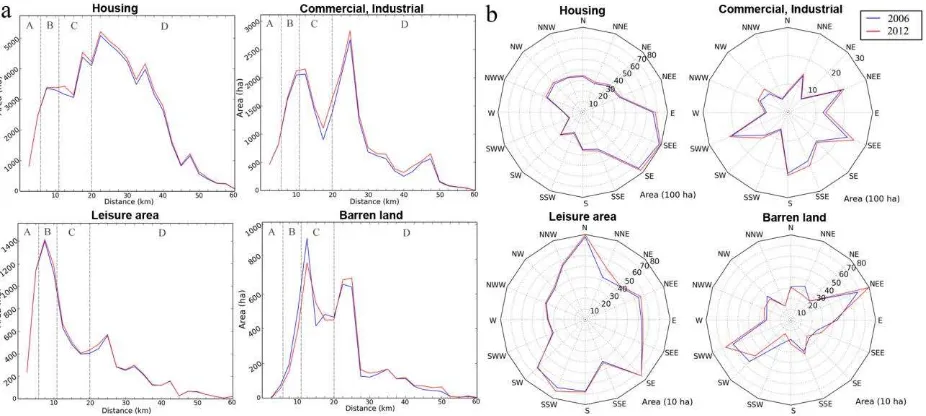
3.3.5 Global growth graphs: The concentric circle and sector analysis graphs are used to characterise the quantity and spatial distribution of land uses, measuring areas at different distances and orientations with respect to a point considered the centre of the data (Yin et al, 2011). In this study the centre was located at the city hall of Rome.
A total of 24 concentric zones delimited every 2.5 km (Figure 4a), and 16 sectors defined by angles of 22.5º (Figure 4b) were created. The comparative areas of land uses within the concentric zones and sectors were then represented in growth curves and radar graphs.
Figure 4. (a) Concentric zones and (b) sectors defined in the study area, superposed on the 2006 LULC map
4. RESULTS
The analysis of urban fragmentation metrics obtained from the LULC maps (2006 and 2012) revealed significant changes during this period. First, a general increase in Urban Density in the study area was detected, with a maximum in the municipalities of Anzio, Colleferro, Fiano Romano and Valmonte, and the districts 3, 6, 9, and 14. There is a general decrease of the Euclidean Nearest Neighbour Mean Distance in the classes housing and commercial and industrial, suggesting the restructuring of the study area to a less dispersed city. This fact was accompanied by the reduction of the Weighted Standard Distance in most of the municipalities, which implies a more compacted distribution of classes with respect to its geometric centre. Although an increase of the Shannon Diversity index was noticed, meaning more variety of patch types, it was also detected a decline of the Edge Contrast Ratio, not only in housing and commercial classes, but also at super-object level (municipalities), suggesting less contrast between contiguous patches of the same class and a more homogenous distribution.
Figure 5 shows the global change patches and their location in concentric zones with respect to a centre point (city hall of Rome). A represents the urban centre, B the peri-urban area delimited by the ring road, C demarcates the extent of the districts in Rome, and D the other surrounding municipalities. A concentration of change patches is detected in the interface of
zones B and C, revealing the location of the main urban expansion.
Figure 6 shows the main urban land uses considered as built-up areas, being those that grow more in the study area. The barren land use is also included into this category, since it is in fact a transition land use to build-up areas (housing, commercial and landmark), representing a 22% of its total area.
During the study period, the urban centre and the peri-urban area (Figure 6a, sectors A and B) present a compact built-up area with permanent land uses, basically due to the lack of available land to grow. In the interface between the peri-urban area and the limit of the municipality of Rome (Figure 6a, sectors B and C), there are maxima in the development of classes housing, and commercial and industrial around the ring road of Rome, balanced by the decrease in barren land in these sectors. In the rest of the municipalities (Figure 6a, sector D) there is a constant growth in housing and commercial areas in a uniform and scattered way, focused in the North-West and South-East directions (Figure 6b). Leisure areas have a punctual growth in this sector due to the development of a large facility in the North-East, compensated by a barren land decrease in the same direction. Barren land areas also increased in this sector due to agricultural changes. This can be considered as a transition class between agricultural land use and housing, this is the reason why its absolute area value of change is balanced for this period.
The LULC change matrix in Table 2 represents the changes per class for the period 2006-2012. This shows that the principal land uses that contribute to the increase of housing, commercial, and leisure areas are agricultural, barren land, and forest.
According to the results obtained from LEI index for the total area of study, the expansion process has been mainly edge-expansive and outlying (Figure 7). Considering the compact growth as a combination of infilling and edge-expansive growth, and the fragmented growth as outlying, then the urban expansion in the province of Rome tends to grow mainly compacted, making the urban cover more continuous, as introduced in the analysis of fragmentation metrics.
Figure 5. Study area divided by sectors with generic change patches in red. (A) Urban centre; (B) intermediate peri-urban
Considering the same index applied independently to the administrative objects, the type of growth per municipality or district can be interpreted for the different land uses. Figure 8 shows the housing AWMEI index per administrative object and the PC ratio of housing, providing information about the type and the amount of change, respectively, for this class.
Low AWMEI values indicate a sprawled development, while high values suggest compacted tendency in housing growth. In Figure 8, the dot symbol size is proportional to the amount of change per unit area. Thus, there is a compact growth in zone D, especially in the South-East, this could be related to the fact that urban areas are being developed around the municipality of Rome, due to the lack of available land in zone A. This makes a polycentric type of growth in the city.
Concurrently, the PC index shows that municipalities with a higher relative value of change in the first level (urban areas), located in the North, South-East, East, and centre (peripheral districts of Rome), are the same as those previously obtained and mentioned in the fragmentation analysis. Regarding the class housing, the new patches are mainly located in the North and East of zone D.
In an attempt to relate the fragmentation and multi-temporal metrics to the population data, two preliminary tests were
applied. First, two multiple regression models of the density of population in the two dates in the different municipalities, using urban fragmentation metrics from each date as independent variables, were studied. After applying stepwise regression, an adjusted = 74.5% and a standard error of 234.9 was obtained for 2006, using the indices Urban Density, Shannon Diversity, and Edge Contrast Ratio in the model. For 2012 the model included the metrics Urban Density, Shannon Diversity, Weighted Standard Distance, Euclidean Nearest Neighbour Mean Distance, and Edge Contrast Ratio, obtaining an adjusted
Area in 2012 (ha)
LULC Agricultural Water Forest Commercial Barren Leisure Roads Housing Total
A
rea
in
2
0
0
6
(h
a)
Agricultural 235450.00 7.04 7.06 1141.47 1664.56 187.53 65.02 1287.76 239810.4
Water - 7886.08 - - 15.14 - - - 7901.2
Forest - - 106121 65.53 32.89 17.25 - 150.45 106387.1
Commercial 17.34 - - 20852.80 24.42 1.99 1.81 1.81 20900.1
Barren 518.33 33.55 - 385.40 3561.67 164.77 61.04 636.97 5361.7
Leisure - - - 20.82 44.57 8410.57 3.19 41.95 8521.0
Roads 2.43 - - 2.59 6.85 0.18 15802.40 0.08 15814.5
Housing - - - 4.34 4.35 0.01 3.92 61661.10 61673.7
Total 235988.08 7926.67 106128.05 22472.95 5354.45 8782.29 15937.37 63780.11 466370
Table 2. LULC Change matrix for the time period 2006-2012
Figure 6. (a) Variation in area of the most changing land uses, where x-axis represents the distance from the urban centre, and y-axis the total area of each land use (in hectares) in 2006 (blue) and 2012 (red). The discontinuous vertical lines delimit the concentric
zones A, B, C, and D. (b) Spatial orientation of the main changes in land uses, where the orientation corresponds to the sectors defined in Figure 4b, and the radius represents the area of change (in hectares) per land use
Figure 8. Housing AWMEI and PC at administrative level. High values of AWMEI mean growth compactness, while high values
of PC mean more density of change
= 72.4% and a standard error of 249.2. This test points the feasibility of using fragmentation metrics as estimator of population for a single date. However, applying the same methodology using the multi-temporal indices as independent variables to estimate the increase in the density of population, no significant relation was found. This seems to reflect that changes in housing land use and urban areas (first level) do not have a linear relation to the increase of the density of population. A partial explanation can be found in the lack of a more continuous series of data for these years. Figure 9 shows the evolution of population in the period studied. According to the statistics in the province of Rome (Iptsat, 2013), there was a continuous increase of population between 2001 and 2010 (Figure 9b), but the absolute increment value in the period studied (2006-2012) was very low, due to the punctual dramatic
decrease in 2010. Additionally, at municipality level there are some differences depending on the zone considered (Figure 9a). There is a decrease of the density of population in the municipality of Rome (urban and peri-urban centre), and less in the North-East of zone D. Besides, there is a general increase in the density of population in the boundary of zones C and D, in particular in the North-East and South-East locations.
The City Council of Rome approved in 2008 a new Master Plan for the Lazio region, creating new rules and guidelines to conduct its urban development during the next years. Some relevant aspects of the Plan were the promotion of decentralisation and polycentric development of the metropolitan area, the enhancement and redevelopment of abandoned parts of the city, and the creation of more services and urban facilities for the suburbs. These ideas seem to agree with some of the results obtained in this work, where some evidences of polycentric development and compact development have been pointed based on the interpretation of the urban metrics.
5. CONCLUSIONS
This study shows the potential of the analysis and interpretation of fragmentation metrics derived from LULC data for urban sprawl monitoring. First, the homogenisation of the data legend is an important processing step in order to preserve coherence and to avoid gross change detection errors.
The spatio-temporal characteristics of urban sprawl have been computed and the LULC dynamics and landscape patterns of Rome quantified for a period of six years, from 2006 to 2012.The new tool IndiFrag was successfully used for the extraction of urban fragmentation metrics, and enlarged with new multi-temporal indices. The LEI index allows for the classification of the new patches in three growth types: infilling, edge-expansion, and outlying. This is useful to assess the compactness and patterns of the urban sprawl in the municipalities and districts for each land use. In general, a compact growing process (infilling and edge-expansion types) was found, with the exception of class barren land. For the housing land use, a high and relatively compact growth in the North and South-East directions located in the outer limits of the municipality of Rome was found. The concentric and sector analysis and graphs allowed the detection of new patches and the main orientation of growing. The analysis of the change matrix showed that the changes to housing, commercial, and leisure areas come mainly from agricultural, barren land, and forest.
A linear relation between the density of population and some urban fragmentation metrics extracted at the level of municipalities was found. However, no relation was found between the multi-temporal indices and changes in the density of population, probably because of the lack sufficient data of population. This issue should be further explored with a more exhaustive set of population data, as well as with other sets of relevant socio-economic variables, such as the degree of poverty (Duque et al., 2015) and others.
In general, the observed growing patterns could be related with the policies derived from the application of the urban Master Plan of Rome approved in 2008, in terms of the polycentric trend of structural expansion and the relative compactness of urban growing.
Figure 9. (a) Change in the density of population from 2006 to 2012 (inhab/ ); and (b) population data (number of
The combination of remote sensing techniques for LULC mapping (e.g., the European Urban Atlas) and tools for the extraction and analysis of landscape metrics, such as IndiFrag, are shown to be efficient for the monitoring urban sprawl, based on this preliminary study. The revised methods provide objective metrics about the amount and type of urban change. This research highlights the potential of new multi-temporal LULC datasets, as the Urban Atlas, that will allow for the application of these methods for comparative analyses of the evolution of different urban areas. However, further research must be done in order to tune methods and tools for the semi-automatic analysis of these complex urban environments, and to create models to preview their future evolution, to be used in a better definition of plans and policies for a sustainable territorial development.
ACKNOWLEDGEMENTS
The authors are grateful for the intermediate Urban Atlas data provided by the European Environment Agency (EEA) pan-European and local components, in particular to the Project Manager of the Copernicus Land monitoring services.
REFERENCES
Copernicus, 2010. GMES/Copernicus Land Monitoring Services - The European Earth Observation Programme - Local Component http://land.copernicus.eu/local (September 2014).
Duque, J.C., Patino, J.E., Ruiz, L.A., Pardo-Pascual, J.E., 2015. Measuring intra-urban poverty using land cover and texture metrics derived from remote sensing data. Landscape and Urban Planning, 135, pp. 11-21.
European Commission, 2012. Soil Sealing. Science for Environment Policy. In-depth Reports http://ec.europa.eu/-environment/archives/ (January 2015).
EEA, 2011. Analysing and managing urban growth. European Environment Agency. http://www.eea.europa.eu/articles/-analysing-and-managing-urban-growth (January 2015).
GADM, 2011. Database of Global Administrative Areas, Version 2.0 http://www.gadm.org/ (December 2014).
Godone, D., Garbarino, M., Sibona, E., Garnero, G., Godone, F., 2014. Progressive fragmentation of a traditional Mediterranean landscape by hazelnut plantations: The impact of CAP over time in the Langhe region (NW Italy). Land Use Policy, 36, pp. 259-266.
Hermosilla, T., Ruiz, L.A., Recio, J.A., Cambra-López, M., 2012. Assessing contextual descriptive features for plot-based classification of urban areas. Landscape and Urban Planning, 106 (1), pp. 124-137.
Iptsat, 2013. Confini dei Municipi di Roma Capitale - dataset open http://www.iptsat.com/IT/openData.php (December 2014).
Jing, W., Jianzhong, L., 2011. Study on the Urban Expansion and Model of Lianyungang City Based on the Multi-temporal Remote Sensing Images. Procedia Environmental Sciences, 10, pp. 2159-2164.
Lausch, A., Herzog, F., 2002. Applicability of landscape metrics for the monitoring of landscape change: issues of scale, resolution and interpretability. Ecological Indicators, 2 (1-2), pp. 3-15.
Liu, X., Li, X., Chen, Y., Tan, Z., Li, S., Ai, B., 2010. A new landscape index for quantifying urban expansion using multi-temporal remotely sensed data. Landscape Ecology, 25(5), pp. 671-682.
Malaviya, S., Munsi, M., Oinam, G., Joshi, P.K., 2010. Landscape approach for quantifying land use land cover change (1972–2006) and habitat diversity in a mining area in Central India (Bokaro, Jharkhand). Environmental Monitoring and Assessment, 170 (1-4), pp. 215-229.
Meirich, S., 2008. Mapping Guide for a European Urban Atlas. GSE Land Information Services, (1), pp.1-36.
Pan, W., Xy, H., Chen, H., Zhang, C., Chen, J., 2011. Dynamics of Land Cover and Land Use Change in Quanzhou City of SE China from Landsat Observations. Electrical Engineering and Control LNEE, 98, pp. 1019-1027.
Ruiz, V., Savé, R., Herrera, A., 2013. Análisis multitemporal del cambio de uso del suelo, en el Paisaje Terrestre Protegido Miraflor Moropotente Nicaragua, 1993 – 2011. Ecosistemas, 22 (3), pp. 117-123.
Sapena, M., Ruiz, L.A., 2015. Descripción y cálculo de índices de fragmentación urbana: Herramienta IndiFrag. Revista de Teledetección (in press).
Sun, C., Wu, Z.F., Lv, Z.Q., Yao, N., Wei, J.B., 2013. Quantifying different types of urban growth and the change dynamic in Guangzhou using multi-temporal remote sensing data. International Journal of Applied Earth Observation and Geoinformation, 21, pp. 409-417.
Tian, G., Jiang, J., Yang, Z., Shang, Y., 2011. The urban growth, size distribution and spatio-temporal dynamic pattern of the Yangtze River Delta megalopolitan region, China. Ecological Modelling, 222 (3), pp. 865-878.
Tian, Y., Yin, K., Lu, D., Hua, L. Zhao, Q., Wen, M., 2014. Examining Land Use and Land Cover Spatiotemporal Change and Driving Forces in Beijing from 1978 to 2010. Remote changes of Shanghai metropolitan area during the transitional economy (1979-2009) in China. Environmental Monitoring and Assessment, 177 (1-4), pp. 609-621.