PERHUBUNGAN, KOMUNIKASI DAN PARIWISATA
TRANSPORATION, COMMUNICATION AND TOURISM
Transportation, Communication and Tourism BAB VIII
PERHUBUNGAN, KOMUNIKASI DAN PARIWISATA
CHAPTER VIII TRANSPORTATION, COMMUNICATION AND TOURISM
8.1. Angkutan Darat
Jalan dan jembatan merupakan prasarana mutlak untuk memperlancar kegiatan perekonomian suatu daerah. Jalan dan jembatan dibutuhkan untuk meningkatkan mobilitas penduduk maupun perdagangan barang antar wilayah.
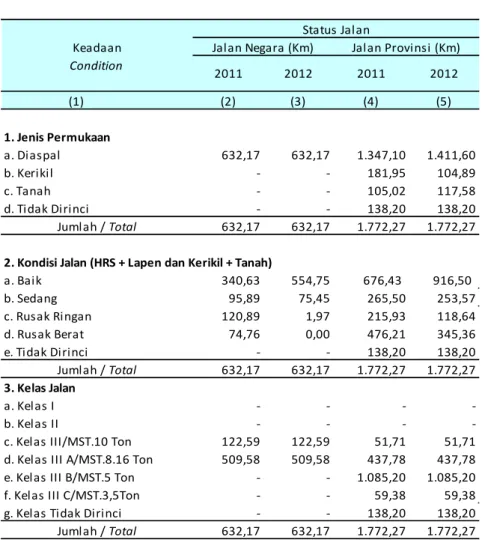
Panjang jalan nasional dan Provinsi di NTB sampai akhir 2012 mencapai 2.404.44 km.
Berdasarkan klasifikasi jalan, 632,17 km merupakan jalan nasional dan 1.772,27 km merupakan jalan Provinsi. Dilihat dari kondisi jalan tersebut, jalan yang kondisinya baik mencapai 45,61 persen dengan kelas jalan adalah Kelas III.
Jumlah jembatan Negara dan jembatan provinsi pada tahun 2012 mencapai 1.327 buah dengan panjang mencapai 21.203 meter.
Jumlah kendaraan bermotor tahun 2012 sebanyak 1.116.744
8.2. Land Transportation
Roads and bridges are essential infrastructure to facilitate economic activities of a region.
Roads and bridges are needed to improve the mobility of people and trade goods between regions.
The length of national roads and in NTB province until the end of 2012 reached 2474.5 km. Based on the classification of roads, 632.17 km are national roads and 1772.27 km are provincial roads.
Seen from the road conditions, road conditions are good reach 45.61 percent by road class is Class III.
State the number of bridges and bridge the province in 2012 reached 1327 pieces with a length reaching 21,203 m.
The number of motor vehicles by 2012 as many as 1,116,744 units, an increase of 14.11 percent from the previous year which reached 978,694 units.
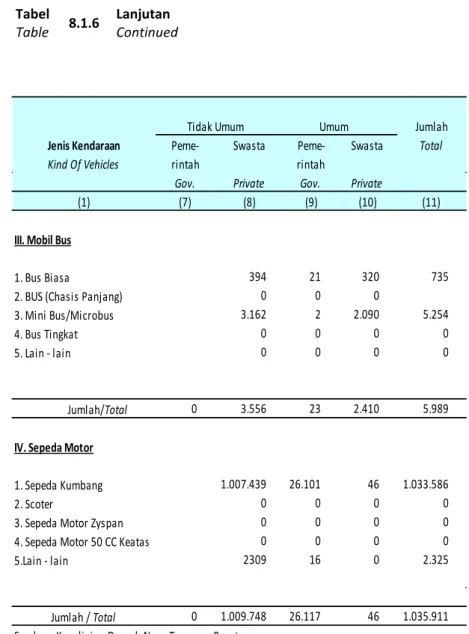
Transportation, Communication and Tourism mencapai 978.694 unit. komposisi jumlah kendaraan bermotor terdiri dari : 46.466 unit mobil penumpang, 5.989 unit bus, 28.378 unit mobil barang, dan 1.035.911 unit sepeda motor.
passenger cars, 5,989 buses, 28,378 goods vehicles, and 1,035,911 units of motorcycles.
8.2. Angkutan Udara
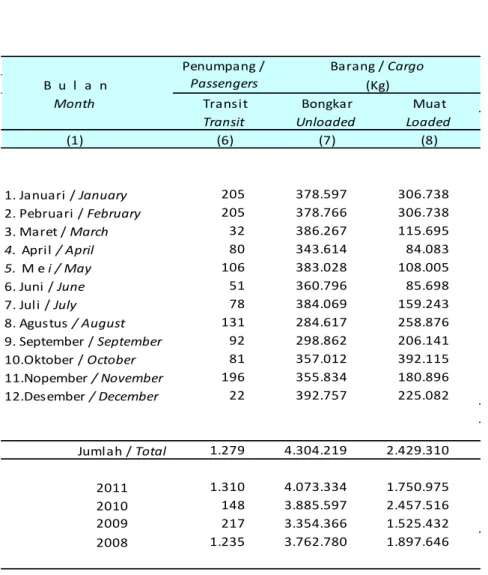
Jumlah penumpang yang datang, berangkat, dan transit di Bandara Internasional Lombok pada tahun 2012 masing-masing sebanyak 858.710, 876.726 dan 1.279 orang. Kondisi tersebut menunjukkan jumlah orang yang berkunjung ke NTB lebih besar dari tahun 2011. dan pada dua bandara lain di NTB, yaitu Bandara Brang Biji di Sumbawa dan Bandara Salahuddin di Bima, menunjukan adanya kenaikan terutama pada jumlah penumpang.
Frekuensi penerbangan pada 3 (tiga) pelabuhan udara di Provinsi NTB terus mengalami peningkatan. Pada Bandara Selaparang, Bandara Salahudin dan Bandara Brang Biji jumlah penerbangan dari masing-masing bandara tersebut pada tahun 2012 adalah 10.088 penerbangan ;
8.2. Air Transportation
The number of passengers who came, left, and transit at the Internasional Lombok airport in 2012 respectively as many as 858,710, 876,726 and 1,279 people. These conditions indicate the number of people who visit the NTB is larger than year 2011. and in two other airports in the NTB, the Brang Biji Airport in Sumbawa and Bima Airport in Salahuddin, showed a inline primarily on the number of passengers.
Frequency of flights on 3 (three) airports in the province continues to increase. In Internasional Lombok Airport, M.
Salahudin airport and Brang Biji airport number of flights from each airport in 2012 was 10,088 flights;
1,353 flights and; 740 flights.
Transportation, Communication and Tourism
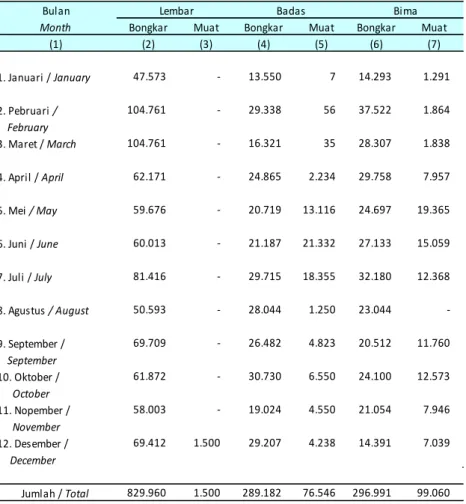
8.3. Angkutan Laut
Angkutan laut telah me- mainkan peranan penting di NTB.
Berdasarkan data dari pelabuhan Lembar, terlihat bahwa pelabuhan tersebut selain melayani bongkar muat barang/ternak yang terinci menurut jenis barang strategis, yaitu: bahan pokok, strategis, migas dan non migas, juga melayani angkutan penumpang.
Hal demikian juga terjadi di Pelabuhan Badas dan Bima.
Jumlah kunjungan kapal tahun 2012 di Pelabuhan Lembar sebanyak 46 kali kunjungan kapal luar negeri dan 3.560 kali kunjungan kapal dalam negeri.
Sementara itu di Pelabuhan Badas terdapat 64 kali kunjungan kapal luar negeri dan 651 kali kunjungan kapal dalam negeri. Sedangkan di Pelabuhan Bima hanya terdapat kunjungan kapal dalam negeri sebanyak 1.056 kali.
8.3. Sea Transportation
Sea transport have played an important role in NTB. Based on data from the port sheet, it appears that in addition to serving the ports of loading and unloading of goods / livestock are detailed by type of strategic goods, namely:
basic materials, strategic, and non- oil and gas, as well as passenger transportation service. It so happened at the Port Badas and Bima.
The number of ship visits in 2012 at Lembar Harbour as many as 46 times the visit of foreign ships and 3,560 visits to the ship in the country. Meanwhile in Badas Port there are 64 times the visits of foreign ships and 651 times the visit of the ship in the country.
While in port the ship visits Bima found only in the country as much as 1,056 times.
8.4. Hotel dan Pariwisata 8.4. Hotel and Tourism
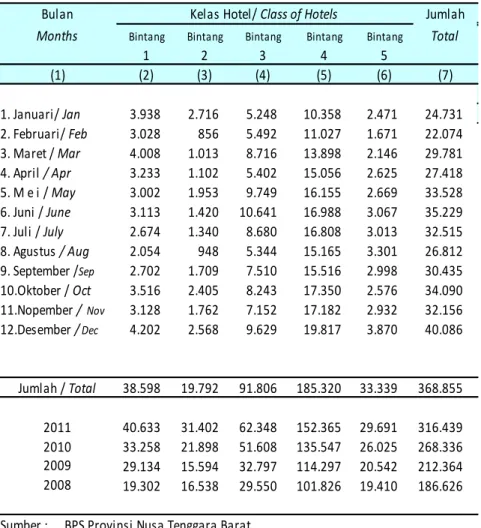
Transportation, Communication and Tourism hasil yang terus meningkat. Hal tersebut terlihat dengan meningkatnya jumlah wisatawan yang datang. Jumlah Tamu Asing maupun Tamu Domestik yang menginap di Hotel berbintang pada tahun 2012 mencapai 368.855 orang atau meningkat 16,56 persen.
Sejalan dengan
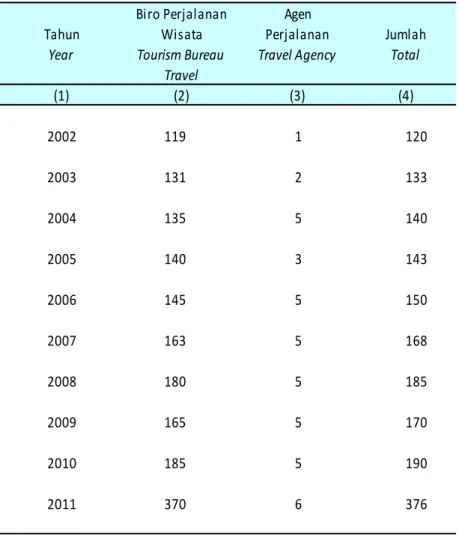
meningkatnya wisatawan yang berkunjung, NTB dituntut untuk memperbanyak akomodasi, termasuk pula kamar dan tempat tidur hotel . Data menunjukkan bahwa jumlah hotel di NTB tahun 2012 sebanyak 784 unit, terdiri dari 40 hotel berbintang dan 744 hotel melati. Selengkapnya bisa dilihat pada tabel 8.4.1. – 8.4.6.
increasing results. This is evident with the increasing number of tourists coming. Number of Guests Domestic and Foreign Guests staying at a five-star hotel in the year 2012 reached 368,855 people or 16,56 percent increase.
In line with the increase of tourists visiting, NTB is required to increase the accommodation, including all rooms and hotel beds.
Data show that the number of hotels in NTB in 2012 as many as 784 units, consisting of 40 five-star hotels and 744 hotel jasmine. More can be seen in Table 8.4.1. - 8.4.6.
8.5. Pos dan Telekomunikasi
Dengan berkembangnya tehnologi, kegiatan pos terus mengalami penurunan. Kegiatan pos lebih menitik beratkan kegiatannya kepada ekspedisi atau pengiriman barang.
Demikian pula pada
8.5. Postal and Telecommunication
With growing technology, postal activity continued to decline. Postal activities more focused activities to the expedition or the delivery of goods.
Similarly, the activities of PT.
Telkom on the use of mobile homes
Transportation, Communication and Tourism kurang mengalami peningkatan
atau bahkan terjadi penurunan.
Kinerja PT Telkom malah mengarah pada penggunaan internet dengan produk sppedy.
Penurunan ini kemungkinan besar disebabkan karena banyaknya pesaing dari operator seluler.
fact lead to the use of the internet with products sppedy. The decline was most likely caused because of the many competitors from mobile operators.
NUSA TENGGARA BARAT DALAM ANGKA
8.1
ANGKUTAN DARATLAND TRANSPORTATION
Transportation, Communication and Tourism Tabel
Table 8.1.1 Panjang Jalan Menurut Keadaan dan Status 2011-2012 Length of Road by Condition Ability and Status 2011-2012
(1) (2) (3) (4) (5)
1. Jenis Permukaan
a. Diaspal 632,17 632,17 1.347,10 1.411,60
b. Kerikil - - 181,95 104,89
c. Tanah - - 105,02 117,58
d. Tidak Dirinci - - 138,20 138,20
632,17 632,17 1.772,27 1.772,27
2. Kondisi Jalan (HRS + Lapen dan Kerikil + Tanah)
a. Baik 340,63 554,75 676,43 916,50
b. Sedang 95,89 75,45 265,50 253,57
c. Rusak Ringan 120,89 1,97 215,93 118,64
d. Rusak Berat 74,76 0,00 476,21 345,36
e. Tidak Dirinci - - 138,20 138,20
632,17 632,17 1.772,27 1.772,27 3. Kelas Jalan
a. Kelas I - - - -
b. Kelas II - - - -
c. Kelas III/MST.10 Ton 122,59 122,59 51,71 51,71
d. Kelas III A/MST.8.16 Ton 509,58 509,58 437,78 437,78
e. Kelas III B/MST.5 Ton - - 1.085,20 1.085,20
f. Kelas III C/MST.3,5Ton - - 59,38 59,38
g. Kelas Tidak Dirinci - - 138,20 138,20
632,17 632,17 1.772,27 1.772,27 Sumber : Dinas Pekerjaan Umum Provinsi NTB
Jumlah / Total
Jumlah / Total Condition
2011 2012 2011 2012
Jumlah / Total
Status Jalan
Keadaan Jalan Negara (Km) Jalan Provinsi (Km)
Transportation, Communication and Tourism Tabel
Table 8.1.2
Jumlah Dan Kondisi Jembatan Di Provinsi Nusa Tenggara Barat 2012
Number And Condition of Bridge at Nusa Tenggara Barat Province 2012
Keadaan
Condition Jumlah Panjang Jumlah Panjang Jumlah Panjang (m)
(1) (2) (3) (4) (5) (6) (7)
1. Jembatan Negara
a. Beton 87 387,25 201 2.493,26 288 2.880,51
b. Composit 2 10,30 29 552,70 31 563,00
c. Rangka Baja - - 22 1.199,70 22 1.199,70
d. Gelagar Baja Lantai Kayu - - - - - -
e. Gelaga Baja Lantai Seng - - - - - -
f. Baja Gantung - - 2 174,70 2 174,70
g. Lintasan Basah - - - - - -
Jumlah / Total 89 397,55 254,00 4.420,36 343,00 4.817,91 2. Jembatan Provinsi
a. Beton 233 921,10 501 7.067,60 734 7.988,70
b. Composit 4 16,10 32 811,20 36 827,30
c. Rangka Baja - - 38 2.018,30 38 2.018,30
d. Gelagar Baja Lantai Kayu - - - - - -
e. Gelaga Baja Lantai Seng - - - - - -
f. Baja Gantung - - - - - -
g. Lintasan Basah 1 5,00 175 5.545,90 176 5.550,90
Jumlah / Total 238 942,20 746 15.443,00 984,00 16.385,20 Sumber : Dinas Pekerjaan Umum Provinsi NTB
Jumlah Bentang>6 Meter
Bentang<6 Meter
Transportation, Communication and Tourism Tabel
Table 8.1.3
Banyaknya Kendaraan Bermotor Tercatat Menurut Kabupaten / Kota dan Jenis Kendaraan 2012
Number of Vehicles Registered by Regency/Municipality and Kind of Vehicles 2012
Mobil Pe- Mobil Bus Sepeda Jumlah
numpang Barang Buses Motor Total
Passenger Trucks Motor
Cars Cycle
(2) (3) (4) (5) (6)
1. Polda NTB 46.466 28378 5989 1035911 1.116.744
2. Lombok Barat *) … … … … …
3. Lombok Tengah … … … … …
… … … … …
4. Lombok Timur … … … … …
… … … … …
5. Sumbawa … … … … …
… … … … …
6. Dompu … … … … …
… … … … …
7. Bima … … … … …
… … … … …
8. Sumbawa Barat … … … … …
9. Kota Mataram … … … … …
10. Kota Bima *) … … … … …
46.466 28.378 5.989 1.035.911 1.116.744
2011 35.421 25.535 2.202 915.536 978.694
2010 32.581 32.320 4.558 808.491 877.950
2009 28.998 26.043 12.576 708.246 775.863
2008 24.601 25.870 8.570 569.426 628.467
Sumber : Kepolisian Daerah Nusa Tenggara Barat Source The Regional Police of Nusa Tenggara Barat Catatan / Notes : *) Belum ada Samsatnya
Regency / Kabupaten/Kota
Jumlah / Total Municipality
(1)
Transportation, Communication and Tourism Tabel
Table 8.1.4
Banyaknya Pelanggaran Lalu Lintas Menurut Kabupaten / Kota 2012
Number of Traffic Violations by Regency/Municipality 2012
Tilang Non Tilang Jumlah
Fined Non Total
Fined
(2) (3) (4)
1. Polda NTB 3.896 0 3.896
2. Lombok Barat 8.248 1.652 9.900
3. Lombok Tengah 11.859 2.235 14.094
4. Lombok Timur 8.197 293 8.490
5. Sumbawa 7.675 6.335 14.010
6. Dompu 4.356 0 4.356
7. Bima 5.170 3.150 8.320
8. Sumbawa Barat 7.973 1.350 9.323
9. Kota Mataram 18.829 4.230 23.059
10. Kota Bima 8.056 14.992 23.048
Jumlah / Total 84.259 34.237 118.496
2011 77.088 2.289 79.377
2010 39.972 4.498 44.470
2009 39.358 2.966 42.324
2008 51.550 1.465 40.996
Sumber : Kepolisian Daerah Nusa Tenggara Barat Source The Regional Police of Nusa Tenggara Barat
Regency / Kabupaten/Kota
Municipality (1)
Transportation, Communication and Tourism Tabel
Table 8.1.5
Banyaknya Kecelakaan Lalu Lintas dan Kerugian Materi Menurut Kabupaten / Kota 2012
Number of Traffic Accident and Material Loss by Regency / Municipality 2012
Kejadian Meninggal Luka Luka Material Accident Dunia Berat Ringan Material
Death Serious Slightly Loss Injured Injured ( 000 )
(2) (3) (4) (5) (6)
1. Lombok Barat 403 130 117 489 845.350.000
2. Lombok Tengah 251 73 192 267 442.600.000
3. Lombok Timur 484 68 53 624 515.650.000
4. Sumbawa 281 65 141 282 809.150.000
5. Dompu 59 19 28 75 254.000.000
6. Bima 125 35 75 62 163.730.000
7. Sumbawa Barat 76 17 54 85 289.450.000
8. Kota Mataram 224 53 94 187 160.150.000
9. Kota Bima 89 29 73 18 86.700.000
Jumlah / Total 1.992 489 827 2.089 3.566.780.000
2011 2.132 504 838 2.233 4.178.650.000
2010 971 458 358 890 2.096.300.000
2009 762 432 434 702 1.657.935.000
2008 561 271 267 460 868.075.000
Sumber : Kepolisian Daerah Nusa Tenggara Barat Source The Regional Police of Nusa Tenggara Barat
Regency / Kabupaten/Kota
Municipality (1)
Transportation, Communication and Tourism Tabel
Table 8.1.6
Banyaknya Kendaraan Bermotor Tercatat Menurut Jenis Kendaraan 2012
Number of Vehicles Registered by Kind of Vehicles 2012
Peme- Swasta Peme- Swasta Jumlah
rintah rintah Total
Gov. Private Gov. Private
(2) (3) (4) (5) (6)
I. Mobil Penumpang
1. Sedan 4.360 78 744 5.182
2. Jeep 4.705 474 393 5.572
3. Sation Wagon 16.256 3.111 373 19.740
4. Subur Ban 0 0 0 0
5. Combi 0 0 0 0
6. Minicab 9.925 546 4.373 14.844
7. Kend Roda Tiga 0 0 0 0
8. Lain-lain 322 432 370 1.124
Jumlah/Total 35.568 4.641 6.253 46.462
II. Mobil Beban
1. Truck Barang 5.922 836 12.196 18.954
2. Truck Contationer 0 0 0 0
3. Truck Trailer 0 0 0 0
4. Truck derek 0 0 0 0
5. Truck Tangki/BBM 7 2 24 33
6. Truck Pemadam Api 37 32 10 79
7. Truck Trator 0 0 0 0
8. Pick Up 7.893 53 771 8.717
9. Ambulance 4 33 0 37
10.Mobil Jenazah 12 1 0 13
11.Lain - lain 153 747 28 928
14.028 1.704 13.029 28.761
Tidak Umum Umum
Jenis Kendaraan Kind Of Vehicles
Jumlah / Total (1)
Transportation, Communication and Tourism Tabel
Table 8.1.6 Lanjutan Continued
Tidak Umum Umum Jumlah Peme- Swasta Peme- Swasta Total
rintah rintah
Gov. Private Gov. Private
(7) (8) (9) (10) (11)
III. Mobil Bus
1. Bus Biasa 394 21 320 735
2. BUS (Chasis Panjang) 0 0 0
3. Mini Bus/Microbus 3.162 2 2.090 5.254
4. Bus Tingkat 0 0 0 0
5. Lain - lain 0 0 0 0
0 3.556 23 2.410 5.989
IV. Sepeda Motor
1. Sepeda Kumbang 1.007.439 26.101 46 1.033.586
2. Scoter 0 0 0 0
3. Sepeda Motor Zyspan 0 0 0 0
4. Sepeda Motor 50 CC Keatas 0 0 0 0
5.Lain - lain 2309 16 0 2.325
0 1.009.748 26.117 46 1.035.911 Sumber : Kepolisian Daerah Nusa Tenggara Barat
Jenis Kendaraan Kind Of Vehicles
Jumlah/Total
Jumlah / Total (1)
Transportation, Communication and Tourism Tabel
Table 8.1.7
Jumlah Pelaku Kecelakaan Lalulintas Menurut Pendidikan Yang Ditamatkan 2012
Number of Traffic Accident Subject by Education 2012
Jumlah SD SLTP SLTA PT Lain-lain Total
(2) (3) (4) (5) (6)
1. Polres Lobar 103 240 6 9 19 377
2. Polres Loteng 27 50 137 23 1 238
3. Polres Lotim 76 166 161 33 13 449
4. Polres Sumbawa 3 42 181 3 0 229
5. Polres Dompu 4 10 33 1 5 53
6. Polres Kota Bima 5 17 45 10 1 78
7. Polres Bima 0 15 62 18 13 108
8. Polres Sumbawa Barat 5 15 49 3 0 72
9. Polres Mataram 0 10 165 24 0 199
223 565 839 124 52 1.803
Sumber : Kepolisian Daerah Nusa Tenggara Barat Jumlah / Total
(1)
Kesatuan Pendidikan Yang Ditamatkan Unit
Transportation, Communication and Tourism Tabel
Table 8.1.8
Jumlah Pelaku Kecelakaan Lalulintas Menurut Kelompok Umur 2012
Number of Traffic Accident Subject by Group of Age 2012
Jumlah/
Kesatuan 5-15 16-21 22-30 31-40 41-50 Total
(2) (3) (4) (5) (6) (7) (8)
1. Polres Lobar 15 146 83 70 41 22 377
2. Polres Loteng 14 103 39 44 22 16 238
3. Polres Lotim 33 206 100 64 27 19 449
4. Polres Sumbawa 14 14 60 72 45 24 229
5. Polres Dompu 4 18 8 18 2 3 53
6. Polres Bima 6 30 29 23 15 5 108
7. Polres Sumbawa Barat 4 24 13 12 11 8 72
8. Polres Mataram 11 57 57 35 27 12 199
9. Polres Kota Bima 6 29 20 14 7 2 78
107 627 409 352 197 111 1.803
Sumber : Kepolisian Daerah Nusa Tenggara Barat Jumlah / Total
(1)
Kelompok Umur Pelaku
51 Keatas
Transportation, Communication and Tourism Tabel
Table 8.1.9
Jumlah Pelaku Kecelakaan Lalulintas Menurut Golongan SIM 2012
Number of Traffic Accident Subject by Type of Driving License 2012
Kesatuan Tidak
A AU BI BIU BII BIIU C Punya
SIM
(2) (3) (4) (5) (6) (7) (8) (9)
1. Polres Lobar 24 2 4 19 0 3 57 268
2. Polres Loteng 13 4 2 19 1 1 35 163
3. Polres Lotim 10 2 1 16 0 2 44 374
4. Polres Sumbawa 9 0 4 16 1 4 41 154
5. Polres Dompu 3 0 2 5 0 0 11 32
6. Polres Bima 2 0 0 15 0 0 56 35
7. Polres Sumbawa Barat 3 0 1 6 0 2 21 39
8. Polres Mataram 12 2 3 6 0 0 62 114
9. Polres Kota Bima 3 2 2 4 0 0 21 46
79 12 19 106 2 12 348 1.225
Sumber : Kepolisian Daerah Nusa Tenggara Barat
Golongan SIM yang Dimiliki
Jumlah / Total (1)
Transportation, Communication and Tourism Tabel
Table 8.1.10
Jumlah Korban Kecelakaan Lalu Lintas dan Kerugian Materi Yang Diderita Menurut Kesatuan 2012
Number of Traffic Accident and Material Loss by Corps 2012
Kecelakaan
Karena Luka Luka Material
Tabrakan Berat Ringan (000 Rp)
(2) (3) (4) (5) (6)
1. Polres Lobar 403 130 117 489 845.350.000
2. Polres Loteng 251 73 192 267 442.600.000
3. Polres Lotim 484 68 53 624 515.650.000
4. Polres Sumbawa 281 65 141 282 809.150.000
5. Polres Dompu 59 19 28 75 254.000.000
6. Polres Bima 125 35 75 62 163.730.000
7. Polres Sumbawa Barat 76 17 54 85 289.450.000
8. Polres Mataram 224 53 94 187 160.150.000
9. Polres Kota Bima 89 29 73 18 86.700.000
1.992 489 827 2.089 3.566.780.000 Sumber : Kepolisian Daerah Nusa Tenggara Barat
Jumlah / Total (1)
Kesatuan Mati
Unit
Korban
Transportation, Communication and Tourism Tabel
Table 8.1.11
Jumlah Pelanggaran Lalulintas Menurut Jenis Kelamin 2012
Number Of Traffic Violation by Sex 2012
Jumlah Jenis Kelamin
Pelang- Laki-laki Perempuan Jumlah
garan Male Female Total
(2) (3) (4) (5)
1. POLDA NTB 3.896 3.200 696 3.896
2. Polres Lobar 8.248 7.622 626 8.248
3. Polres Loteng 11.859 9.820 2.039 11.859
4. Polres Lotim 8.197 6.224 1.973 8.197
5. Polres Sumbawa 7.675 5.312 2.363 7.675
6. Polres Dompu 4.356 2.714 1.642 4.356
7. Polres Bima 5.170 3.710 1.460 5.170
8. Polres Sumbawa Barat 7.973 5.706 2.267 7.973
9. Polres Mataram 18.829 14.247 4.582 18.829
10. Polres Kota Bima 8.056 6.396 1.660 8.056
84.259 64.951 19.308 84.259
Sumber : Kepolisian Daerah Nusa Tenggara Barat Unit
Kesatuan
(1)
Jumlah / Total
Transportation, Communication and Tourism Tabel
Table 8.1.12
Jumlah Pelanggaran Lalulintas Menurut Jenis Pelanggaran 2012
Number Of Traffic Violation by Type of Violation 2012 Jumlah
Jenis Pelanggaran
Pelang- Mua- Kece - Marka Surat Perleng Lain Jumlah garan tan patan Rambu Surat kapan lain Total
(2) (3) (4) (5) (6) (7) (8) (9)
1. POLDA NTB 3.896 39 29 1.725 281 1.822 3.896
2. Polres Lobar 8.248 20 21 4.488 1.216 2.503 8.248 3. Polres Loteng 11.859 8 136 4.239 1.006 6.470 11.859
4. Polres Lotim 8.197 4 7 2.830 461 4.895 8.197
5. Polres Sumbawa 7.675 1 140 2.527 1.469 3.538 7.675
6. Polres Dompu 4.356 28 64 914 843 2.507 4.356
7. Polres Bima 5.170 17 0 1.845 1.279 2.029 5.170
8. Polres Sumbawa Barat 7.973 2 3 4.408 1.347 2.213 7.973 9. Polres Mataram 18.829 2 3 906 8.007 1.550 8.361 18.829 10. Polres Kota Bima 8.056 2 3 594 1.671 1.101 4.685 8.056
84.259 123 6 1.900 32.654 10.553 39.023 84.259
Sumber : Kepolisian Daerah Nusa Tenggara Barat Source The Regional Police of Nusa Tenggara Barat
Jumlah / Total (1) Unit Kesatuan
Transportation, Communication and Tourism Tabel
Table 8.1.13
Jumlah Pelanggaran Lalulintas Menurut Jenis Kendaraan Yang Digunakan 2012
Number Of Traffic Violation by Type of Vehicle 2012
Bus Truck Ang- Pri- Taxi Pick Jumlah
kot badi Up Total
(2) (3) (4) (5) (6) (7) (8) (9)
1. POLDA NTB 0 40 173 0 0 3.668 15 3.896
2. Polres Lobar 26 25 97 0 0 8.056 44 8.248
3. Polres Loteng 0 11 68 0 0 11.755 25 11.859
4. Polres Lotim 3 10 19 0 0 8.143 22 8.197
5. Polres Sumbawa 21 38 13 0 0 7.571 32 7.675
6. Polres Dompu 4 0 35 0 0 4.286 31 4.356
7. Polres Bima 5 0 4 0 0 5.141 20 5.170
8. Polres Sumbawa Barat 141 50 118 0 0 7.502 162 7.973
9. Polres Mataram 1 29 245 0 0 18.527 27 18.829
10. Polres Kota Bima 0 1 31 0 0 8.018 6 8.056
201 204 803 0 0 82.667 384 84.259
Sumber : Kepolisian Daerah Nusa Tenggara Barat Source The Regional Police of Nusa Tenggara Barat
Jenis Kendaraan Yang Digunakan
Unit
Kesatuan Roda 2
(1)
Jumlah / Total
Transportation, Communication and Tourism Tabel
Table 8.1.14
Jumlah Pelanggaran Lalulintas Menurut Kelompok Umur 2012
Number Of Traffic Violation by Group of Age 2012
Jumlah
Pelang- 5-15 16-21 22-30 31-40 41-51 51 ke Jumlah
garan Atas Total
(2) (3) (4) (5) (6) (7) (8) (9)
1. POLDA NTB 3.896 348 1.394 1.398 703 53 0 3.896
2. Polres Lobar 8.248 306 5.609 1.443 708 182 0 8.248
3. Polres Loteng 11.859 601 8.192 2.536 518 12 0 11.859
4. Polres Lotim 8.197 0 5.218 2.171 703 105 0 8.197
5. Polres Sumbawa 7.675 685 4.528 1.477 767 218 0 7.675
6. Polres Dompu 4.356 438 1.292 1.679 670 277 0 4.356
7. Polres Bima 5.170 148 3.088 1.448 330 156 0 5.170
8. Polres Sumbawa Barat 7.973 500 1.029 4.209 1.735 500 0 7.973
9. Polres Mataram 18.829 852 4.515 8.622 2.849 1.991 0 18.829
10. Polres Kota Bima 8.056 1.453 5.501 1.032 70 0 0 8.056
Jumlah / Total
84.259 5.331 40.366 26.015 9.053 3.494 0 84.259
Sumber : Kepolisian Daerah Nusa Tenggara Barat Source The Regional Police of Nusa Tenggara Barat
Kelompok Umur Kesatuan
Unit (1)
Jumlah / Total
Transportation, Communication and Tourism Tabel
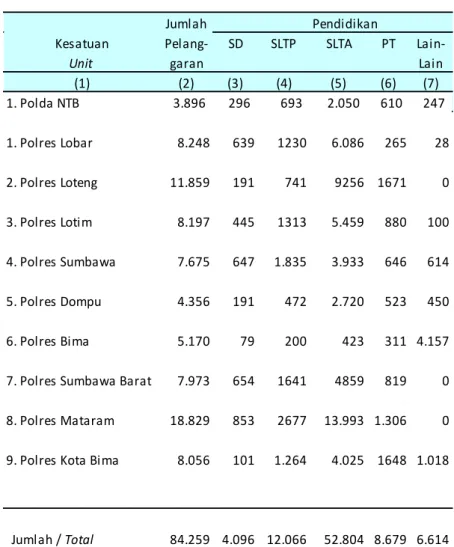
Table 8.1.15 Jumlah Pelanggaran Lalulintas Menurut Pendidikan 2012 Number Of Traffic Violation by Level of Education 2012
Jumlah
Jenis PelanggaranPendidikan Pelang- SD SLTP SLTA PT Lain-
garan Lain
(2) (3) (4) (5) (6) (7)
1. Polda NTB 3.896 296 693 2.050 610 247
1. Polres Lobar 8.248 639 1230 6.086 265 28
2. Polres Loteng 11.859 191 741 9256 1671 0
3. Polres Lotim 8.197 445 1313 5.459 880 100
4. Polres Sumbawa 7.675 647 1.835 3.933 646 614
5. Polres Dompu 4.356 191 472 2.720 523 450
6. Polres Bima 5.170 79 200 423 311 4.157
7. Polres Sumbawa Barat 7.973 654 1641 4859 819 0 8. Polres Mataram 18.829 853 2677 13.993 1.306 0 9. Polres Kota Bima 8.056 101 1.264 4.025 1648 1.018
Jumlah / Total 84.259 4.096 12.066 52.804 8.679 6.614
Sumber : Kepolisian Daerah Nusa Tenggara Barat Source The Regional Police of Nusa Tenggara Barat
Kesatuan Unit
(1)
Transportation, Communication and Tourism Tabel
Table 8.1.16
Jumlah Pelanggaran Lalulintas Menurut Golongan SIM Yang Dimiliki 2012
Number Of Traffic Violation by type of Driving License 2012
Tidak
A AU BI BIU BII BIIU C Punya
SIM (2) (3) (4) (5) (6) (7) (8) (9)
1. POLDA NTB 60 0 22 11 0 0 1.832 1.971
2. Polres Lobar 107 31 29 25 0 0 8.056 0
3. Polres Loteng 25 9 1 9 0 5 6.624 5.186
4. Polres Lotim 30 21 6 12 0 0 5.825 2.303
5. Polres Sumbawa 12 25 7 38 0 16 6.237 1.340
6. Polres Dompu 60 26 0 3 0 0 2.662 1.605
7. Polres Bima 18 18 0 19 0 10 3.293 1.812
8. Polres Sumbawa Barat 152 0 8 65 0 8 7.122 618
9. Polres Mataram 177 2 16 20 5 2 12.186 6.421
10. Polres Kota Bima 7 34 0 45 0 0 3.742 4.228
648 166 89 247 5 41 57.579 25.484
Sumber : Kepolisian Daerah Nusa Tenggara Barat Source The Regional Police of Nusa Tenggara Barat
Golongan SIM yang Dimiliki Kesatuan
Unit
Jumlah / Total (1)
Transportation, Communication and Tourism Tabel
Table 8.1.17
Jumlah Pelanggaran Lalulintas Menurut Profesi Pelaku 2012
Number Of Traffic Violation by Subjects Proffession 2012
Profesi Pelaku
PNS Swasta TNI/ Maha- Pe - Penge Lain POLRI siswa lajar mudi nya
Umum
(2) (3) (4) (5) (6) (7) (8)
1. POLDA NTB 235 1.701 0 920 860 0 180
2. Polres Lobar 306 5.935 0 833 901 11 262
3. Polres Loteng 1.094 7.695 0 1.070 1.961 13 26
4. Polres Lotim 551 4.836 0 1.161 1.432 38 179
5. Polres Sumbawa 545 4.124 0 688 1.398 6 914
6. Polres Dompu 934 1.985 0 234 721 106 376
7. Polres Bima 503 3.079 0 661 849 44 34
8. Polres Sumbawa Barat 456 4.981 0 534 2.000 0 2
9. Polres Mataram 916 9.630 1 4.831 3.451 0 0
10. Polres Kota Bima 722 3.359 0 1.653 2.228 16 78
6.262 47.325 1 12.585 15.801 234 2.051
Sumber : Kepolisian Daerah Nusa Tenggara Barat Source The Regional Police of Nusa Tenggara Barat
Jumlah / Total (1) Unit Kesatuan
NUSA TENGGARA BARAT DALAM ANGKA
8.2
ANGKUTAN UDARAAIR TRANSPORTATION
Transportation, Communication and Tourism Tabel
Table 8.2.1
Banyaknya Pesawat, Penumpang Dan Barang Melalui Bandar Udara Selaparang Mataram 2012
Number of Aircraft, Passengers and Freight Through Selaparang Airport Mataram 2012
Datang Berangkat Datang Berangkat Arrival Departure Arrival Departure
(2) (3) (4) (5)
1. Januari / January 798 801 65.651 69.271
2. Pebruari / February 823 826 66.638 70.283
3. Maret / March 793 792 66.522 67.774
4. April / April 807 807 68.143 69.539
5. M e i / May 744 744 68.528 68.427
6. Juni / June 800 800 74.747 72.806
7. Juli / July 766 768 72.503 70.012
8. Agustus / August 801 803 71.419 70.070
9. September / September 776 796 65.340 71.416
10.Oktober / October 867 866 74.220 79.054
11.Nopember / November 1.035 1.031 78.566 81.670
12.Desember / December 1.078 1.091 86.433 86.404
10.088 10.125 858.710 876.726
2011 9.144 9.175 804.367 843.151
2010 7.066 7.066 676.889 701.664
2009 6.511 6.731 703.644 584.818
2008 6.511 6.488 528.331 524.855
Jumlah / Total B u l a n
Month (1)
Penumpang/Passengers Pesawat/Aircraft
Transportation, Communication and Tourism Tabel
Table 8.2.1 Lanjutan Continued
Transit Bongkar Muat
Transit Unloaded Loaded
(6) (7) (8)
1. Januari / January 205 378.597 306.738
2. Pebruari / February 205 378.766 306.738
3. Maret / March 32 386.267 115.695
4. April / April 80 343.614 84.083
5. M e i / May 106 383.028 108.005
6. Juni / June 51 360.796 85.698
7. Juli / July 78 384.069 159.243
8. Agustus / August 131 284.617 258.876
9. September / September 92 298.862 206.141
10.Oktober / October 81 357.012 392.115
11.Nopember / November 196 355.834 180.896
12.Desember / December 22 392.757 225.082
Jumlah / Total 1.279 4.304.219 2.429.310
2011 1.310 4.073.334 1.750.975
2010 148 3.885.597 2.457.516
2009 217 3.354.366 1.525.432
2008 1.235 3.762.780 1.897.646
B u l a n Month
(Kg)
(1)
Penumpang / Passengers
Barang / Cargo
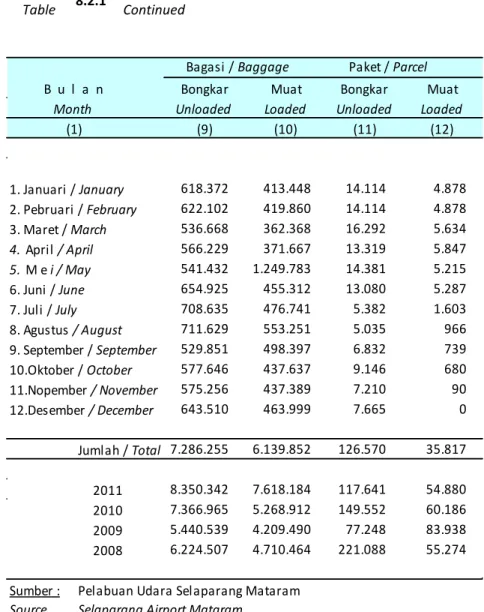
Transportation, Communication and Tourism Tabel
Table 8.2.1 Lanjutan Continued
Bagasi / Baggage Paket / Parcel
Bongkar Muat Bongkar Muat
Unloaded Loaded Unloaded Loaded
(9) (10) (11) (12)
1. Januari / January 618.372 413.448 14.114 4.878 2. Pebruari / February 622.102 419.860 14.114 4.878
3. Maret / March 536.668 362.368 16.292 5.634
4. April / April 566.229 371.667 13.319 5.847
5. M e i / May 541.432 1.249.783 14.381 5.215
6. Juni / June 654.925 455.312 13.080 5.287
7. Juli / July 708.635 476.741 5.382 1.603
8. Agustus / August 711.629 553.251 5.035 966
9. September / September 529.851 498.397 6.832 739
10.Oktober / October 577.646 437.637 9.146 680
11.Nopember / November 575.256 437.389 7.210 90
12.Desember / December 643.510 463.999 7.665 0
Jumlah / Total 7.286.255 6.139.852 126.570 35.817
2011 8.350.342 7.618.184 117.641 54.880 2010 7.366.965 5.268.912 149.552 60.186 2009 5.440.539 4.209.490 77.248 83.938 2008 6.224.507 4.710.464 221.088 55.274
Sumber : Pelabuan Udara Selaparang Mataram Source Selaparang Airport Mataram
Month B u l a n
(1)