Penduduk miskin Jawa Barat Tahun 2007 berjumlah 7 155,3 ribu, yang menempatkan Jawa Barat pada urutan ketiga dari Propinsi-Propinsi di Indonesia. Propinsi-Propinsi Jawa Timur & Jawa Tengah adalah Propinsi dengan jumlah penduduk miskin terbanyak masing-masing terdiri dari.
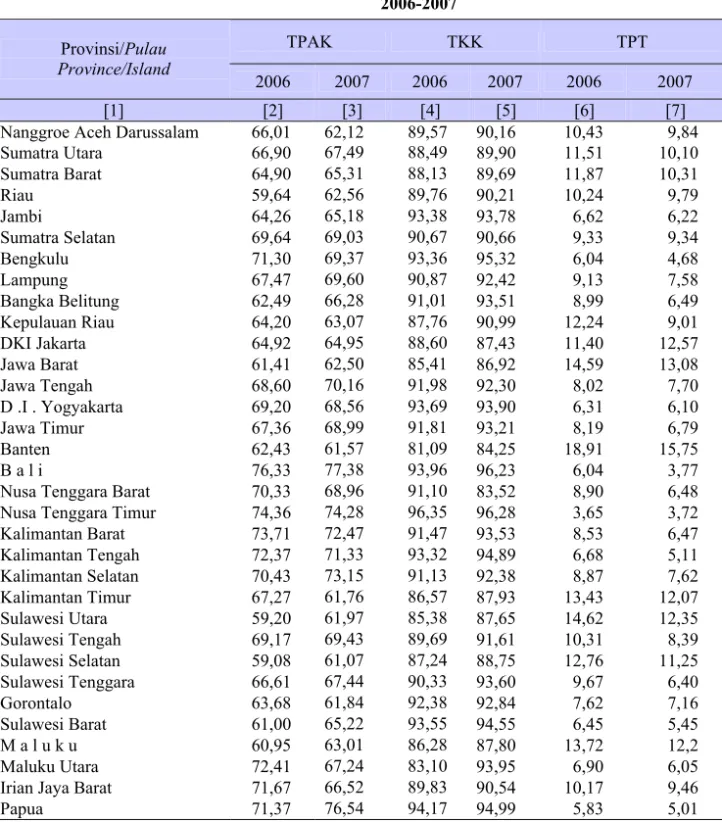
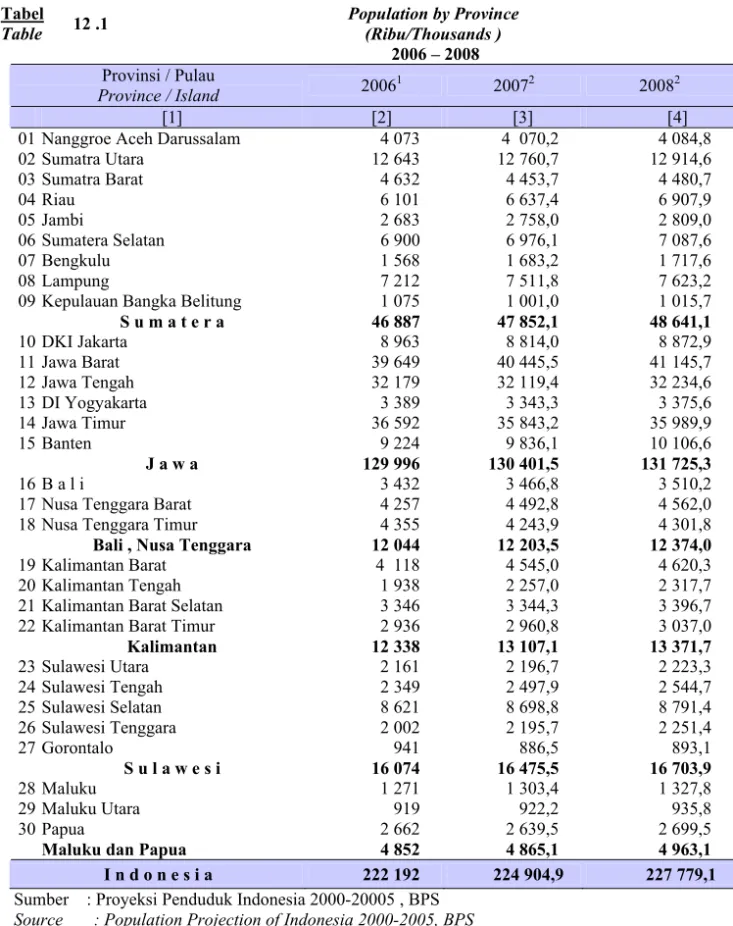
Kepadatan penduduk yang paling tinggi terdapat di Provinsi DKI Jakarta diikuti oleh provinsi Jawa Barat dan diurutan ketiga provinsi Banten, masing-masing 13 499 km2, 1 146 km2 dan 1 066 km2. Sementara tingkat pengangguran terbuka yang paling tinggi terjadi di Propinsi Banten yaitu 16,11 persen dan terkecil di Propinsi Nusa Tenggara Timur 3,98 persen .
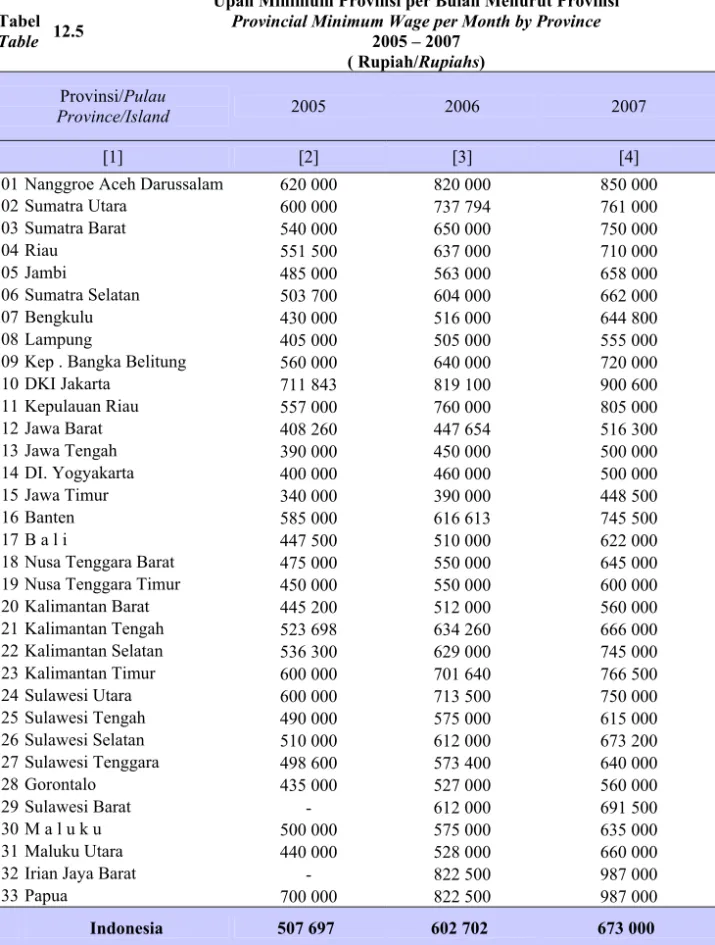
Upah Minimum Provinsi (UMP) untuk total 33 daerah di Indonesia, provinsi Irian Jaya Barat/Papua memiliki nilai tertinggi, diikuti oleh DKI Jakarta dan terkecil dimiliki oleh provinsi Jawa Timur. UMP Provinsi Jawa Barat lebih kecil dari UMP rata-rata nasional.
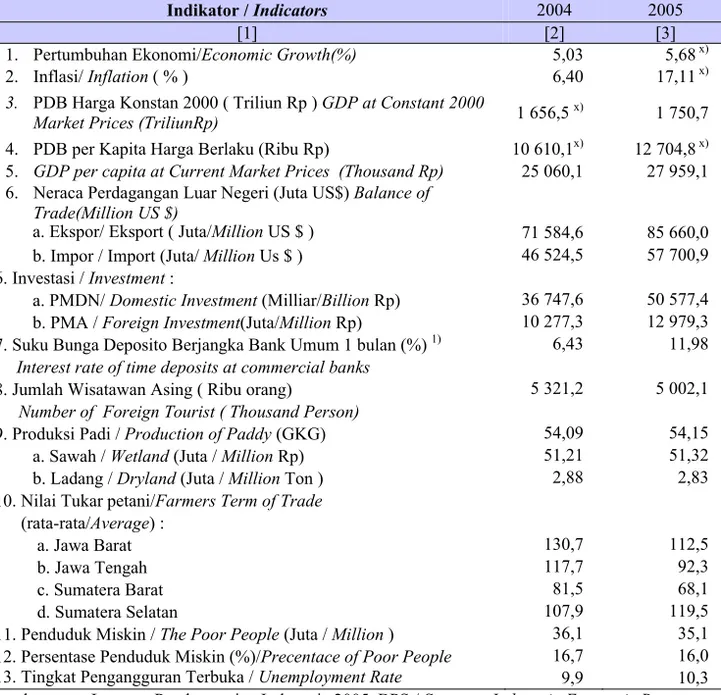
Salah satu indikator makro ekonomi yang mendapat perhatian serius dari pemerintah adalah Tingkat Perubahan Harga atau Inflasi yang relatif stabil atau rendah, bukan saja dapat meningkatkan Purchasing Power masyarakat, tetapi juga akan menguntungkan pengusaha atau produsen karena meningkatnya produksi akibat bertambahnya permintaan.
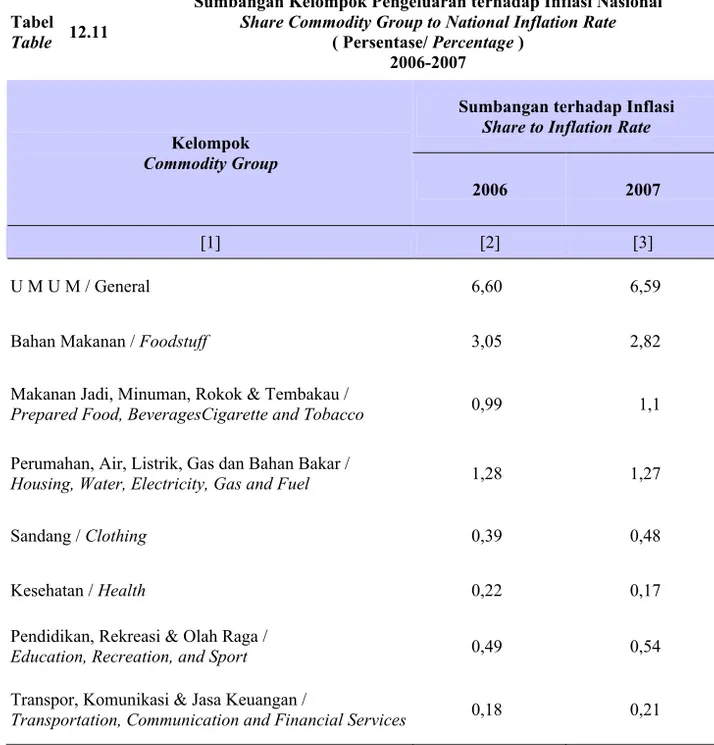
Inflasi nasional pada tahun 2007 sebesar 6,59 persen. Sumbangan Kelompok Pengeluaran tertinggi berada di Kelompok Bahan Makanan sebesar 11,25 persen dan terkecil dari Kelompok Transpor, Komunikasi dan Jasa Keuangan
The number of population lived bellow poverty line in Jawa Barat was 7 155,3 thousands, which positioned Jawa Barat Province on the third rank among all the provinces in Indonesia. Jawa Timur Province and Central Jawa Province were the most Province with the population lives bellow poverty line.
The most crowded province was DKI Jakarta followed by Jawa Barat and Banten. The population density was 13 499, 1 146, and 1 066 kms. However, Banten Province has the highest open unemployment rate for about 16.11 percent and Nusa Tenggara Timur has the lowest rate for about 3.98 percent.
Furthermore, Irian Jaya Barat/Papua Province had the highest Regional Minimum Rateamong the 33 provinces in Indonesia, which was followed by DKI Jakarta. In addition, Jawa Timur province had the lowest rate. Jawa Barat rate was less than national rate.
One of macro economic indicator that has seriously government attention is price change level or inflation, Inflation rate that has relatively stable or low is not only can increase Purchasing Power society but also give advantage to entrepreneur or producer since increase production cause by added demand.
The national inflation rate in 2007 was 6.59percent. The Food Group contributed the most for the Expenditeures expences was around 11,25 percent and the lowest was Transportation, Communication and Financial Services.
Tabel
Table 12 .1
Penduduk Menurut Provinsi
Population by Province (Ribu/Thousands ) 2006 – 2008 Provinsi / Pulau Province / Island 20061 20072 20082 [1] [2] [3] [4]
01 Nanggroe Aceh Darussalam 4 073 4 070,2 4 084,8
02 Sumatra Utara 12 643 12 760,7 12 914,6 03 Sumatra Barat 4 632 4 453,7 4 480,7 04 Riau 6 101 6 637,4 6 907,9 05 Jambi 2 683 2 758,0 2 809,0 06 Sumatera Selatan 6 900 6 976,1 7 087,6 07 Bengkulu 1 568 1 683,2 1 717,6 08 Lampung 7 212 7 511,8 7 623,2
09 Kepulauan Bangka Belitung 1 075 1 001,0 1 015,7
S u m a t e r a 46 887 47 852,1 48 641,1 10 DKI Jakarta 8 963 8 814,0 8 872,9 11 Jawa Barat 39 649 40 445,5 41 145,7 12 Jawa Tengah 32 179 32 119,4 32 234,6 13 DI Yogyakarta 3 389 3 343,3 3 375,6 14 Jawa Timur 36 592 35 843,2 35 989,9 15 Banten 9 224 9 836,1 10 106,6 J a w a 129 996 130 401,5 131 725,3 16 B a l i 3 432 3 466,8 3 510,2
17 Nusa Tenggara Barat 4 257 4 492,8 4 562,0
18 Nusa Tenggara Timur 4 355 4 243,9 4 301,8
Bali , Nusa Tenggara 12 044 12 203,5 12 374,0
19 Kalimantan Barat 4 118 4 545,0 4 620,3
20 Kalimantan Tengah 1 938 2 257,0 2 317,7
21 Kalimantan Barat Selatan 3 346 3 344,3 3 396,7
22 Kalimantan Barat Timur 2 936 2 960,8 3 037,0
Kalimantan 12 338 13 107,1 13 371,7 23 Sulawesi Utara 2 161 2 196,7 2 223,3 24 Sulawesi Tengah 2 349 2 497,9 2 544,7 25 Sulawesi Selatan 8 621 8 698,8 8 791,4 26 Sulawesi Tenggara 2 002 2 195,7 2 251,4 27 Gorontalo 941 886,5 893,1 S u l a w e s i 16 074 16 475,5 16 703,9 28 Maluku 1 271 1 303,4 1 327,8 29 Maluku Utara 919 922,2 935,8 30 Papua 2 662 2 639,5 2 699,5
Maluku dan Papua 4 852 4 865,1 4 963,1
I n d o n e s i a 222 192 224 904,9 227 779,1
Sumber : Proyeksi Penduduk Indonesia 2000-20005 , BPS Source : Population Projection of Indonesia 2000-2005, BPS Keterangan/Note :
1 Hasil estimasi berdasarkan data SUPAS tahun 2005 /
Estimation results based of Intercencal Population Survey 2005
550 Jawa Barat Dalam Angka 2008 )
Tabel
Table 12.2
Laju Pertumbuhan Penduduk Menurut Provinsi
Annual Growth Rate of Population by Province
2000 – 2015 ( Persen/Percentage)
Provinsi/Pulau
Province/Island 2000 - 2005 2005 - 2010 2010 - 2015
[1] [2] [3] [4]
01 Nanggroe Aceh Darussalam 0,55 0,37 0,26
02 Sumatra Utara 1,35 1,20 1,05 03 Sumatra Barat 0,71 0,60 0,69 04 Riau 4,30 4,11 3,79 05 Jambi 2,00 1,85 1,68 06 Sumatra Selatan 1,70 1,58 1,42 07 Bengkulu 2,13 1,99 1,85 08 Lampung 1,61 1,47 1,33
09 Kep . Bangka Belitung 1,54 1,46 1,34
10 DKI Jakarta 0,80 0,64 0,41 11 Jawa Barat 1,81 1,73 1,60 12 Jawa Tengah 0,42 0,35 0,26 13 DI. Yogyakarta 1,00 0,95 0,81 14 Jawa Timur 0,45 0,40 0,31 15 Banten 2,83 2,75 2,63 16 B a l i 1,41 1,26 1,07
17 Nusa Tenggara Barat 1,67 1,54 1,41
18 Nusa Tenggara Timur 1,54 1,37 1,23
19 Kalimantan Barat 1,82 1,66 1,51 20 Kalimantan Tengah 2,87 2,68 2,48 21 Kalimantan Selatan 1,66 1,57 1,47 22 Kalimantan Timur 2,77 2,57 2,37 23 Sulawesi Utara 1,37 1,23 1,08 24 Sulawesi Tengah 2,01 1,89 1,78 25 Sulawesi Selatan 1,08 1,00 0,91 26 Sulawesi Tenggara 2,76 2,53 2,33 27 Gorontalo 0,91 0,78 0,67 28 M a l u k u 1,66 1,58 1,54 29 Maluku Utara 1,78 1,72 1,66 30 Papua 2,61 2,29 2,04 Indonesia 1,34 1,27 1,18
Sumber : Proyeksi Penduduk Indonesia 2000-2005 , BPS Source : Population Projection of Indonesia 2000-2005, BPS
Tabel
Table 12.3
Persentase dan Kepadatan Penduduk Menurut Provinsi
Percentage and Population Density by Province
2005 – 2006
Persentase penduduk Percentage toTotal Population
(%) Kepadatan Penduduk Population Density (km2) Provinsi/Pulau Province/Island 2005 2006 2005 2006 [1] [2] [3] [4] [5]
01 Nanggroe Aceh Darussalam 1,84 1,83 78 78
02 Sumatra Utara 5,69 5,69 169 172 03 Sumatra Barat 2,09 2,08 106 108 04 Riau 2,01 2,14 52 54 05 Jambi 1,20 1,21 49 50 06 Sumatera Selatan 3,10 3,11 73 74 07 Bengkulu 0,71 0,71 78 79 08 Lampung 3,25 3,25 201 204
09 Kepulauan Bangka Belitung 0,48 0,48 65 66
10 Kepilauan Riau 0,58 0,60 15 15 S u m a t e r a 11 DKI Jakarta 4,05 4,03 13 344 13 499 12 Jawa Barat 17,80 17,84 1 126 1146 13 Jawa Tengah 14,61 14,48 982 989 14 DI Yogyakarta 1,53 1,53 1 049 1 064 15 Jawa Timur 16,58 16,47 757 764 16 Banten 4,13 4,15 1 044 1 066 J a w a 17 B a l i 1,55 1,54 601 609
18 Nusa Tenggara Barat 1,91 1,92 208 211
19 Nusa Tenggara Timur 1,95 1,96 90 92
Bali , Nusa Tenggara
20 Kalimantan Barat 1,85 1,85 28 28
21 Kalimantan Tengah 0,87 0,87 12 13
22 Kalimantan Barat Selatan 1,50 1,51 75 77
23 Kalimantan Barat Timur 1,30 1,32 12 13
Kalimantan 24 Sulawesi Utara 0,97 0,97 139 141 25 Sulawesi Tengah 1,05 1,06 36 37 26 Sulawesi Selatan 3,43 3,43 85 87 27 Sulawesi Tenggara 0,90 0,90 51 52 28 Gorontalo 0,42 0,42 75 77 29 Sulawesi Barat 0,44 0,45 11 11 S u l a w e s i 30 Maluku 0,57 0,57 27 27 31 Maluku Utara 0,40 0,41 29 30
32 Irian Jaya Barat 0,31 0,89 21 22
32 Papua 0,86 0,31 7 8
32 I n d o n e s i a 100,00 100,00 116 118
Sumber : Statistik Indonesia , Badan Pusat Statistik
552 Jawa Barat Dalam Angka 2008 )
Tabel
Table 12.4
Tingkat Pengangguran Terbuka Menurut Provinsi
Open Unemployment Rate by Province
2004 – 2007 ( Persen/Percentage) Provinsi/Pulau Province/Island 2004 2005 2006 2007 [1] [2] [3] [4] Nanggroe Aceh 8,35 14,00 12,08 10,27 Sumatra Utara 11,08 11,90 14,82 10,63 Sumatra Barat 12,73 13,34 12,93 11,02 Riau 15,25 12,16 11,46 10,39 Jambi 6,04 10,74 7,77 6,74 Sumatra Selatan 8,37 12,82 12,10 10,40 Bengkulu 6,29 8,91 6,91 5,12 Lampung 7,38 8,47 9,76 8,29 Kep . Bangka 7,14 7,19 5,95 7,36 DKI Jakarta 14,70 15,77 10,69 8,86 Kepulauan Riau - - 14,31 13,27 Jawa Barat 13,69 15,53 14,50 14,51 Jawa Tengah 7,72 9,54 8,20 8,10 DI. Yogyakarta 6,26 7,59 6,25 6,08 Jawa Timur 7,69 8,51 7,72 7,45 Banten 14,31 16,59 16,34 16,11 B a l i 4,66 5,32 5,32 4,89 Nusa Tenggara 7,48 10,29 8,96 7,55 Nusa Tenggara 4,48 4,82 4,98 3,98 Kalimantan Barat 7,90 8,13 7,06 7,08 Kalimantan Tengah 5,59 4,91 5,13 5,02 Kalimantan Selatan 6,02 7,34 8,78 7,31 Kalimantan Timur 10,39 11,17 12,11 12,83 Sulawesi Utara 10,91 14,05 13,67 13,04 Sulawesi Tengah 5,85 7,71 8,90 7,01 Sulawesi Selatan 15,93 15,93 12,32 12,01 Sulawesi Tenggara 9,35 10,93 7,42 6,93 Gorontalo 12,29 14,04 9,77 7,26 Sulawesi Barat - - 4,64 4,09 M a l u k u 11,67 15,01 15,76 14,37 Maluku Utara 7,53 13,09 8,54 8,34
Irian Jaya Barat - - 11,17 10,18
Papua 8,00 7,31 4,50 5,52
Indonesia 9,86 11,24 10,45 9,75
Sumber : Keadaan Angkatan Kerja di Indonesia , Badan Pusat Statistik Source : Labour Force Situation in Indonesia , Badan Pusat Statistik
Tabel
Table 12.5
Upah Minimum Provinsi per Bulan Menurut Provinsi
Provincial Minimum Wage per Month by Province
2005 – 2007 ( Rupiah/Rupiahs)
Provinsi/Pulau
Province/Island 2005 2006 2007
[1] [2] [3] [4]
01 Nanggroe Aceh Darussalam 620 000 820 000 850 000
02 Sumatra Utara 600 000 737 794 761 000 03 Sumatra Barat 540 000 650 000 750 000 04 Riau 551 500 637 000 710 000 05 Jambi 485 000 563 000 658 000 06 Sumatra Selatan 503 700 604 000 662 000 07 Bengkulu 430 000 516 000 644 800 08 Lampung 405 000 505 000 555 000
09 Kep . Bangka Belitung 560 000 640 000 720 000
10 DKI Jakarta 711 843 819 100 900 600 11 Kepulauan Riau 557 000 760 000 805 000 12 Jawa Barat 408 260 447 654 516 300 13 Jawa Tengah 390 000 450 000 500 000 14 DI. Yogyakarta 400 000 460 000 500 000 15 Jawa Timur 340 000 390 000 448 500 16 Banten 585 000 616 613 745 500 17 B a l i 447 500 510 000 622 000
18 Nusa Tenggara Barat 475 000 550 000 645 000
19 Nusa Tenggara Timur 450 000 550 000 600 000
20 Kalimantan Barat 445 200 512 000 560 000 21 Kalimantan Tengah 523 698 634 260 666 000 22 Kalimantan Selatan 536 300 629 000 745 000 23 Kalimantan Timur 600 000 701 640 766 500 24 Sulawesi Utara 600 000 713 500 750 000 25 Sulawesi Tengah 490 000 575 000 615 000 26 Sulawesi Selatan 510 000 612 000 673 200 27 Sulawesi Tenggara 498 600 573 400 640 000 28 Gorontalo 435 000 527 000 560 000 29 Sulawesi Barat - 612 000 691 500 30 M a l u k u 500 000 575 000 635 000 31 Maluku Utara 440 000 528 000 660 000
32 Irian Jaya Barat - 822 500 987 000
33 Papua 700 000 822 500 987 000
Indonesia 507 697 602 702 673 000
Sumber : Indikator Tingkat Hidup Pekerja Badan Pusat Statistik Source : Indikator Standarof Living Worker Badan Pusat Statistik
554 Jawa Barat Dalam Angka 2008 )
Tabel
Table 12.6
Indikator Ketenagakerjaan menurut Provinsi
Labour Force Indicators by Province
2005 – 2006
Angka Harapan Hidup AHH (Tahun) Rata-rata Lama Sekolah RLS (Tahun)
Angka Melek Huruf AMH (persen/percentage) Provinsi/Pulau Province/Island 2005 2006 2005 2006 2005 2006 [1] [2] [3] [4] [5] [6] [7]
01 Nanggroe Aceh Darussalam 68,0 68,3 8,4 8,5 96,0 96,2
02 Sumatra Utara 68,7 68,9 8,5 8,6 97,0 97,0 03 Sumatra Barat 68,2 68,5 8,0 8,0 96,0 96,0 04 Riau 70,7 70,8 8,4 8,4 97,8 97,8 05 Jambi 68,1 68,5 7,5 7,6 96,0 96,0 06 Sumatera Selatan 68,3 68,8 7,5 7,6 95,9 96,6 07 Bengkulu 68,8 68,9 8,0 8,0 94,7 94,7 08 Lampung 68,0 68,5 7,2 7,3 93,5 93,5
09 Kepulauan Bangka Belitung 68,1 68,3 6,6 6,9 95,4 95,4
10 Kepilauan Riau 69,5 69,6 8,1 8,4 96,0 96,0 11 DKI Jakarta 72,5 72,6 10,6 10,8 98,3 98,4 12 Jawa Barat 67,2 67,4 7,4 7,5 94,6 94,9 13 Jawa Tengah 70,6 70,8 6,6 6,8 87,4 88,2 14 DI Yogyakarta 72,9 73,0 8,4 8,5 86,7 86,7 15 Jawa Timur 68,5 68,6 6,8 6,9 85,8 87,1 16 Banten 64,0 64,3 8,0 8,1 95,6 95,6 17 B a l i 70,4 70,5 7,4 7,6 86,2 86,2
18 Nusa Tenggara Barat 60,5 60,9 6,6 6,7 78,8 80,1
19 Nusa Tenggara Timur 64,9 66,5 6,3 6,4 85,6 86,5
20 Kalimantan Barat 65,2 66,0 6,6 6,7 89,0 89,0
21 Kalimantan Tengah 70,7 70,8 7,9 8,0 97,5 97,5
22 Kalimantan Barat Selatan 62,1 62,4 7,3 7,4 95,3 95,3
23 Kalimantan Barat Timur 70,3 70,4 8,7 8,8 95,3 95,5
24 Sulawesi Utara 71,7 71,8 8,8 8,8 99,3 99,3 25 Sulawesi Tengah 65,4 65,6 7,6 7,7 94,9 94,9 26 Sulawesi Selatan 68,7 69,2 7,0 7,2 84,6 85,7 27 Sulawesi Tenggara 66,8 67,0 7,6 7,6 91,3 91,3 28 Gorontalo 65,0 65,6 6,8 6,8 95,0 95,7 29 Sulawesi Barat 66,4 67,0 6,0 6,3 83,4 85,9 30 Maluku 66,2 66,6 8,5 8,6 98,0 98,0 31 Maluku Utara 64,2 64,8 8,5 8,6 95,2 95,2
32 Irian Jaya Barat 66,9 67,3 7,2 7,2 85,4 88,6
32 Papua 67,3 67,6 6,2 6,3 74,9 75,4
Sumber : Statistik Indonesia, Badan Pusat Statistik
Tabel Table 12.6 Lanjutan Continued Pengeluaran Riil/capita Disesuaikan (Rp.000) IPM Peringkat Provinsi/Pulau Province/Island 2005 2006 2005 2006 2005 2006 [1] [8] [9] [10] [11] [12] [13]
01 Nanggroe Aceh Darussalam 588,9 589,5 69,0 69,4 18 18
02 Sumatra Utara 618,0 621,4 72,0 72,5 8 8 03 Sumatra Barat 618,2 622,5 71,2 71,6 9 9 04 Riau 623,2 625,0 73,6 73,8 3 3 05 Jambi 620,8 621,7 71,0 71,3 11 10 06 Sumatera Selatan 610,3 615,3 70,2 71,1 13 13 07 Bengkulu 617,1 618,7 71,1 71,3 10 11 08 Lampung 605,1 607,0 68,8 69,4 19 19
09 Kepulauan Bangka Belitung 628,0 630,2 70,7 71,2 12 12
10 Kepilauan Riau 621,9 625,5 72,2 72,8 7 7 11 DKI Jakarta 619,5 619,9 76,1 76,3 1 1 12 Jawa Barat 619,7 621,1 69,9 70,3 14 14 13 Jawa Tengah 621,4 621,7 69,8 70,3 16 15 14 DI Yogyakarta 638,0 638,8 73,5 73,7 4 4 15 Jawa Timur 622,2 626,0 68,4 69,2 22 20 16 Banten 619,2 620,0 68,8 69,1 20 21 17 B a l i 618,2 620,2 69,8 70,1 15 16
18 Nusa Tenggara Barat 623,2 623,9 62,4 63,0 32 32
19 Nusa Tenggara Timur 589,8 591,2 62,6 64,8 31 31
20 Kalimantan Barat 609,6 613,9 66,2 67,1 28 28
21 Kalimantan Tengah 623,6 624,4 73,2 73,4 5 5
22 Kalimantan Barat Selatan 622,7 623,8 67,4 67,7 26 26
23 Kalimantan Barat Timur 621,4 623,6 72,9 73,3 6 6
24 Sulawesi Utara 616,1 616,9 74,2 74,4 2 2 25 Sulawesi Tengah 610,3 613,2 68,5 68,8 21 22 26 Sulawesi Selatan 616,8 618,3 68,1 68,8 23 23 27 Sulawesi Tenggara 598,9 601,0 67,5 67,8 24 25 28 Gorontalo 607,8 608,7 67,5 68,0 25 24 29 Sulawesi Barat 616,3 619,4 65,7 67,1 29 29 30 Maluku 597,3 599,3 69,2 69,7 17 17 31 Maluku Utara 590,3 592,1 67,0 67,5 27 27
32 Irian Jaya Barat 584,0 588,0 64,8 66,1 30 30
32 Papua 585,2 589,3 62,1 62,8 33 33
Sumber : Indeks Pembangunan Manusian Badan Pusat Statistik 2005/2006 Source : Statistical Yearbook of Indonesia, Badan Pusat Statisik
556 Jawa Barat Dalam Angka 2008 )
Tabel
Table 12.7
Penduduk Miskin per Provinsi
Number of Population Below the Poverty Line
2007 ( Ribu/Thousands) Provinsi/Pulau Province/Island Perkotaan Urban Perdesaan Rural Perkotaan + Perdesaan Urban+ Rural [1] [2] [3] [4]
01 Nanggroe Aceh Darussalam 218,8 864,9 1 083,7
02 Sumatra Utara 833,5 935,0 1 768,5 03 Sumatra Barat 149,2 380,0 529,2 04 Riau 246,4 328,1 574,5 05 Jambi 137,2 144,7 281,9 06 Sumatra Selatan 545,9 785,9 1 331,8 07 Bengkulu 135,6 235,0 370,6 08 Lampung 366,0 1 295,7 1 661,7
09 Kep . Bangka Belitung 38,6 56,5 95,1
10 DKI Jakarta 405,7 71,6 148,4 11 Kepulauan Riau 76,8 0,0 405,7 12 Jawa Barat 2 654,6 2 803,3 5 457,9 13 Jawa Tengah 2 687,3 3 869,9 6 557,2 14 DI. Yogyakarta 335,3 298,2 633,5 15 Jawa Timur 2 575,7 4 579,6 7 155,3 16 Banten 399,4 486,8 886,2 17 B a l i 119,8 109,3 229,1
18 Nusa Tenggara Barat 570,9 547,7 1 118,6
19 Nusa Tenggara Timur 124,9 1 038,7 1 163,6
20 Kalimantan Barat 144,1 440,2 584,3 21 Kalimantan Tengah 51,2 159,1 210,3 22 Kalimantan Selatan 83,1 150,4 233,5 23 Kalimantan Timur 136,1 188,7 324,8 24 Sulawesi Utara 79,0 171,1 250,1 25 Sulawesi Tengah 67,1 490,3 557,4 26 Sulawesi Selatan 152,8 930,6 1 083,4 27 Sulawesi Tenggara 31,3 434,1 465,4 28 Gorontalo 30,7 211,2 241,9 29 Sulawesi Barat 55,1 134,8 189,9 30 M a l u k u 49,1 355,5 404,7 31 Maluku Utara 11,7 98,2 109,9
32 Irian Jaya Barat 11,0 255,8 266,8
33 Papua 35,4 758,0 793,4
Indonesia 13 559,3 23 609,0 37 168,3
Sumber : Data dan Informasi Kemiskinan, Badan Pusat Statistik Source : Data and Poverty Information, Badan Pusat Statistik
Tabel
Table 12.8
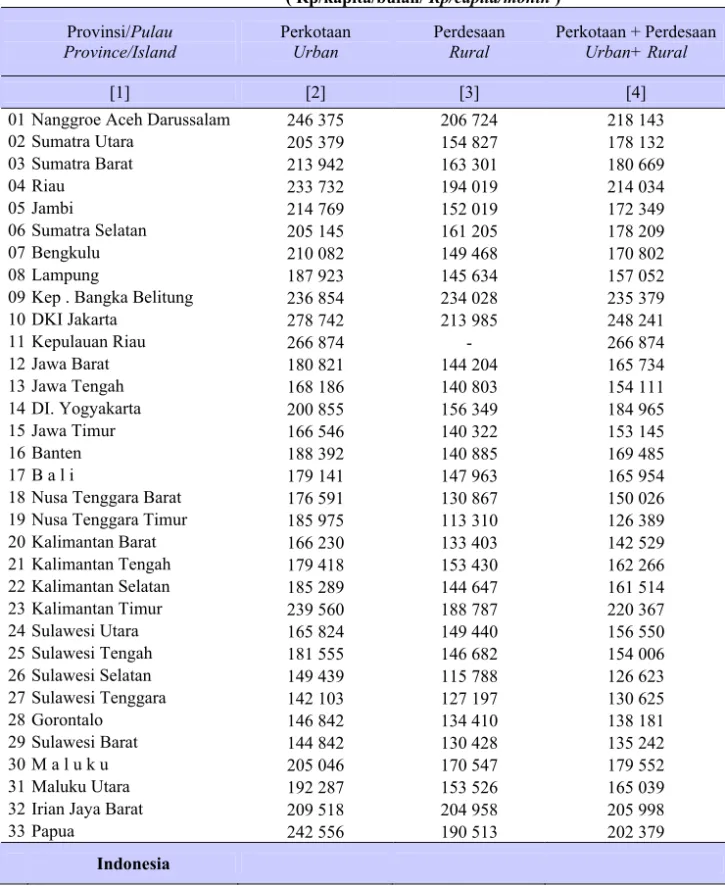
Garis Kemiskinan per Provinsi
Poverty Line by Province
2005
( Rp/kapita/bulan/ Rp/capita/month )
Provinsi/Pulau
Province/Island Perkotaan Urban Perdesaan Rural Perkotaan + Perdesaan Urban+ Rural
[1] [2] [3] [4]
01 Nanggroe Aceh Darussalam 246 375 206 724 218 143
02 Sumatra Utara 205 379 154 827 178 132 03 Sumatra Barat 213 942 163 301 180 669 04 Riau 233 732 194 019 214 034 05 Jambi 214 769 152 019 172 349 06 Sumatra Selatan 205 145 161 205 178 209 07 Bengkulu 210 082 149 468 170 802 08 Lampung 187 923 145 634 157 052
09 Kep . Bangka Belitung 236 854 234 028 235 379
10 DKI Jakarta 278 742 213 985 248 241 11 Kepulauan Riau 266 874 - 266 874 12 Jawa Barat 180 821 144 204 165 734 13 Jawa Tengah 168 186 140 803 154 111 14 DI. Yogyakarta 200 855 156 349 184 965 15 Jawa Timur 166 546 140 322 153 145 16 Banten 188 392 140 885 169 485 17 B a l i 179 141 147 963 165 954
18 Nusa Tenggara Barat 176 591 130 867 150 026
19 Nusa Tenggara Timur 185 975 113 310 126 389
20 Kalimantan Barat 166 230 133 403 142 529 21 Kalimantan Tengah 179 418 153 430 162 266 22 Kalimantan Selatan 185 289 144 647 161 514 23 Kalimantan Timur 239 560 188 787 220 367 24 Sulawesi Utara 165 824 149 440 156 550 25 Sulawesi Tengah 181 555 146 682 154 006 26 Sulawesi Selatan 149 439 115 788 126 623 27 Sulawesi Tenggara 142 103 127 197 130 625 28 Gorontalo 146 842 134 410 138 181 29 Sulawesi Barat 144 842 130 428 135 242 30 M a l u k u 205 046 170 547 179 552 31 Maluku Utara 192 287 153 526 165 039
32 Irian Jaya Barat 209 518 204 958 205 998
33 Papua 242 556 190 513 202 379
Indonesia
Sumber : Data dan Informasi Kemiskinan, Badan Pusat Statistik Source : Data and Poverty Information, Badan Pusat Statistik
558 Jawa Barat Dalam Angka 2008 )
Tabel
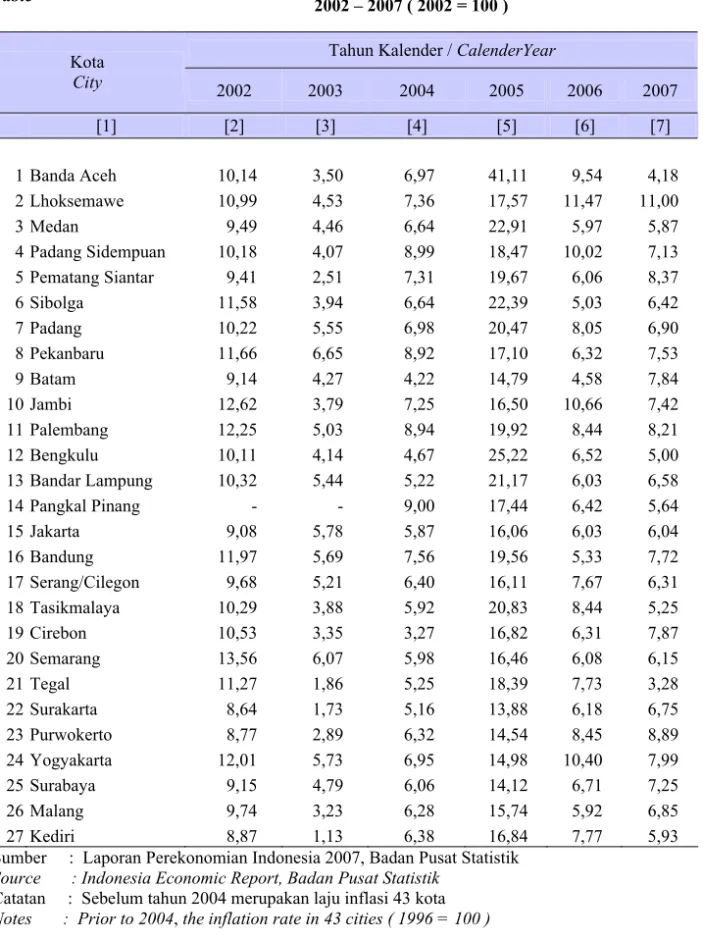
Table 12.9
Laju Inflasi 45 Kota *) di Indonesia
Inflation Rate of 45 Cities in Indonesia
2002 – 2007 ( 2002 = 100 )
Tahun Kalender / CalenderYear Kota City 2002 2003 2004 2005 2006 2007 [1] [2] [3] [4] [5] [6] [7] 1 Banda Aceh 10,14 3,50 6,97 41,11 9,54 4,18 2 Lhoksemawe 10,99 4,53 7,36 17,57 11,47 11,00 3 Medan 9,49 4,46 6,64 22,91 5,97 5,87 4 Padang Sidempuan 10,18 4,07 8,99 18,47 10,02 7,13 5 Pematang Siantar 9,41 2,51 7,31 19,67 6,06 8,37 6 Sibolga 11,58 3,94 6,64 22,39 5,03 6,42 7 Padang 10,22 5,55 6,98 20,47 8,05 6,90 8 Pekanbaru 11,66 6,65 8,92 17,10 6,32 7,53 9 Batam 9,14 4,27 4,22 14,79 4,58 7,84 10 Jambi 12,62 3,79 7,25 16,50 10,66 7,42 11 Palembang 12,25 5,03 8,94 19,92 8,44 8,21 12 Bengkulu 10,11 4,14 4,67 25,22 6,52 5,00 13 Bandar Lampung 10,32 5,44 5,22 21,17 6,03 6,58 14 Pangkal Pinang - - 9,00 17,44 6,42 5,64 15 Jakarta 9,08 5,78 5,87 16,06 6,03 6,04 16 Bandung 11,97 5,69 7,56 19,56 5,33 7,72 17 Serang/Cilegon 9,68 5,21 6,40 16,11 7,67 6,31 18 Tasikmalaya 10,29 3,88 5,92 20,83 8,44 5,25 19 Cirebon 10,53 3,35 3,27 16,82 6,31 7,87 20 Semarang 13,56 6,07 5,98 16,46 6,08 6,15 21 Tegal 11,27 1,86 5,25 18,39 7,73 3,28 22 Surakarta 8,64 1,73 5,16 13,88 6,18 6,75 23 Purwokerto 8,77 2,89 6,32 14,54 8,45 8,89 24 Yogyakarta 12,01 5,73 6,95 14,98 10,40 7,99 25 Surabaya 9,15 4,79 6,06 14,12 6,71 7,25 26 Malang 9,74 3,23 6,28 15,74 5,92 6,85 27 Kediri 8,87 1,13 6,38 16,84 7,77 5,93
Sumber : Laporan Perekonomian Indonesia 2007, Badan Pusat Statistik Source : Indonesia Economic Report, Badan Pusat Statistik
Catatan : Sebelum tahun 2004 merupakan laju inflasi 43 kota Notes : Prior to 2004, the inflation rate in 43 cities ( 1996 = 100 )
Tabel
Table 12.9
Lanjutan
Continued
Tahun Kalender / Calendar Year K o t a C i t y 2002 2003 2004 2005 2006 2007 [1] [2] [3] [4] [5] [6] [7] 28 Jember 9,75 5,20 6,24 16,86 6,84 6,27 29 Denpasar 12,49 4,56 5,97 11,31 4,30 5,91 30 Mataram 7,96 1,82 6,61 17,72 4,17 8,76 31 Kupang 9,77 5,45 8,28 15,16 9,72 8,44 32 Pontianak 8,61 5,48 6,06 14,43 6,32 8,56 33 Palangkaraya 9,18 5,68 7,25 12,12 7,75 7,57 34 Sampit 7,59 3,06 6,67 11,90 7,72 7,96 35 Banjarmasin 9,18 6,77 7,54 12,94 11,03 7,78 36 Samarinda 10,26 7,99 5,65 16,64 6,50 7,27 37 Balikpapan 11,38 5,92 7,60 17,28 5,52 9,18 38 Manado 15,22 0,69 4,69 18,73 5,09 10,13 39 Palu 13,36 5,84 7,01 16,33 8,69 8,13 40 Makasar 8,25 3,01 6,47 15,20 7,21 5,71 41 Kendari 10,35 2,41 7,72 21,45 10,57 7,53 42 Gorontalo - - 8,64 18,56 7,54 7,02 43 Ambon 9,47 2,51 3,44 16,67 4,80 10,43 44 Ternate 6,40 6,27 4,82 19,42 5,12 5,85 45 Jayapura 13,91 8,39 9,45 14,15 9,52 10,35 Nasional 10,03 5,06 6,40 17,11 6,60 6,59
Sumber : Laporan Perekonomian Indonesia 2007, Badan Pusat Statistik Source : Indonesia Economic Report, Badan Pusat Statistik
Catatan : Sebelum tahun 2004 merupakan laju inflasi 43 kota Notes : Prior to 2004, the inflation rate in 43 cities ( 1996 = 100 )
560 Jawa Barat Dalam Angka 2008 )
Tabel
Table 12.10
Laju Inflasi Indonesia Menurut Kelompok Barang Kebutuhan
Inflation Rate of Indonesia by Commodity Group
( Persen/ Percentage ) 2000 – 2007 Tahun/ Bulan Year/ Month Bahan makanan Foodstuff Makanan Jadi, Minuman, Rokok dan Tembakau Prepared Food, Beverages , Cigarette and Tobacco Perumahan, Air,Listrik, Gas & Bahan Bakar Housing,Wa ter ,Electricity, Gas, and Fuel Sandang Clothing Kesehat an Health Pendidikan ,Rekreasi, Dan O.R. Education, Recreation And Sport Transpor, Komunika si dan Jasa Keuangan Transport ation, Communi cation and Financial Services Umum Gener al [1] [2] [3] [4] [5] [6] [7] [8] [9] 2000 4,00 11,08 10,10 10,19 9,57 17,51 12,66 9,35 2001 12,03 14,48 13,59 8,14 8,92 11,90 14,16 12,55 2002 9,13 9,18 12,71 2,69 5,63 10,85 15,52 10,03 2003 -1,72 6,24 9,21 7,09 5,67 11,71 4,10 5,06 2004 6,38 4,85 7,40 4,87 4,75 10,31 5,84 6,40 2005 13,91 13,71 13,94 6,92 6.13 8,24 44,75 17,11 2006 12,94 6,36 4,83 6,84 5,87 8,13 1,02 6,60 2007 11,25 6,41 4,88 8,42 4,31 8,83 1,25 6,59 Januari 2,68 0,87 0,71 -0,25 0,54 0,10 0,10 1,04 Pebruari 0,84 0,65 0,80 0,56 0,64 0,23 0,03 0,62 Maret 0,16 0,36 0,29 0,41 0,20 0,03 0,09 0,24 April -1,30 0,38 0,26 0,61 0,32 -0,03 0,22 -0,16 Mei -0,39 0,47 0,35 0,21 0,18 0,01 0,13 0,10 Juni 0,47 0,33 0,13 -0,43 0,22 0,03 0,11 0,23 Juli 1,35 0,40 0,32 0,61 0,35 2,89 0,05 0,72 Agustus 0,79 0,48 0,77 0,49 0,24 3,18 0,04 0,75 September 1,81 0,45 0,18 1,22 0,44 1,70 0,07 0,80 Oktober 1,87 0,51 0,21 2,05 0,45 0,21 0,47 0,79 Nopember 0,04 0,43 0,12 1,66 0,26 0,11 -0,27 0,18 Desember 2,47 0,91 0,63 0,99 0,41 0,12 0,22 0,10
Sumber : Laporan Perekonomian Indonesia 2007, Badan Pusat Statistik (Indikator Ekonomi dan Warta IHK ) 2006, Badan Pusat Statistik Source : Indonesia Economic Report, BPS
Tabel
Table 12.11
Sumbangan Kelompok Pengeluaran terhadap Inflasi Nasional
Share Commodity Group to National Inflation Rate
( Persentase/ Percentage ) 2006-2007
Sumbangan terhadap Inflasi
Share to Inflation Rate
Kelompok
Commodity Group
2006 2007
[1] [2] [3]
U M U M / General 6,60 6,59
Bahan Makanan / Foodstuff 3,05 2,82
Makanan Jadi, Minuman, Rokok & Tembakau /
Prepared Food, BeveragesCigarette and Tobacco 0,99 1,1
Perumahan, Air, Listrik, Gas dan Bahan Bakar /
Housing, Water, Electricity, Gas and Fuel 1,28 1,27
Sandang / Clothing 0,39 0,48
Kesehatan / Health 0,22 0,17
Pendidikan, Rekreasi & Olah Raga /
Education, Recreation, and Sport 0,49 0,54
Transpor, Komunikasi & Jasa Keuangan /
Transportation, Communication and Financial Services 0,18 0,21
Sumber : Laporan Perekonomian Indonesia 2007, Badan Pusat Statistik (Indikator Ekonomi dan Warta IHK ) 2007, Badan Pusat Statistik Source : Indonesia Economic Report, Badan Pusat Statistik
562 Jawa Barat Dalam Angka 2008 )
Tabel
Table 12.12
Produk Domestik Bruto ( PDB) Indonesia Atas Dasar Harga Berlaku, Menurut Lapangan Usaha
Gross Domestic Product of Indonesia at Current Market Price by Industrial Origin
(Miliar/Billion Rp) 2005 – 2007 LAPANGAN USAHA/
IndustrialOrigin 2005 2006 x) 2007 **)
[1] [2] [3] [4]
1. Pertanian, Peternakan, Kehutanan dan Perikanan / Agriculture, Livestock, Forestry and Fisheries 364 169,3 (13,13) 433 233,4 (12,07) 547 235,6 (13,83) 2. Pertambangan dan Penggalian / Mining and
Quarrrying 309 014,1 (11,14) 366 505,4 (10,97) 440 826,2 (11,14) 3. Industri Pengolahan / Manufacturing Industry 760 361,3 (27,41) 919 532,7 (27,54) 1 068 806,4 (27,01) 4. Listrik, gas dan Air Minum / Electricity, Gas
and Water Supply
26 693,8 (0,96) 30 354,8 (0,91) 37 726,2 (0,88) 5. Bangunan / Construction 195 110,6 (7,03) 251 132,3 (7,52) 305 215,7 (7,71) 6. Perdagangan, Hotel dan Restoran / Trade,
Hotel and Retaurant
431 620,2 (-15,56) 501 542,1 (15,02) 590 822,3 (14,93) 7. Pengangkutan dan Komunikasi / Transport and
Communication
180 584,9
(-6,51) 231 808,6 (6,94) 265 256,9 (6,70) 8. Keuangan, Real Estate dan Jasa Perusahaan /
Financial, Real estate & Business Services 230 522,7 (8,31) 269 121,4 (8,06) 305 216,0 (7,71)
9. Jasa – jasa / Services 276 204,2 (9,96) 336 258,9 (10,07) 399 298,6 (10,09)
Produk Domestik Bruto
Gross Domestic Product
2 774 281,1 (100,00) 3 339 479,6 (100,00) 3 957 403,9 (100,00) Produk Domestik Bruto Tanpa Migas
Gross Domestic Product Non Oil and Gas
2 458 234,3 (88,61) 2 967 303,1 (88,86) 3 540 950,1 (89,48)
Sumber : Laporan Perekonomian Indonesia 2007, Badan Pusat Statistik Source : Indonesia Economic Report, Badan Pusat Statistik
Catatan : Angka dalam kurung menunjukan Persentase terhadap PDB Notes : Figure in parenthese are percentage of GDP
Tabel
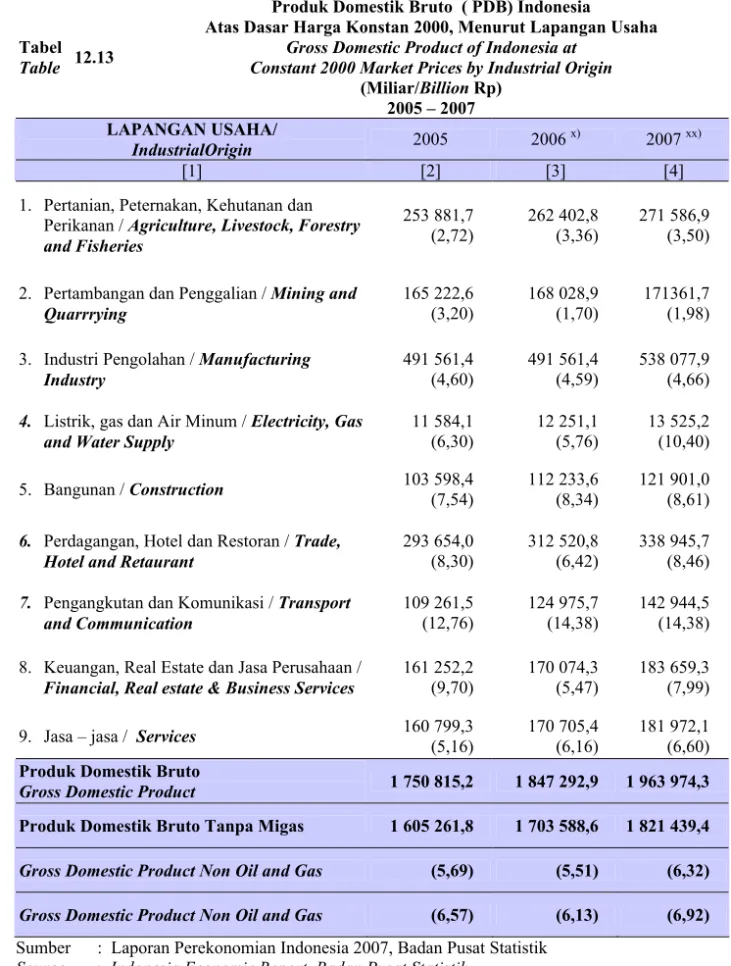
Table 12.13
Produk Domestik Bruto ( PDB) Indonesia
Atas Dasar Harga Konstan 2000, Menurut Lapangan Usaha
Gross Domestic Product of Indonesia at Constant 2000 Market Prices by Industrial Origin
(Miliar/Billion Rp) 2005 – 2007 LAPANGAN USAHA/
IndustrialOrigin 2005 2006 x) 2007 xx)
[1] [2] [3] [4]
1. Pertanian, Peternakan, Kehutanan dan Perikanan / Agriculture, Livestock, Forestry and Fisheries
253 881,7
(2,72) 262 402,8 (3,36) 271 586,9 (3,50) 2. Pertambangan dan Penggalian / Mining and
Quarrrying 165 222,6 (3,20) 168 028,9 (1,70) 171361,7 (1,98) 3. Industri Pengolahan / Manufacturing
Industry
491 561,4
(4,60) 491 561,4 (4,59) 538 077,9 (4,66) 4. Listrik, gas dan Air Minum / Electricity, Gas
and Water Supply
11 584,1 (6,30) 12 251,1 (5,76) 13 525,2 (10,40) 5. Bangunan / Construction 103 598,4 (7,54) 112 233,6 (8,34) 121 901,0 (8,61)
6. Perdagangan, Hotel dan Restoran / Trade, Hotel and Retaurant
293 654,0
(8,30) 312 520,8 (6,42) 338 945,7 (8,46) 7. Pengangkutan dan Komunikasi / Transport
and Communication 109 261,5 (12,76) 124 975,7 (14,38) 142 944,5 (14,38) 8. Keuangan, Real Estate dan Jasa Perusahaan /
Financial, Real estate & Business Services 161 252,2 (9,70) 170 074,3 (5,47) 183 659,3 (7,99)
9. Jasa – jasa / Services 160 799,3 (5,16) 170 705,4 (6,16) 181 972,1 (6,60)
Produk Domestik Bruto
Gross Domestic Product 1 750 815,2 1 847 292,9 1 963 974,3
Produk Domestik Bruto Tanpa Migas 1 605 261,8 1 703 588,6 1 821 439,4
Gross Domestic Product Non Oil and Gas (5,69) (5,51) (6,32)
Gross Domestic Product Non Oil and Gas (6,57) (6,13) (6,92)
Sumber : Laporan Perekonomian Indonesia 2007, Badan Pusat Statistik Source : Indonesia Economic Report, Badan Pusat Statistik
Catatan : Angka dalam kurung menunjukan Laju Pertumbuhan Notes : Figures in parentheses are growth of rate
564 Jawa Barat Dalam Angka 2008 )
Tabel
Table 12.14
Produk Domestik Bruto ( PDB) Indonesia per Kapita
Per Capita Gross Domestic Product
(Ribu/Thousand Rp) 2003 – 2007 Tahun / Year Harga Berlaku At Current Market Prices Harga Konstan 2000 At Constan, Market Prices [1] [2] [4] 2003 9 429,5 7 385,5 2004 10 610,1 7 655,5 2005 12 675,5 7 999,4 2006 x) 15 029,7 8 314,0 2007 **) 17 581,4 8 725,3
Sumber : Laporan Perekonomian Indonesia 2007, Badan Pusat Statistik Source : Indonesia Economic Report , Badan Pusat Statistik
Sumber : Laporan Perekonomian Indonesia 2005, BPS / Source : Indonesia Economic Report, BPS
Catatan/Notes :
1) Kondisi Desember / Condition at December
1) Hasil Susenas 2002 (Modul Konsumsi)/Susenas 2002 (Consumption Modul)
2) Hasil Susenas Panel Modul Konsumsi 2003, 2004, 2005 / Susenas Panel Consumption Module 2003, 2004, 2005
x )Angka sementara ; xx) Angka sangat sementara ; r) Angka diperbaiki
Tabel
Table 12.15
Perkembangan Beberapa Indikator Ekonomi Indonesia
Economic Indicators of Indonesia
2004 – 2007
Indikator / Indicators 2004 2005
[1] [2] [3]
1. Pertumbuhan Ekonomi/Economic Growth(%) 5,03 5,68 x)
2. Inflasi/ Inflation ( % ) 6,40 17,11 x)
3. PDB Harga Konstan 2000 ( Triliun Rp ) GDP at Constant 2000
Market Prices (TriliunRp) 1 656,5 x) 1 750,7
4. PDB per Kapita Harga Berlaku (Ribu Rp) 10 610,1x) 12 704,8 x)
5. GDP per capita at Current Market Prices (Thousand Rp) 25 060,1 27 959,1 6. Neraca Perdagangan Luar Negeri (Juta US$) Balance of
Trade(Million US $)
a. Ekspor/ Eksport ( Juta/Million US $ ) 71 584,6 85 660,0
b. Impor / Import (Juta/ Million Us $ ) 46 524,5 57 700,9
6. Investasi / Investment :
a. PMDN/ Domestic Investment (Milliar/Billion Rp) 36 747,6 50 577,4
b. PMA / Foreign Investment(Juta/Million Rp) 10 277,3 12 979,3
7. Suku Bunga Deposito Berjangka Bank Umum 1 bulan (%) 1) 6,43 11,98
Interest rate of time deposits at commercial banks
8. Jumlah Wisatawan Asing ( Ribu orang) 5 321,2 5 002,1
Number of Foreign Tourist ( Thousand Person)
9. Produksi Padi / Production of Paddy (GKG) 54,09 54,15
a. Sawah / Wetland (Juta / Million Rp) 51,21 51,32
b. Ladang / Dryland (Juta / Million Ton ) 2,88 2,83
10. Nilai Tukar petani/Farmers Term of Trade (rata-rata/Average) :
a. Jawa Barat 130,7 112,5
b. Jawa Tengah 117,7 92,3
c. Sumatera Barat 81,5 68,1
d. Sumatera Selatan 107,9 119,5
11. Penduduk Miskin / The Poor People (Juta / Million ) 36,1 35,1
12. Persentase Penduduk Miskin (%)/Precentace of Poor People 16,7 16,0
566 Jawa Barat Dalam Angka 2008 ) Tabel Table 12.15 Lanjutan Continued Indikator / Indicators 2006 2007 [1] [4] [5]
1. Pertumbuhan Ekonomi/Economic Growth(%) 5,48 xx) 6,32
2. Inflasi/ Inflation ( % ) 6,60 7,4
3. PDB Harga Konstan 2000 ( Triliun Rp ) GDP at Constant
2000 Market Prices (TriliunRp) 1 846,5
xx)
1 964,0 4. PDB per Kapita Harga Berlaku (Ribu Rp) GDP per capita
at Current Market Prices (Thousand Rp) 15 033,4
xx)
17 581,4 5. Neraca Perdagangan Luar Negeri (Juta US$) Balance of
Trade(Million US $) 39 733,1 39 628,0
a. Ekspor/ Eksport ( Juta/Million US $ ) 100 798,6 114 101,3
b. Impor / Import (Juta/ Million Us $ ) 61 065,5 74 473,3
6. Investasi / Investment :
a. PMDN/ Domestic Investment (Milliar/Billion Rp) 162 767,2 18 8876,3
b. PMA / Foreign Investment(Juta/Million Rp) 15 624,0 40 145,8
7. Suku Bunga Deposito Berjangka Bank Umum 1 bulan (%) 1) / Interest rate of time deposits at commercial banks
8,96
7,2 8. Jumlah Wisatawan Asing ( Ribu orang) / Number of
Foreign Tourist ( Thousand Person) 4 871,3 4 541,4
9. Produksi Padi / Production of Paddy (GKG) 54,4 57,0
a. Sawah / Wetland (Juta / Million Rp) 51,60 x) 54,1
b. Ladang / Dryland (Juta / Million Ton ) 2,80 x) 2,9
10. Nilai Tukar petani/Farmers Term of Trade (rata-rata/Average) :
a. Jawa Barat 115,5 116,0
b. Jawa Tengah 96,7 107,6
c. Sumatera Barat 74,2 70,1
d. Sumatera Selatan 136,8 136,7
11. Penduduk Miskin / The Poor People (Juta / Million ) 39,0 371,7
12. Persentase Penduduk Miskin (%)/Precentace of Poor People 17,7 16,6
13.Tingkat Pengangguran Terbuka / Unemployment Rate 10,3 9,1
Sumber : Laporan Perekonomian Indonesia 2005, BPS / Source : Indonesia Economic Report, BPS Catatan/Notes :
1) Kondisi Desember / Condition at December
3) Hasil Susenas 2002 (Modul Konsumsi)/Susenas 2002 (Consumption Modul)
4) Hasil Susenas Panel Modul Konsumsi 2003, 2004, 2005 / Susenas Panel Consumption Module 2003, 2004, 2005
Tabel
Table 12.16
Indikator Ketenagakerjaan 1) Menurut Provinsi Labour Force Indicators By Province
2006-2007 TPAK TKK TPT Provinsi/Pulau Province/Island 2006 2007 2006 2007 2006 2007 [1] [2] [3] [4] [5] [6] [7]
Nanggroe Aceh Darussalam 66,01 62,12 89,57 90,16 10,43 9,84
Sumatra Utara 66,90 67,49 88,49 89,90 11,51 10,10 Sumatra Barat 64,90 65,31 88,13 89,69 11,87 10,31 Riau 59,64 62,56 89,76 90,21 10,24 9,79 Jambi 64,26 65,18 93,38 93,78 6,62 6,22 Sumatra Selatan 69,64 69,03 90,67 90,66 9,33 9,34 Bengkulu 71,30 69,37 93,36 95,32 6,04 4,68 Lampung 67,47 69,60 90,87 92,42 9,13 7,58 Bangka Belitung 62,49 66,28 91,01 93,51 8,99 6,49 Kepulauan Riau 64,20 63,07 87,76 90,99 12,24 9,01 DKI Jakarta 64,92 64,95 88,60 87,43 11,40 12,57 Jawa Barat 61,41 62,50 85,41 86,92 14,59 13,08 Jawa Tengah 68,60 70,16 91,98 92,30 8,02 7,70 D .I . Yogyakarta 69,20 68,56 93,69 93,90 6,31 6,10 Jawa Timur 67,36 68,99 91,81 93,21 8,19 6,79 Banten 62,43 61,57 81,09 84,25 18,91 15,75 B a l i 76,33 77,38 93,96 96,23 6,04 3,77
Nusa Tenggara Barat 70,33 68,96 91,10 83,52 8,90 6,48
Nusa Tenggara Timur 74,36 74,28 96,35 96,28 3,65 3,72
Kalimantan Barat 73,71 72,47 91,47 93,53 8,53 6,47 Kalimantan Tengah 72,37 71,33 93,32 94,89 6,68 5,11 Kalimantan Selatan 70,43 73,15 91,13 92,38 8,87 7,62 Kalimantan Timur 67,27 61,76 86,57 87,93 13,43 12,07 Sulawesi Utara 59,20 61,97 85,38 87,65 14,62 12,35 Sulawesi Tengah 69,17 69,43 89,69 91,61 10,31 8,39 Sulawesi Selatan 59,08 61,07 87,24 88,75 12,76 11,25 Sulawesi Tenggara 66,61 67,44 90,33 93,60 9,67 6,40 Gorontalo 63,68 61,84 92,38 92,84 7,62 7,16 Sulawesi Barat 61,00 65,22 93,55 94,55 6,45 5,45 M a l u k u 60,95 63,01 86,28 87,80 13,72 12,2 Maluku Utara 72,41 67,24 83,10 93,95 6,90 6,05
Irian Jaya Barat 71,67 66,52 89,83 90,54 10,17 9,46
Papua 71,37 76,54 94,17 94,99 5,83 5,01
Sumber: Laporan Perekonomian Indonesia 2005, Sakernas , BadanPusatStatistik Source: Indonesia Economic Report ,Labour Force Survey , BPS
Catatan/Note:
1) Data tahun 2004 merupakan kondisi Agustus / condition August Data tahun 2005 merupakan kondisi Februari / condition February 2) TPAK : Tingkat Partisipasi Angkatan Kerja
3) TKK : Tingkat Kesempatan Kerja 4) TPT : Tingkat Pengangguran Terbuka
568 Jawa Barat Dalam Angka 2008 )
Tabel
Table 12.17
Produktivitas Pekerja Menurut Provinsi dan Komoditas
Productivity By Province and Commodity ( Juta Rupiah Per Pekerja / Million Rupiahs Per Worker )
2004-2006
2004 2005 2006
Provinsi Dengan Migas
Wi Province Tanpa Migas Without Oil Gas Dengan Migas With Oil Gas Tanpa Migas Without Oil Gas Dengan Migas With Oil Gas Tanpa Migas Without Oil Gas [1] [2] [3] [4] [5] [6] [7]
Nanggroe Aceh Darussalam 27,73 15,29 23,59 14,65 22,88 14,94
Sumatra Utara 17,15 17,01 18,05 17,91 19,21 19,07 Sumatra Barat 16,06 16,06 16,79 16,79 17,12 17,12 Riau 43,18 17,73 48,59 20,54 47,02 20,54 Jambi 10,74 9,35 11,47 10,05 12,11 10,64 Sumatra Selatan 16,23 11,64 16,74 12,25 17,28 12,90 Bengkulu 8,08 8,08 8,21 8,21 8,68 8,68 Lampung 9,12 8,89 9,46 9,28 10,07 9,91 Bangka Belitung 19,47 18,54 19,37 18,67 21,08 20,52 Kepulauan riau 59,25 55,43 59,17 55,66 62,92 59,40 DKI Jakarta 79,90 79,62 83,60 83,34 82,02 81,77 Jawa Barat 15,71 15,04 16,22 15,63 17,17 16,59 Jawa Tengah 8,72 8,17 8,98 8,39 9,68 9,04 D .I . Yogyakarta 9,44 9,44 9,64 9,64 10,02 10,02 Jawa Timur 13,69 13,66 14,27 14,24 15,35 15,31 Banten 16,85 16,85 17,82 17,82 18,95 18,95 B a l i 10,53 10,53 11,41 11,41 11,86 11,86
Nusa Tenggara Barat 8,36 8,36 8,19 8,19 8,14 8,14
Nusa Tenggara Timur 4,82 4,82 4,88 4,88 5,20 5,20
Kalimantan Barat 12,10 12,10 12,86 12,86 12,68 12,68 Kalimantan Tengah 14,60 14,60 14,15 14,15 15,73 15,73 Kalimantan Selatan 14,99 14,64 16,25 15,91 16,31 15,98 Kalimantan Timur 84,46 36,46 86,37 39,06 84,22 41,03 Sulawesi Utara 14,55 14,53 14,90 14,88 16,33 16,30 Sulawesi Tengah 10,65 10,65 12,23 12,19 12,25 12,15 Sulawesi Selatan 12,15 12,12 13,82 13,79 14,19 14,16 Sulawesi Tenggara 8,77 8,77 9,65 9,65 10,35 10,35 Gorontalo 5,85 5,85 6,22 6,22 5,97 5,97 Sulawesi Barat - - - - 8,27 8,27 M a l u k u 7,58 7,55 7,86 7,83 7,61 7,58 Maluku Utara 6,03 6,03 6,03 6,03 6,06 6,06 Papua Barat - - 19,89 14,67 19,77 14,98 Papua 13,28 13,28 22,94 22,94 21,57 21,57 Indonesia 17,63 16,03 18,39 16,87 19,35 17,84
Sumber : Laporan Perekonomian Indonesia 2005, Sakernas , BadanPusatStatistik Source : Indonesia Economic Report ,Labour Force Survey , BPS
Tabel
Table 12.18
Produk Domestik Regional Bruto Menurut Provinsi Dengan dan Tanpa Minyak&Gas Bumi
Gross Regional Domestic Product Including and Excluding Oil & It’s Product by Province
( Juta Rupiah / Million Rupiahs )
2007 *)
Berlaku Konstan
Provinsi Dengan Migas
With Oil Gas
Tanpa Migas
Without Oil Gas
Dengan Migas
With Oil Gas
Tanpa Migas
Without Oil Gas
[1] [2] [3] [4] [5] NAD 73 196 269,97 51 821 083,65 36 038 113,96 26 077 224,13 Sumatra Utara 181 819 737,32 180 375 387,52 99 792 273,27 99 085 667,37 Sumatra Barat 59 799 045,30 59 799 045,30 32 912 968,59 32 912 968,59 Riau 210 002 560,30 117 034 983,66 86 213 259,46 39 420 760,09 Jambi 32 076 677,16 26 193 640,61 14 275 161,32 12 775 067,05 Sumatra Selatan 109 895 707,33 74 905 270,33 55 262 115,12 42 106 150,12 Bengkulu 12 820 320,84 12 820 320,84 7 008 964,56 7 008 964,56 Lampung 60 921 966,22 59 485 485,51 32 694 889,62 32 231 943,08
Kep , Bangka Belitung 17 895 016,56 17 369 399,15 9 465 062,04 9 257 538,62
DKI Jakarta 566 449 345,25 563 813 252,13 332 971 262,92 332 033 920,39 Kepulauan Riau 51 826 271,88 47 420 368,70 34 713 813,64 32 937 720,13 Jawa Barat 526 220 225,16 501 445 228,72 273 995 144,93 265 834 045,02 Jawa Tengah 312 428 807,09 272 614 733,52 159 110 253,77 149 083 138,77 DI, Yogyakarta 32 916 736,41 32 916 736,41 18 291 511,71 18 291 511,71 Jawa Timur 534 919 332,96 533 367 054,39 287 814 183,92 286 912 118,57 Banten 107 431 957,88 107 431 957,88 65 046 775,77 65 046 775,77 B a l i 42 336 424,40 42 336 424,40 23 497 047,07 23 497 047,07
Nusa Tenggara Barat 33 518 590,63 33 518 590,63 16 365 475,72 16 365 475,72
Nusa Tenggara Timur 19 136 982,17 19 136 982,17 10 902 404,44 10 902 404,44
Kalimantan Barat 42 478 600,88 42 478 600,88 26 260 647,97 26 260 647,97 Kalimantan Tengah 27 920 072,34 27 920 072,34 15 754 508,67 15 754 508,67 Kalimantan Selatan 39 438 767,06 38 852 763,34 25 922 287,52 25 453 963,22 Kalimantan Timur 212 096 643,69 93 810 267,50 97 803 248,21 52 412 869,46 Sulawesi Utara 24 274 030,03 24 248 993,84 14 407 302,07 14 382 447,53 Sulawesi Tengah 21 743 606,01 21 280 072,07 13 683 882,37 13 467 249,37 Sulawesi Selatan 69 271 924,56 69 107 119,49 41 332 426,29 41 242 732,68 Sulawesi Tenggara 17 953 074,41 17 953 074,41 9 331 719,95 9 331 719,95 Gorontalo 4 760 695,43 4 760 695,43 2 339 217,51 2 339 217,51 Sulawesi Barat 6 192 785,56 6 192 785,56 3 567 816,12 3 567 816,12 M a l u k u 5 698 799,37 5 682 667,38 5 698 799,37 5 682 667,38 Maluku Utara 3 160 041,71 3 160 041,71 2 501 175,13 2 501 175,13
Irian Jaya Barat 10 369 836,11 7 452 203,55 5 934 315,82 4 566 066,15
Papua 55 365 777,53 55 365 777,53 19 176 080,16 19 176 080,16
Indonesia 3 526 336 629,53 3 172 071 080,55 1 880 084 108,
99
1 737 919 602,51Sumber : Badan Pusat Statistik *) Angka sementara / Preminary figures
![Tabel Table 12.6 Lanjutan Continued Pengeluaran Riil/capita Disesuaikan (Rp.000) IPM Peringkat Provinsi/Pulau Province/Island 2005 2006 2005 2006 2005 2006 [1] [8] [9] [10] [11] [12] [13]](https://thumb-ap.123doks.com/thumbv2/123dok/4131970.2820320/10.918.142.857.164.1030/lanjutan-continued-pengeluaran-disesuaikan-peringkat-provinsi-province-island.webp)