EMITTER International Journal of Engineering Technology Vol. 3, No. 1, June 2015 ISSN:2443-1168
Copyright © 2015 EMITTER International Journal of Engineering Technology - Published by EEPIS 68
CFD Analysis of Nozzle Exit Position Effect in Ejector Gas
Removal System in Geothermal Power Plant
Setyo Nugroho, Ciptananda Citrahardhani
Power Plant Technology, Electronic Engineering Polytechnic Institute of Surabaya Jalan Raya ITS Sukolilo, Surabaya 60111
[email protected], [email protected]
Abstract
The single stage ejector is used to extract the Non CondensableGas (NCG) in the condenser using the working principle of the Venturi tube. Three dimensional computational simulation of the ejector according to the operating conditions was conducted to determine the flow in the ejector. Motive steam entering through the convergent – divergent nozzle with increasing flow velocity so that the low pressure exist around the nozzle. Comparison is done also in a two dimensional simulation to know the differences occurring phenomena and flow inside ejector. Different simulation results obtained between two dimensional and three dimensional simulation. Reverse flow which occurs in the mixing chamber made the static pressure in the area has increased dramatically. Then the variation performed on Exit Nozzle Position (NXP) to determine the changes of the flow of the NCG and the vacuum level of the ejector.
Keywords: Ejector, NCG, CFD, Compressible flow.
1. INTRODUCTION
Geothermal energy produced high pressure hot steam that could turn the turbine as the main source of geothermal power plant. The steam that produced by the production well consists of substances and also moisture which were different for each well. One of the gas characteristics that contain in geothermal source is Non Condensable Gas (NCG). Which why when condensation steam came out of the turbine, NCG gathered in condenser that made the condenser vacuum pressure decrease and made the turbine work come down.
turbine will generate more power. Therefore NCG accumulated in the condenser must be extracted in order to keep the pressure in the condenser.
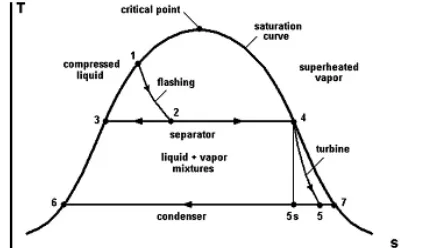
Figure 1. T-s Diagram for Geothermal Power Plant
Geothermal power plant used Gas Removal System (GRS) for extract NCG from the condenser. One of the main GRS components was Steam Jet Ejector as the first step of extraction. Ejector used Venturi tube principle; it used geothermal energy as NCG extractor. The pressure that given by the geothermal energy affecting the suction ejector pressure, so the ejector only worked at some inlet nozzle condition.
When the outlet ejector condition was unknown, it was necessary to use computational analysis. To get the properties, simulation was conducted to consider ejector operational condition by applying the exist properties. The changes of the property based on little relative time means that the ejector condition was considered steady. Motive steam was assumed in vapor state because the NCG that contained inside only 1% and the rest was CO2, because
95% NCG was CO2. There was no leak in the system; the analysis used fluid
mechanics and ignoring thermodynamics sides. The observe component was ejector 65% duty as operated in real condition.
Compressible Flow
This is a flow in which there are significant or noticeable changes in fluid density. Just as invisvidfluids do not actually exist, so in incompressible fluid do not actually exist. The consequences of compressibility are not limited simply to density changes. Density changes mean that a significant compression or expansion work exist on a gas, so the thermodynamic state of the fluid will change, meaning that in general all property like temperature, internal energy, entropy, and so on can change. Density changes create a mechanism for exchange of energy between mechanical and the termal internal energy
70 flow velocity reached su nozzle so the pressure wa sucked in the ejector. In m the pressure increase a s
al Journal of Engineering Technology, ISSN:2443-1168
fluid flow. This equation below is for determin
the Navier-Stokes equations for incompressible Ne ty divergence, 0 , was explicitly used to obtain f a symmetric stress tensor that is linear in the low velocities become a finite fraction of the v cussed beforeno longer possible to maintain the sim ven effective incompressibility. For truly compressi
-vanishing, and the simple divergence condi place it by the continuity equation. Inserting the o Cauchy’s equation of motion then:
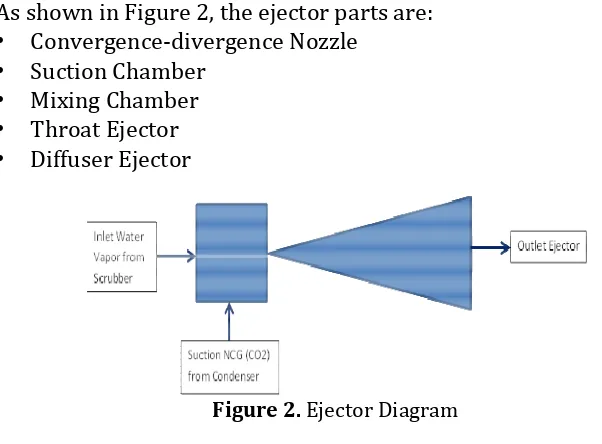
Figure 2 worked with Venturi principle. The moti with a nozzle to gain suction pressure in suction p
steam was process to be kinetic energy. The moti eached supersonic when leaving convergence essure was very low that made CO2, which mostly w
ctor. In mixing chamber, the steam was mix byCO rease a slightly. In subsonic diffuser part, the mi
so the pressure was increase in the outlet. n Figure 2, the ejector parts are:
-divergence Nozzle Chamber
Chamber Ejector r Ejector
Figure 2. Ejector Diagram
Based onSafarudin (2011) the CO2 flew from suction part was because
the condition of suction ejector had higher static pressure than inside the mixing chamber. This condition was the result of compression effect in nozzle outcome flow which affects the amount of nozzle main flow. In suction pressure condition which conditioned steady for all variation with -0.69 Barg, the increasing of inlet nozzle pressure caused the forming of main motive steam faster. It was because the effect of nozzle outcome flow as in expanded condition, had velocity that almost supersonic, with larger fluctuative pressure condition.
2. RELATED WORKS
In previous work, there is a research which performed 2D CFD simulation in order to obtain the pressure distribution along the ejector (Safarudin, 2011). The 2D simuation input of the simulation will based this research input and those results will be compared with this research’s result which will perform the 3D CFD simulation.
In 2D simulation, most of the motive steam will directly flow to the downstream. There is no 3D effect in the flow, so the swirl of the flow was not significant.The flow phenoma will determine the pressure distribution along the ejector, so this research will compare the pressure distribution between 2D and 3D CFD simulation.
3. ORIGINALITY
The research was conducted to look at phenomena that occur in motive steam and NCG and the performance of the ejector shown with a vacuum on the suction side of the ejector. The object of research is an ejector on Gas Removal System GPP IV. Kamojang. Required simulated computationally efficient to run ejector using existing operating data. In the industrial world it is often used as an option to determine the performance of the components were observed without terminating the system running. So the savings in terms of cost and time to do.On this project performed at the ejector 3D simulations to determine the flow that occurs in the ejector. Using the operating data as initial data simulation. Simulations were approached with the actual conditions by describing the geometry in full scale.Variations performed on this project aims to see whether there was an increase perfromance of ejector is shown by the decrease in pressure at the suction. The variables are changed on the length of extension so the nozzle exit position change which will influence the pressure at the outlet of suction.
4. SYSTEM DESIGN
72 Volume 3, No. 1, June 2015
EMITTER International Journal of Engineering Technology, ISSN:2443-1168
Geothermal Energy as seen in the Figure 3.Modeling method was set to get the result which almost like the operational condition, the operational data should be valid so it would produce small percentage of error. The CFD modeling input data was given as shown in the Table 1.
Figure 3. Geometry Ejector
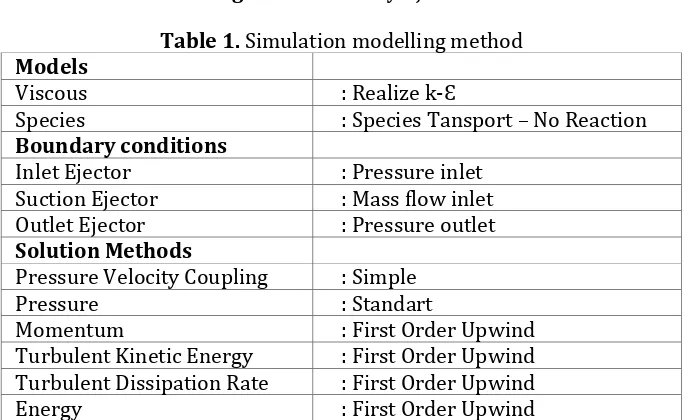
Table 1. Simulation modelling method
Models
Viscous : Realize k-Ɛ
Species : Species Tansport – No Reaction
Boundary conditions
Inlet Ejector : Pressure inlet Suction Ejector : Mass flow inlet Outlet Ejector : Pressure outlet
Solution Methods
Pressure Velocity Coupling : Simple
Pressure : Standart
Momentum : First Order Upwind
Turbulent Kinetic Energy : First Order Upwind Turbulent Dissipation Rate : First Order Upwind
Energy : First Order Upwind
The input boundary condition used operational data which taken on July 21th to 27th 2014 in Kamojang geothermal powerplant unit IV. The
were conducted by comparing the simulation results and the operational conditions of the powerplant as shown in Table 2.
Table2. Comparison between operation conditions with CFD Simulation Actual Conditions CFD Simulation mass flow inlet nozzle (kg/s) 1,315 1,389 mass flow inlet suction (kg/s) 0,6637 0,6637 Inlet static pressure (Pa) 1.085.675,1 1.083.485,5 Suction static pressure (Pa) -0,69 -0,6876
Outlet static pressure (Pa) - -0,475
Fluid material modeling was use to get simulation output that close to observation data which shown in the Table 3. The value of heat capacity and dynamic viscosity from water-vapor and CO2 was based from journal [1]
which has the same material and basic observation. Otherwise, the density of water-vapor was specially used to get the right modeling. Modeling of compressible flow of water-vapor was conductedin order to get the best simulation results. There are no references about modeling the compressible flow. Simulations performed repetitive to get the right CFD setting that the results of the simulation can be convergent. The setting performed in control solution of the simulation. Setting the wrong simulation will cause divergent result.Fluid materials modeling that chosen are shown in Table 3.
Table 3. Fluid Material Modelling
Working fluid Water-vapor
(H2O) NCG (CO2) Mixture template
Density (kg/m3) Compressible liquid
1.7878 (default)
volume weighted mixing law Heat Capacity Cp. (j/kg-K) 2786.19 856.99 Mixing - law Viscosity din. (kg/ms) 1. 5221e-05 1.37e-05 Mixing - law
74 Volume 3, No. 1, June 2015
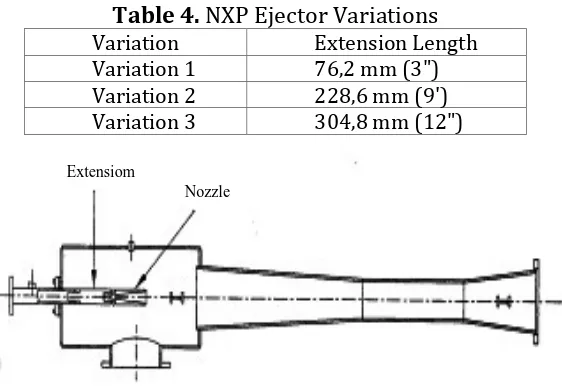
EMITTER International Journal of Engineering Technology, ISSN:2443-1168 Table 4. NXP Ejector Variations
Variation Extension Length Variation 1 76,2 mm (3") Variation 2 228,6 mm (9') Variation 3 304,8 mm (12")
Figure 4. Extension position in the ejector
The input properties material of working fluid and the definition of input and output fluid flow boundary as shown in Table 5 which shown the simulation input for inlet ejector pressure with 10.8 Barg.
Table 5. Simulation’s input
Inlet Ejector Suction Ejector Outlet Ejector Boundary Condition Pressure inlet Mass flow inlet Perssure outlet Static Pressure (Pa) 1.085.675 16.000 To be varied
Mass Flow (Kg/s) - 0,663 300 (default)
Temperature (K) 467,65 316,31
Turbulance model Intencity& DH K and Epsilon K and Epsilon
Hydrolic Diameter (m) 0,102 - -
Turb. Intencity 2 - -
Turb. Kin. Energy - 1 (default) 1 (default) Turb. Dissipation - 1 (default) 1 (default)
5. EXPERIMENT AND ANALYSIS
Expansion motive steam proceed by nozzle ejector was done by increasing the flow velocity into supersonic which shown in Figure5. The increasing occured in the inlet ejector with 47.8 m/s until the outlet ejector outburst had 1200 m/s. It was occur because the function of convergence-divergence ejector. The nozzle mostly used in ejector to convert the velocity of the flow. The effect caused the pressure around nozzle decreasing even smaller than in suction ejector which suitable with Venturi tube principle.
Extensiom
Figure 5. The velocity contour in nozzle ejector
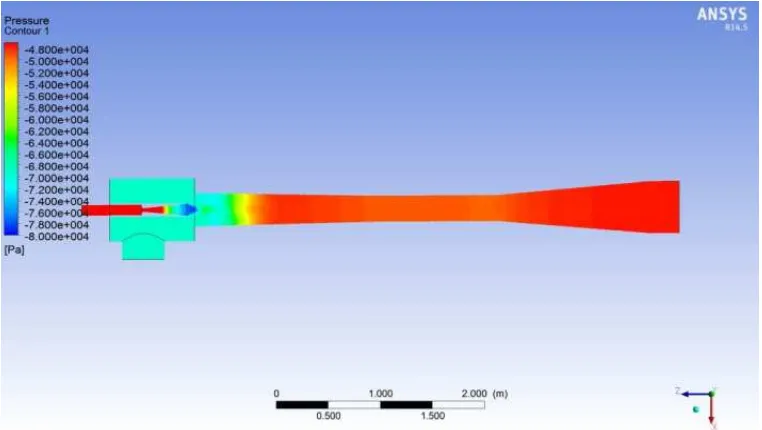
The expansion pressure effect caused NCG flown from suction into ejector because the static pressure was higher than in the mixing chamber ejector which was -0.78 Barg. It also shown in Figure6, which the outlet nozzle flow had lower static pressure then in the suction ejector. The static suction pressure was kept to be steady in -0.69 Barg which was the constant pressure in condenser. Static pressure contour happened until the mixing chamber, which was place of motive steam and CO2 mixed. In throat until
ejector diffuser part the static pressure distribution still had small changes. It was because the difference between mixing chamber and diffuser ejector surface area, it made the mixing flown has very small velocity changes.
76 happened in normal shock pressure was not dram simulation it was dramati the different CO2 flown di
the same direction with m direction was perpendicu with the ejector geometry normal shock wave happ between surface areas.
Figure 7.Static Pr
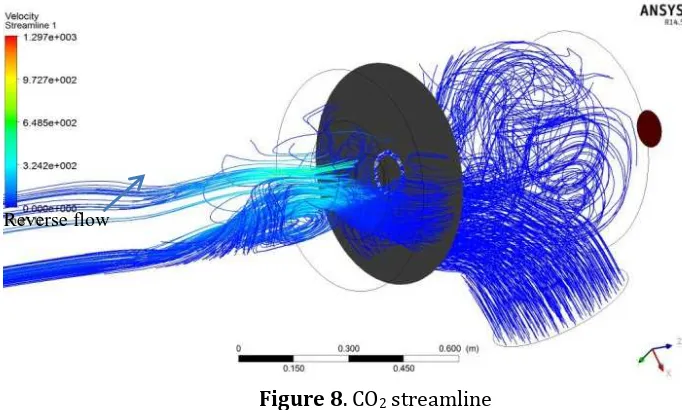
In certain position in have through normal sh dramatically because of m The changes caused by rev Figure8. The reverse flow velocity decreasing and a that part.
Volume 3, No. 1
al Journal of Engineering Technology, ISSN:2443-1168
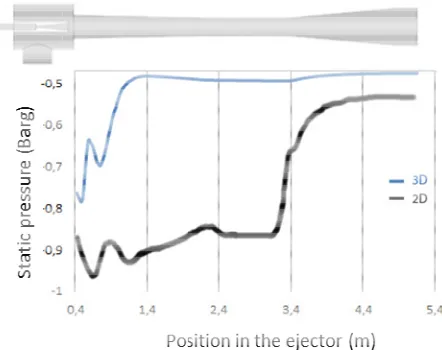
rison was done in the literature with the same obs different simulation method, which used two dim Figure7. The static pressure had been plot alo o dimensional static pressure was lower tha mulation. It because the different boundary m
in two dimensional the pressure was lower. The d rmal shock wave mixing flow. In two dimensional t not dramatically increase, instead in three dim s dramatically increase in mixing chamber. It was
flown direction where in two dimensional the flo on with motive steam, instead in three dimensional erpendicular with motive steam flown which was geometry. In the two dimensional simulation sh
ave happened in diffuser part because of the areas.
Static Pressure Distribution Graph along x-axis ejector
position in mixing chamber, the water-vapor and CO ormal shock wave, where the static pressure i cause of mixing flow velocity from supersonic to
sed by reverse flow phenomenon in CO2 flow which
Figure 8. CO2 streamline NXP VARIATION AGAINST VACUITY LEVEL
Figure 9. Vacuity pressure
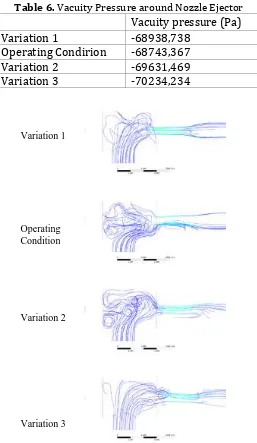
The ejector vacuity depends on NXP which could increase the ejector performance (Safarudin, 2011). The changes of NXP were done by changing the extension of nozzle as shown in Figure9. The third variations had the lowest static pressure which the NXP placed inside the mixing chamber. Besides the actual NXP had the highest vacuity static pressure than the other. The increasing vacuity pressure happened in the ejector, so the ejector performance could increase by make the extension longer from the nozzle.The higher ejector vacuity pressure, the many NCG that inhaled. It
78 Volume 3, No. 1, June 2015
EMITTER International Journal of Engineering Technology, ISSN:2443-1168
made the static pressure in condenser can be maintained. A 12” expansion used when the NCG in geothermal steam increased. The NCG streamline shown in Figure10, the third variations had smoother flow than the other in the actual condition. NCG directly extracted and came into the mixing chamber where the vacuity placed. For others, the maximum vacuity still in the body ejector, so the NCG was accumulated. Those made first vacuity variations, second, and actual condition had higher vacuity pressure.
Table 6. Vacuity Pressure around Nozzle Ejector
Vacuity pressure (Pa)
Variation 1 -68938,738
Operating Condirion -68743,367
Variation 2 -69631,469
Variation 3 -70234,234
Figure 10. NCG streamline 6. CONCLUSION
Convergence-divergence nozzle in the ejector used to increasing the motive steam flow velocity from subsonic to supersonic. Based on Venturi tube principle the static pressure in motive steam way would be smaller. The
Variation 1
Operating Condition
Variation 2
different pressure in the area with suction ejector caused NCG in condenser expanded to the ejector. The NCG flow direction which perpendicular by the motive steam made the normal shock wave happened sooner in mixing chamber. In two dimensional simulation, the normal shock wave happened in diffuser ejector because of the different between throat and ejector surface area. But the physical phenomenon between two dimensional and three dimensional simulation which shown in the graph was same. NXP in mixing chamber caused the NCG directly go to the area. The area around the ejector could be more vacuity until the more extracted NCG came in. This NXP is suitable for use when NCG on geothermal steam increases. It can also be used to decrease the pressure in the condenser. The more NCG extracted in the condenser, the pressure in the condenser will decrease. Based on Rankine’s cycle as shown in Figure 1, the decrease of pressure in condenser will cause the enthalpy from the outlet of turbine will decrease and it means more power can be generated by the turbine. So performance of the turbine can be increases and the total efficiency of geothermal power plants can also be increased as well.
Acknowledgements
Thanks to Geothermal Power Plant IV. Kamojang PT Pertamina Geothermal Energy which has allowed the simulation data so that simulations can be done well. And also thanks for major of Power Plant Technology at Electronic Engineering Polytechnic Institute of Surabaya that has provided the laboratory so that it can be simulated
REFERENCES Proceeding:
[1] NurdanYıldırımÖzcan, GüldenGökçen, Performance Analysis of Single-Flash Geothermal Power Plants: Gas Removal Systems Point of View, Proceedings World Geothermal Congress, Bali, pp. 1-2, 2010 [2] Bagus Suherman,Power Electronics, Cahaya Offset (Surabaya), Ed. 1,
pp. 11-13, 2003.
[3] Hall, N. R.,Gas extraction system, Lecture notes of Geothermal Utilisation Engineering Geothermal Institute, 1996.
[4] Installation, Operation & Maintenance Manual Nash Model 3/018-2-0BP Geothermal Gas Removal System Kamojang Geothermal Power Plant
[5] KMJ-20-X2-ES-001-S Rev 3_Specification for Gas Removal, 2007. [6] P&Id REV 4 ASBUILT, 2007.
[7] Safarudin Dian, Prabowo,SimulasiCFD PadaVariasiTekanan Inlet Nozzle Ejector Terhadap Tingkat Ke-Vacuum-An Steam Ejector Di Unit Pembangkitan Listrik Tenaga Panas Bumi, Thesis, ITS
(Surabaya), 2011.
80 Volume 3, No. 1, June 2015
EMITTER International Journal of Engineering Technology, ISSN:2443-1168
[9] Heat Exchange Institute, Standards For Steam Jet Vacuum Systems Fifth edition, Ohio, 2000