Vol. 3 No.1 Januari 2017
The Efforts for Productivity and
Income Improvement of Rice
Farming Through the Use New
Superior Variety (Case Study)
DOI: 10.18196/agr.3142
ABSTRACT
Various efforts to increase rice production have been done in order to achieve rice self-sufficiency and food security, one of which is the creation of some New Superior Vari-eties (NSVs) of paddy. This study aimed to analyze the productivity, income, and effi-ciency of rice farming of New Superior Va-rieties, including Inpari 29, Inpari 31, and Inpari 32. This research was conducted on December 2014 until April 2015 in SubakGubug I, Gubug village, as one of the centers of rice production in Tabanan Re-gency. The study involved 30 farmers who planted those three new superior varieties in 9.38 hectares of wet land area. Each farmer used as replicates. Data were col-lected using interview and direct observa-tion. Data was analyzed by Analysis of Vari-ance (ANOVA). The results showed that
Inpari 31 variety have the highest productivity, the highest revenue, the most efficient, and significantly different from the Inpari 29 and 32. Multiplication and dissemination of Inpari 31 variety to farmers can be done as soon as pos-sible to increase rice production, achieve rice self-sufficiency and food security. K
K K K
Keywordseywordseywordseywordseywords: efficiency, inpari,paddy,productivity
INTRODUCTION
Efforts to achieve self-sufficiency and food security, particularly rice, ahead looks set to face tough challenges, due to rapid population growth and conver-sion of paddy fields.In another aspect, the paddy soil fertility declines as man-agement intensifies less attention to the balance of nutrients in the soil. The success of efforts to increase production, productivity and income of farmers depend on the ability of the provision and adoption of production technolo-gies that include improved varieties, seed quality, and other related technologi-cal innovations (Jamal, 2009). Sembiring and Widiarta (2008) stated that, the success of increasing rice production was dominated by increasing in produc-tivity than an increase in harvested area.
Various technological innovations have been produced as an effort to in-crease production, productivity, and income of rice farming, one of which is the creation of new superior varieties of paddy. High yielding varieties of paddy is believed to be one of the success key of increasing rice production (Sembiring and Widiarta, 2008; Hossain et al., 2006). Suwarno (2000) stated that, variet-ies of paddy have been able to increase the productivity of rice. Similar dis-closed by Las (2002) inSusanto et al. (2003) that, the role of varieties along with fertilizer and water to increase productivity reached 75%. Furthermore, Suhartatik and Makarim (2010) revealed that the superior varieties have high yields because they have physiologicalcharacter in accordance with its environ-ment.
increasing. Ciherang productivity on average 6.2 t/ha. IndonesianAgency for AgricultureResearch and Development (IAARD) until now been widely released several new supe-rior varieties(NSVs) of paddy. There are several objectives of the creation and release of several varieties of rice, two of which are (1) an effort that the farmers can make rotation of varieties, which is expected to cut the cycle of pests and (2) to increase rice production.Related to some NSVs of paddy being created by IAARD, in which there are varieties Inparitypes, three of which are Inpari 29, 31, and 32.
The new superior variety (NSV) of Inpari 29 is suitable to be planted in irrigated rice lowlands paddy fields to an altitude of 400 m above sea level. This NSV is also resistant to immersion of flooding. The NSVs of Inpari 31 and 32 are suitable to be planted in lowland paddy fields to a height of 600 meters above sea level. The NSV of Inpari 29 was re-leased in 2012, while the NSVs of Inpari 31 and 32 were released in 2013. Those varieties were introduced through assessments in SubakGubug I in 2014 and not yet available at the market. This study aimed to analyze the productivity, income, and efficiency of those new superior varieties.
METHOD
This study was conducted in SubakGubug I, in the Gubug village, Tabanan Regency, in December 2014 until April 2015. Tabanan is the largest rice producer in Bali province. The number of respondents in this study were 30 farmers who determined by random sampling. They were implemented the assessment of NSVs of Inpari 29, 31, and 32. Each vari-ety is planted by 10 farmers. Respondents were divided into three groups according to the NSV of paddy planted. Each group consisted of 10 farmers.
Primary data were collected by a survey method, which interviewed respondents directly using a structured question-naire (Sangarimbun and Effendi, 1989). The primary data include a land area, number and type of means of produc-tion, total costs of producproduc-tion, amount of producproduc-tion, price of grain/kg, etc. The secondary data were obtained from the results of previous research related to the research.The vari-ables measured were limited to the amount of rice produc-tion whichwas obtained in the form of dry grain harvest and the amount of revenue and income are received by farmers. The average difference in production and revenues of those varieties were analyzed by analysis of variance (Sugiyono, 2011).
The rice farming profit can be determined by calculating the margin of the total revenue and total rice farming costs. Total revenue is the amount of grain production multiplied
by the price per kilogram of grain. Total cost is all expendi-ture that used in the production process of rice farming, in the form of fixed costs and variable costs. Mathematically, farming profits formulated (Soekartawi, 1995), as follows:
I = TR - TC
= P.Q – (FC + VC)
where,
I = income (profit);P = the price of per unit rice produc-tion; Q = total rice producproduc-tion;FC = fixed cost; VC = vari-able cost
The level of efficiency of rice farming analyze using R/C ratio, mathematically is formulated as follows:
TR R/C ratio =
TC
where,
TR = total revenue; and TC = total cost
The average difference of rice production and its incomes were analyzed by analysis of variance (ANOVA) by F-test for more than two groups of samples. Its hypothesisis:
1. H0: μ1 = μ2 = μ3, that means the average difference in grain production and rice farming income between groups is not significant.
2. H1:at least two average values are different,that means the average difference in grain production and rice farming income between groups is significant.
The steps in to test the hypothesis by ANOVA, include (Wibisono, 2009):
1. Variance between groups is formulated as follows:
1
2. Variance within groups is formulated as follows:
1
Si2 = ∑ (Xij - i)2 ……….. (2)
ni - 1
3. Variance of population is formulated as follows:
∑ (ni – 1) Si2
St2 = ……….. (3)
r (n – 1)
4. Value of distribution F (F-count) can be obtained by the formula:
n.S2
F-count = ……….... (4) St2
Where,
r = number of groups
Y« = mean of all groups
n = the number of samples in each group Xij = value of each observation
Furthermore, the value of the F-count compared with the F-table:
If F-count > F-table: H0 is rejected if F-count < F-table: H0is accepted
If the F-test results show that between samples have an average difference is significant, then followed by Least Sig-nificant Differences (LSD) test. Value of LSD is obtained from the following equation:
LSDα = (tα, dfe). 2 (MSe) ……….... (5)
r
where,
tα = distribution of t-student dfe = degree of freedom error MSe = mean squares error
RESULTS AND DISCUSSION
SubakGubug I is located in the lowlands and the semi technical irrigated land.SubakGubug I has 234 hectares of wet land and 749 farmers, so that every farmer managed 0.35 hectares wet land in average. The cropping pattern is applied in a year is paddy - crops - paddy. The first rice planting sea-son is in rainy seasea-son, on November to February, the second rice planting is in dry season, on June to September, and on March to Junethe farmers plant crops.
THE USING OF LABOR
Labor allocated in managing rice farming comes from farmer’s family and outside the family. The employment of family activities is generally devoted to sow, irrigate, fertilize, control pests and diseases, and clean up the embankment.The activities of tilling the soil, planting paddy, and weeding us-ing labor from outside the family. Weedus-ing jobs are paid based on the number of working hours, while the paddy planting and tilling the soil is done in bulk by area (per hectare). Till-age is done by a tractor.
Among three groups of samples, group of farmers who planted NSV of Inpari29used the least labor (Table 1).Farm-ers who plant NSV of Inpari 29 using the least amount of labor, because most of them are the main livelihood outside of the agricultural sector, such as hotel employees and con-struction workers.
TABLE 2. THE TYPE AND NUMBER OF PRODUCTION FACILITIES PER HECTARE
Source: Primary Data (analyzed)
The using of urea more than recommended but using of nitrogen, phosphate, and potassium (NPK) less than recom-mended. Department of Agriculture Tabanan Regency rec-ommended 100 kilograms per hectare for urea and 300 kilo-The planting and weeding is done by workers from out-side the family and most of them are women, because of the availability of labor in the family is very limited (an average of two people per farm household) and most of farmers also work in other sectors, such as in the tourism sector, build-ings, etc. The Harvesting carried out by workers coming from outside of Bali, because the local harvest labor is limited.
PRODUCTION FACILITIES
In rice farming, the type of production facilities that are used in addition to labor, are seed, fertilizer, and pesticides. The use of production facilities in the type, amount, and timing will be able to provide maximum production. The amount of seed which used an average of 38.75 kilogram per hectare for the farmers who planted NSV of Inpari 29 (Table 2). This amount exceeds the recommended, namely 30 kilo-grams per hectare. Farmers tend to use beyond recommended because they anticipated for replanting if there are plants die.
TABLE 1. THE USING OF LABOR PER HECTARE
grams per hectare for NPK. Improper using of fertilizers which will have an impact on rice production is not optimal.
PRODUCTION COST
The production cost of rice farming in the study site, con-sists of fixed cost and variable cost. The fixed cost includes property tax, subak dues, depreciation of equipment, and offerings. The variable cost consists of the purchase of seeds, fertilizers, pesticides, and labor (Table 3). Expenditures are calculated as cost of production in this paper is all expenses paid in cash, while no cash cost is not included in the analy-sis, such as labor within family.
Tillage and planting paddy are paid by the piece (one hectare = Rp 1,200,000), while weeding is paid as a daily labor (one day = 8 hours) with a wage of Rp 80,000 per per-son days. Wages harvest is Rp 60,000 per quintal of grain. Among the production cost components, harvesting needed the highest cost that is in average 44.67% depending on the amount of rice production is obtained, while depreciation of equipment needed the lowest cost, so that in average 0.92%. The farmers group who planted NSV of Inpari 31 needed the highest cost of production, while the farmers group who planted Inpari 32 needed the lowest production cost.
The total cost of rice farming is not determined by the variety of paddy, but depend on the habits of farmers. Farm-ers in the research site seems to have not been able to man-age his farm efficiently. The using of seeds and urea fertilizer were higher than the recommended.
Rice Production
The rice harvest was done in the early to mid-April 2015 after the rice plants aged 105-115 days after planting. The production is observed in real plot yields, in the form of dry grain harvest. The results showed that, NSV of Inpari 31 have the highest productivity, while NSV of Inpari 29 have the lowest productivity.Productivityof Inpari 31 is 7,698 kg/ ha;Inpari 32 is 7,149kg/ha; and Inpari 29 is 6,909 kg/ha.
The results of this study differentwith Jamil et al. (2015) whose states that, NSV ofInpari 29 has a higher yield than NSVs of Inpari 31 and 32. According to Jamil (2015), NSV of Inpari 29 had an average yield of 6.5 tons/ha; NSV of Inpari 31 has yield on average 6 tons/ha; and the yield ofInpari 32 on average 6.3 tons/ha. The differences are guessed to be affected by agro-ecosystem and farmer’s management. Farm-ers who plant NSV of Inpari 29 using a large excess of urea fertilizer, that’s why the intensity of pests and diseases is quite high and many plants are fall down. According to Wahid (2003) the excess fertilizer N in rice can increase pests and diseases, plant fall down, and extend the life of the plant.Kasniari and Supadma(2007) stated that, excessive N fertilizer also have an impact on the increasing number of empty grain that affect rice production to be low.
Revenue and Incomeof RiceFarming
The farming system is not only focused on the produc-tion and productivity aspects, but also on the revenue as-pect. The production process of farming system combined various production factors under their control, basically aims
TABLE 3. THE COST OF RICE FARMING PER HECTARE IN SUBAKGUBUG I IN DECEMBER 2014
Type of cost Sum of cost (Rp)
Inpari 29 Inpari 31 Inpari 32
Fixed costs
a. Property tax 150,000 150,000 150,000
b. Subak dues 100,000 100,000 100,000
c. Depreciation of equipment 90,667 90,222 86,667
d. Offerings 296,500 290,000 275,000
Sub-total 637,167 630,222 611,667
Variable costs
a. Seed 297,053 303,285 299,204
b. Urea 487,680 440,440 448,445
c. Nitrogen, phosphate, and potassium (NPK) 642,633 650,644 645,583
d. Pesticides 617,261 655,834 665,828
e. Labor (tillage, plant, and weeding) 3,493,600 3,498,400 3,538,400
f. Harvesting 4,145,538 4,619,125 4,289,491
Sub-total 9,683,765 10,167,728 9,483,351
Total cost 10,320,932 10,797,950 10,095,018
to acquire several outputs, revenue, and profit. Farm revenue is the total value of farm products within a specified period, whether sold or not sold. Farm income (profit) is margin between total revenues and total production costs (Soekartawi, 1995). Prices farmers receive an average Rp 4,243 per kilogram, in the range of Rp 4,100 to Rp 4,500per kilo-gram.
TABLE 4. THE REVENUE, COST, AND PROFIT OF RICE FARMING PER HECTARE
Commentary Amount (Rp)
Inpari 29 Inpari 31 Inpari 32
Revenue 28,948,329 33,231,471 30,258,280
Cost 10,320,932 10,797,950 10,095,018
Profit 18,627,397 22,433,520 20,163,262
RC ratio 2.81 3.08 3.00
Source: Primary Data (analyzed)
Table 4 showed that, NSV of Inpari 31 provides the high-est revenue and income. The NSV of Inpari 31 is also the most efficient. Revenues, income, and efficiency of rice farm-ing system are influenced by the number and types of pro-duction factors, the price of propro-duction factors, and product prices is received by farmers.
THE RESULTS OF ANALYSIS BY ANOVA
Paddy productivity
Based on an analysis of variance is known that value of F-count is 8.361, while F-table is 5.488 (F-F-count > F-table) with a value of p = 0.001 (p < 0.01). There are differences in means productivity among those varieties (Table 5). Therefore, H0 is rejected or H1 is accepted.
TABLE 5. THE RESULT OF ANOVA ANALYSIS FOR PADDY PRODUCTIVITY
Sum of Squares DF Mean Square F Sig.
Between Groups 3,274,687 2 1,637,343 8.361 0.001 Within Groups 5,287,423 27 195,830
Total 8,562,110 29
Source: Primary Data (analyzed)
Based on the results of ANOVA analysis (Table 5), then followed by Least Significant Differences (LSD) analysis. The
results of LSD analysis showed that,means productivity of Inpari 31 was significantly different with the two other vari-eties (p < 0.01). But, between NSVs of Inpari 29 and Inpari 32 had no significant which was showed by p = 0.236 (p > 0.05) (Table 6).
The result indicates (Table 6) that, NSV of Inpari 31 is the most appropriate variety with the agro-ecosystem in SubakGubug I, so it has the best performance among those varieties.The NSV of Inpari 31 has the greatest opportuni-ties develop in areas that have the same agro-ecosystem with SubakGubug I.
TABLE 6. THE RESULT OF LSD ANALYSIS FOR PADDY PRODUCTIVITY
(I)
varieties and its mean productivity
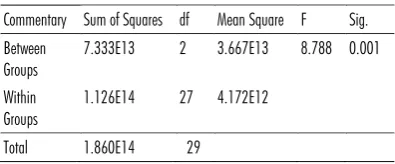
The result using analysis of variance (Table 7) showed that, the average revenues ofInpari 31 were significantly dif-ferent from the two other varieties. Value of F-count is 8.788 but F-table is 5.488 (F-count > F-table) with a significance level (p) = 0.001(p < 0.01).
TABLE 7. THE RESULT OF ANOVA ANALYSIS FOR RICE FARMING PROFIT
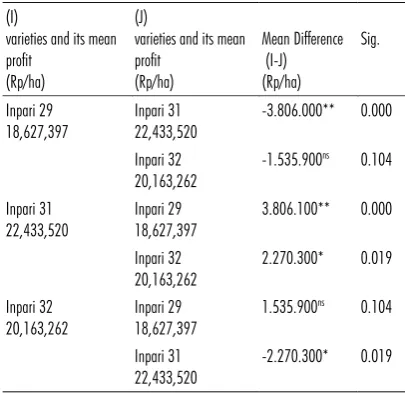
Based on the results of ANOVA analysis (Table 7), then followed by LSD analysis. The results of LSD analysis showsthat, means income difference of Inpari 31 and Inpari 29 was significantly at level error 1% (p = 0.00; p < 0.01) Means income difference between of Inpari 31 and 32 was significantly at level erros 5% (p = 0.019; 0.05 < p < 0.01). But, between Inpari 29 and Inpari 32 had no significant is showed by p = 0.104 (p > 0.05) (Table 8).
TABLE 8. THE RESULT OF LSD ANALYSIS FOR RICE FARMING PROFIT
(I)
varieties and its mean profit
(Rp/ha)
(J)
varieties and its mean profit
Inpari 31 has the highest productivity and significantly different with Inpari 29 and 32. Inpari 31 also provides the highest income and significantly different with Inpari 29 and 32. Among those varieties, Inpari 31 is the most efficient, with its RC ratio is 3.08.
Multiplication and dissemination of Inpari 31 variety can take immediately to improve rice production. The allocation of production factors to be carried out more carefully in or-der to improve the efficiency of rice farming system.
REFERENCES
Hossain, M., M.L. Bose, & B.A.A. Mustafi. 2006. Adoption and productiv-ity impact of modern rice varieties in Bangladesh. Journal of The De-veloping EconomiesXLIV(2): 149-166.
Jamal, E.2009. Telaahan penggunaan pendekatan sekolah lapang dalam pengelolaan tanaman terpadu (PTT) padi: kasusdi Kabupaten Blitar dan Kediri, JawaTimur. Jurnal Analisis Kebijakan Pertanian 7(4): 337-349.
Jamil, A., Satoto, P. Sasmita, Y. Baliadi, A. Guswara, &Suharna. 2015. Deskripsi Varietas Unggul Baru Padi. Badan Penelitian dan Penembangan Pertanian.
Kasniari, D.A.N. & A.A.N. Supadma. 2007. Pengaruh pemberian beberapa dosis pupuk (N, P, K) dan jenis pupuk alternatif terhadap hasil tanaman padi (Oryza sativa L.) dankadar N, P, K Inceptisol Selemadeg Tabanan. Jurnal AGRITROP 26 (4):168-176.
Sembiring, H., &Widiarta, I.N. 2008. Inovasi teknologi padi menuju swasembada beras berkelanjutan.Dalam: A.K. Makarimet al. (eds.): Buku 2. Inovasi Teknologi Tanaman Pangan. ProsidingSimposium V Tanaman Pangan. PusatPenelitian Penelitian dan Pengembangan TanamanPangan, Bogor.
Singarimbun, M. dan S. Effendi. 1989. MetodePenelitian Survey. LP3ES, Jakarta.
Soekartawi, A. 1995. Analisis Usaha tani. UI Press, Jakarta.
Sugiyono, 2011. Metode Penelitian Pendidikan (Pendekatan Kuantitatif, Kualitatif, dan R & D).Edisi 12. Alfabeta, Bandung.
Suhartatik, E., & A.K. Makarim. 2010. Morfologi dan Fisiologi Tanaman Padi. Balai Besar Penelitian Tanaman Padi.
Susanto, U., A.A. Daradjat, & B. Suprihatno. 2003.Perkembangan pemuliaan padi sawah di Indonesia. Jurnal Litbang Pertanian 22(3): 125-131.
Suwarno. 2000. Orientasi penelitian plasma nutfah dan pemuliaan untuk menyongsong tantangan perpadian masa depan. Apresiasi Seminar Hasil Penelitian Tanaman Padi. Balai Penelitian Tanaman Padi, Sukamandi, 10"11 November 2000.
Wahid, A.S. 2003. Peningkatan efisiensi pupuk nitrogen pada padi sawah dengan metode bagan warna daun. Jurnal Litbang Pertanian 22 (4): 156-161.