PARTICIPATORY GIS: EXPERIMENTATIONS FOR A 3D SOCIAL VIRTUAL GLOBE
M. A. Brovelli, M. Minghini, G. Zamboni
Politecnico di Milano, DICA, Laboratorio di Geomatica, Como Campus, via Valleggio 11, 22100 Como, Italy - [email protected], [email protected], [email protected]
Commission IV, WG IV/5
KEY WORDS: GIS, Mobile, PGIS, Services, Three-dimensional, Virtual globe, Web based
ABSTRACT:
The dawn of GeoWeb 2.0, the geographic extension of Web 2.0, has opened new possibilities in terms of online dissemination and sharing of geospatial contents, thus laying the foundations for a fruitful development of Participatory GIS (PGIS). The purpose of the study is to investigate the extension of PGIS applications, which are quite mature in the traditional bi-dimensional framework, up to the third dimension. More in detail, the system should couple a powerful 3D visualization with an increase of public participation by means of a tool allowing data collecting from mobile devices (e.g. smartphones and tablets). The PGIS application, built using the open source NASA World Wind virtual globe, is focussed on the cultural and tourism heritage of Como city, located in Northern Italy. An authentication mechanism was implemented, which allows users to create and manage customized projects through cartographic mash-ups of Web Map Service (WMS) layers. Saved projects populate a catalogue which is available to the entire community. Together with historical maps and the current cartography of the city, the system is also able to manage geo-tagged multimedia data, which come from user field-surveys performed through mobile devices and report POIs (Points Of Interest). Each logged user can then contribute to POIs characterization by adding textual and multimedia information (e.g. images, audios and videos) directly on the globe. All in all, the resulting application allows users to create and share contributions as it usually happens on social platforms, additionally providing a realistic 3D representation enhancing the expressive power of data.
1. INTRODUCTION
Paradigms for publishing geographic information over the Web have radically changed in the last decades. The collection of services related to online fruition of geospatial information, defined by Scharl and Tochtermann (2007) as the Geospatial Web, has experienced such a revolution that the term GeoWeb 2.0 was coined to define it. According to Maguire (2007), this new model represents nothing but the geographic extension of the wider overturn of Web nature known as Web 2.0 (O’Reilly, 2005). The concept provides a clear explanation of the current, innovative generation of Internet applications characterized by an unprecedented user interaction in terms of disseminating and sharing contents.
In turn, the advent of GeoWeb 2.0 proved to be a fertile ground for a new, incredible development of the so-called Participatory GIS (PGIS). The term was initially introduced in the mid-1990s to stress the social role of GIS as a tool for promoting public intervention in decision-making processes (Sieber, 2006). Aside from the rise of Web technologies, an additional impulse for PGIS development was recently brought by the massive spread of mobile devices, which are equipped with sensors (e.g. a GPS receiver and a camera) to geo-tag multimedia contents, and a non-stop Internet connection to immediately Web-publish them. In this context, PGIS applications are rapidly evolving towards Web-based, community-shared platforms in which users are able to manage their own data and, according to the paradigm of neogeography (Turner, 2006), to also create customized mash-ups from multiple sources of geographic information.
As a result of PGIS historical evolution, available researches prove to be highly heterogeneous in terms of both the PGIS investigated aspect and the related technologies. While a number of studies is focussed on PGIS motivation and its social and critical role (e.g. Elwood, 2006), recent years have seen an
exponential growth of attention on PGIS software development. Anyway, although some attention has been given to both GIS applications somehow promoting public participation (e.g. Hall et al., 2010) and field-data collection using mobile devices (e.g. Burke et al., 2006), a couple of considerations can be inferred. First, few academic research has studied the implementation of participatory systems able to address the problem of entirely managing data from its collection in situ to its Web-publication. In addition, literature is almost silent about PGIS applications involving user data interaction also in the third dimension. Against this background, the purpose of the study is to build up a Web-based, participatory system able to: a) allow citizens to perform field surveys using common mobile devices, compiling and submitting ad hoc questionnaires together with multimedia contents (e.g. images), which are registered through the mobile device sensors and then georeferenced through the device positioning services (e.g. the GPS); b) store and manage field-captured data into a spatial database and provide Web publication using standard protocols; and c) build up a Web-based system offering not just a 3D visualization interface, but also an overall framework allowing users to manage data and create customized maps.
The proposed architecture was exploited for the creation of a PGIS application focussed on the report of cultural and touristic Points Of Interest (POIs) of Como city, located in Northern Italy. Besides showing the extension of PGIS applications to the third dimension, the results should also provide support for using the system in circumstances characterized by the need of real-time, field-collected data (e.g. emergency management). The paper is divided into four parts. First, it reviews the existent literature relevant to PGIS development as a consequence of the Web 2.0 revolution. Next, system architecture is presented in detail and the attention is focussed first on the issue of field-data collection through mobile devices, then on the applications International Archives of the Photogrammetry, Remote Sensing and Spatial Information Sciences,
used for implementing a participatory system with 3D content visualization. The paper concludes with a summary of the study’s contributions and directions for future research.
2. BACKGROUND
In this section, the evolution of Internet mapping tools after the dawn of GeoWeb 2.0 and the state of the art concerning PGIS applications are discussed, thus providing a solid motivation for developing the participative system described later.
The first era of Geospatial Web (also referred to as GeoWeb 1.0) was characterized by the same limitation of the whole Web 1.0, i.e. a poor interaction making user experience not specially pleasurable (Haklay et al., 2008). In this first stage, geospatial information was supplied by public mapping agencies according to a top-down, authoritarian paradigm (Goodchild, 2007). The tremendous shift brought by Web 2.0 (O’Reilly, 2005) allowed the development of rich Web applications, which became more and more similar to the traditional desktop ones (Graham, 2005) by enhancing user interaction. The new, bi-directional approach gave people no longer a mere data access, but the chance to also generate and share contents, e.g. into blogs, wikis and social networks. The corresponding change of Internet mapping tools caused by GeoWeb 2.0 (Maguire, 2007) was indeed introduced at the end of last century by the work of the Open Geospatial Consortium (OGC), which began to establish standards for Web mapping interoperability (Peng and Tsou, 2003).
One of the strongest shifts brought by GeoWeb 2.0 took place in the field of technologies, where Application Programming Interfaces (APIs) transformed Web mapping applications from static, complex and restricted to a small public, to dynamic, easy to use and accessible also for non-experts. The term PGIS, which was coined at about the end of last century to highlight a shift from the technical to the social aspect of GIS, was totally reshaped by some GeoWeb 2.0-related concepts. In addition to the one, already mentioned, of neogeography (Turner, 2006), the ideas of Volunteered Geographic Information (Goodchild, 2007) and crowdsourcing (Howe, 2006) were used to conceive humans as sensors able to register geographic information from the ground. This possibility has exceptionally grown thanks to the huge variety of sensors installed on current mobile devices. As a consequence of all the factors discussed up to now, PGIS systems have been evolving from being simple, desktop-based (or even paper-based) viewers, to become Web-based, shared platforms allowing users to dynamically add and edit their own contents and create customized mash-ups. Being thus addressed to the entire user community, PGIS applications must make use of standards in both data formats and services. They must also be able to manage different user profiles provided with different privileges, and to finally allow users, based on their same own privileges, to act on data (i.e. add, modify, delete and save data) and export customized map mash-ups.
Literature examples of PGIS systems offering a traditional, bi-dimensional data interaction are quite common. Almost all of them deal with planning-related disciplines and, if posterior to the birth of Web 2.0, they are also Web-based. Users are able to intervene by adding geo-tagged comments (e.g. Rinner et al., 2008; Bugs et al., 2010) and, in few cases, data collection from mobile devices is also allowed (e.g. Maisonneauve et al., 2010). Within the open source field, some participative Web platforms for 2D-managing and sharing geospatial data, e.g. GeoNode (http://geonode.org) and MapStore (http://mapstore.geo-solutions.it/mapstore) have become almost mature. Integrating a map server for WMS (Web Map Service) data dissemination, a
framework for user administration, a database and a WebGIS viewer, they allow to save and share customized maps, whose layers can derive from both the upload of user own data and the exploitation of online available maps.
Three-dimensional access to geospatial information has instead gained interest only in recent years thanks to virtual globes, i.e. software allowing to explore the Earth in 3D while streaming satellite imagery, elevation and other data from the Internet (Schultz et al., 2008). Though virtual globes have increasingly evolved from simple viewers to applications aimed at a pool of complex scientific purposes (Brovelli and Zamboni, 2012), literature does not provide examples of 3D PGIS platforms built using virtual globes technology.
3. METHODOLOGY 3.1 System architecture
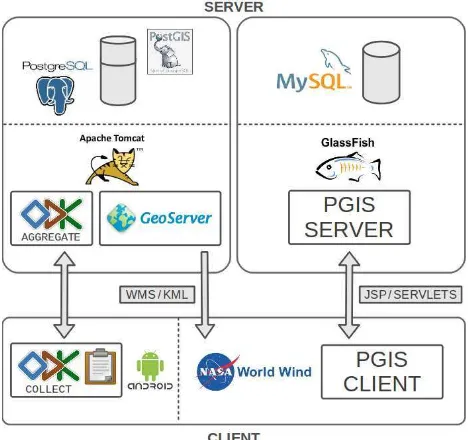
This section offers a technical overview of the developed PGIS platform, which is focussed on the cultural and tourism heritage of Como city (Northern Italy). The implemented architecture, depicted in Figure 1, consists of a server-side and a client-side component. The first one stores and manages all the data which is needed for working on the system; the second one provides instead the tools for user geographic navigation and interaction with the platform.
Thanks to Open Data Kit (ODK) suite (http://opendatakit.org), users can exploit their mobile devices to report significant POIs (see subsection 3.2). The ODK suite is composed of three modules providing complementary functions, i.e. ODK Build, ODK Aggregate and ODK Collect. ODK Build module allows to design the form (i.e. the questionnaire) that users will then compile on the field. The form template is subsequently loaded into ODK Aggregate, which works on an Apache Tomcat server (http://tomcat.apache.org) backed with a PostgreSQL database (http://www.postgresql.org), provided in turn with the PostGIS spatial extension (http://postgis.net). ODK Aggregate is the server-side component of ODK suite and is also responsible for user administration. It provides blank forms to, and accepts compiled forms from ODK Collect, which is the suite client-side component and runs on Android mobile devices.
POIs field-collected data is then Web-published by the spatial server GeoServer (http://geoserver.org) and accessed in KML format by the PGIS client, that is developed using NASA World Wind virtual globe (http://worldwind.arc.nasa.gov/java) (see subsection 3.3). Within the participatory platform, users are able to create and export map mash-ups by combining customized WMS layers (e.g. historical maps and the city current cartography), which can be retrieved both from the same GeoServer and also from external available WMS resources (see subsection 3.4). This is possible thanks to a MySQL database (http://www.mysql.it), which also stores users’ credentials and related privileges.
User data interaction (i.e. reading, adding, editing and deleting actions) is managed by the PGIS server running inside GlassFish application server (https://glassfish.java.net), which makes use of servlet objects for communicating with the client-side of the platform. Users are also able to collaboratively contribute to POIs characterization by adding comments and multimedia contents (i.e. images, audios and videos), thus increasing the social nature of the platform. The client-side of the system is also able to interface with the whole Web, as possible HTML links contained in POIs descriptions can be regularly accessed.
International Archives of the Photogrammetry, Remote Sensing and Spatial Information Sciences,
Figure 1. Architecture of the system
3.2 Points Of Interest field-report
As already stated, the developed PGIS platform is focussed on the cultural and tourism Points Of Interest (POIs) belonging to Como city, that users can report using their mobile devices (e.g. smartphones and tablets). The first step is thus the design of the report questionnaire, which is achieved through the ODK Build module and consists in the definition of the questions and the corresponding types of answer (choice of one option within a list, text, image, etc.). In detail, users are asked to indicate the date of the report and to choose both the category and the typology of the POI they are reporting. In particular, POIs are classified into eight categories, i.e. points with panoramic view, transport stations, monuments, historical/monumental buildings, places of worship, places of artistic/cultural activities, sports facilities and events. In turn, each category groups different POI typologies: a place of worship can e.g. be classified as church, baptistery, convent or cemetery. Users have then to provide the name of the POI and a description of it. Finally, they are asked to register their current position (using e.g. the device GPS) and to provide an image of the reported POI, by taking a picture in real time with the device camera or by uploading an image from the device archive. To enlarge the class of potential users of the platform, the questionnaire is offered in multiple languages, i.e. English, Spanish and Italian.
Once the questionnaire template has been designed, it can be uploaded on the ODK Aggregate module, which is deployed on a local Tomcat server backed with a PostgreSQL database. ODK Aggregate component allows to manage both forms and users. About forms, it defines whether they are downloadable and whether to accept submissions of those forms. Options for exporting form submissions in multiple formats and computing statistics on form answers are also available. Concerning users, the ODK Aggregate module allows to manage both users and their related privileges, i.e. downloading forms to ODK Collect and submitting finalized forms to ODK Aggregate, filtering and exporting submissions from ODK Aggregate, uploading and deleting form templates on ODK Aggregate, etc. Finally, the ODK Collect Android application allows users to perform POIs field-surveys using their mobile devices. After downloading and installing the application, users have to connect to the ODK Aggregate server and authenticate. They can thus access the list
of available questionnaires and download the one for reporting POIs. Choosing then to compile a blank questionnaire, users access the preset list of questions and provide the corresponding answers (see Figure 2): date of the survey, category, typology, name and description of the POI, position and image.
Questionnaire compilation does not require an active Internet connection and allows users to only save their answers. After that, they can choose if editing again the answers before the final submission, or (having this time an Internet connection) if sending the finalized questionnaire to ODK Aggregate.
Figure 2. Screenshots of the ODK Collect application for reporting POIs, showing the choice of the POI category (left)
and the POI picture taken with the device camera (right)
3.3 POIs three-dimensional visualization
As mentioned in subsection 3.1, Points Of Interest reported data is stored into a PostgreSQL database, whose PostGIS spatial extension allows GeoServer to read and Web-publish them. Three-dimensional visualization of POIs is achieved through the NASA World Wind virtual globe, which is a free and open source, cross-platform Java Software Development Kit (SDK) allowing to generate interactive Web visualizations of three-dimensional globes, maps and geographic information. The API provides a set of components allowing to display 3D geospatial contents as Java Application, Java Applet or Java Web Start Application. Other components are available for rendering the shape of the planet, overlapping geographic layers, setting the scene rendering and controlling the user view. A collection of aerial and satellite imagery as well as digital terrain models, supplied by NASA and United States Geological Survey WMS servers, is also available by default. In addition, both 2D objects (lines, markers, images, etc.) and 3D objects (cylinders, spheres, extruded polygons, etc.) can be placed on the globe and in the surrounding space.
The World Wind-based PGIS platform, developed as Java Web Start Application, accesses the GeoServer POIs layer in the KML format and renders it on the globe using different levels of detail. Specifically, distinct symbols are used for the representation of POIs depending on the altitude of the user point of view over the globe. For high altitudes, basic placemarks are used to render all the POIs regardless of their nature (see Figure 3).
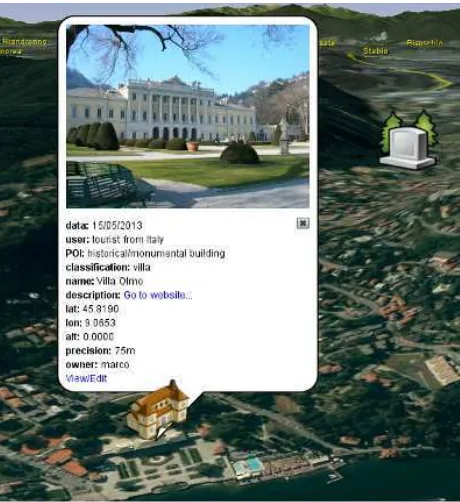
At medium altitudes, Points Of Interest are rendered using eight different icons identifying the category they belong to. Finally, at small altitudes other specific icons, which characterize the typology of POIs, are used (see Figure 4). Whatever the altitude International Archives of the Photogrammetry, Remote Sensing and Spatial Information Sciences,
of the user point of view, when a POI on World Wind virtual globe is clicked, a balloon appears showing the corresponding ODK Collect-reported information and picture (see Figure 4).
Figure 3. Example of POIs 3D visualization at high altitudes
Figure 4. Example of POIs 3D visualization at small altitudes with a balloon showing field-collected information
3.4 PGIS platform functionalities
As World Wind Java SDK is designed to be highly extensible, modifications and additions were implemented with the purpose of achieving the typical functionalities of PGIS platforms. First of all an authentication mechanism, which is also able to keep trace of user registration on ODK Aggregate server, was added to the system. Once started, the application allows users to create a new account by providing personal credentials (i.e. username and password) or to login with an existing account. Registered users can benefit from a wide range of privileges, which allow them to fully exploit the potential of the platform. User profiles and the related permissions are stored inside the second, MySQL-based database available within the platform. As opposed to non registered users, registered users can first of all interact with POIs by clicking the View/Edit link located at the bottom of the POI balloon (see Figure 4), which addresses them to Web pages containing POIs descriptions and the related
contents (see Figure 5). From this page, registered users can participate to the characterization of POIs by adding comments and multimedia data (i.e. images, videos and audios), which are managed by the PGIS server interacting with the same MySQL database. In particular, the Web pages sent to the PGIS client application for viewing, uploading and editing data are dynamically generated from both JSP pages and servlet objects executed inside GlassFish. A registered user that is also the owner of a POI (i.e. the user who created that POI from ODK Collect application) has the additional right to edit the field-collected information. At medium and small altitudes of the point of view on the globe, the owner of a POI is also able to modify its position by simply dragging its icon. This possibility, which is useful e.g. if the position estimated from the mobile device GPS receiver was poorly accurate, is ensured by the use of WFS-T (Web Feature Service - Transactional) protocol. Non registered users can finally just access a View link from the POI balloon, which allows them only to view the POI contents uploaded by registered users.
Figure 5. Example of a Web page providing POI description and related contents (comments and multimedia data)
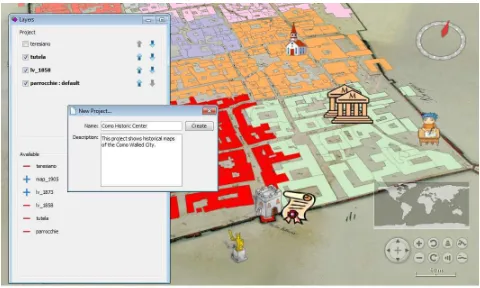
Registration to the platform makes also users able to create and manage customized, three-dimensional mash-ups and save their map projects. First, a tool for managing the layer catalogue was developed, which allow registered users to store and retrieve geographic information from a list of WMS servers. In other words, users can upload layers published from whatever WMS server by typing the server URL, exploring the layers published from the server and adding one or more of them to the virtual globe. Layer metadata (i.e. WMS server URL, layer name, user who added the layer) is stored again in the MySQL database. All the added layers populate a layer catalogue, which remains available for all the users (also non registered ones) inside the application. Again, the owner of a layer (i.e. the user who added that layer to the application) is able to also edit (e.g. change its name) and delete it from the system. Some WMS layers related to Como city, i.e. historical maps from the XVIII to the early-XX century and the current official cartography of the city, are available by default within the catalogue. User-created projects, consisting of customized data mash-ups on top of World Wind, can also be exported. Saving a project means to keep trace not just of its layers, but of also all the contextual information, i.e. the position (latitude, longitude and altitude) and the camera orientation of the user point of view on the globe. This metadata, which also includes the name and the description of the project (see Figure 6) and the user who saved the project, is again stored in the MySQL database. Once again, each saved project populates a catalogue of projects which is visible for the entire user community.
International Archives of the Photogrammetry, Remote Sensing and Spatial Information Sciences,
Figure 6. Creation of a sample project composed of the mash-up between the POIs and other WMS layers
The owner of a project (i.e. the user who saved that project) has of course editing rights on it, while all the other registered users can access the project and, if desired, edit and save it as a new project of which they are now owners.
4. DISCUSSION AND CONCLUSIONS
GeoWeb 2.0 and the massive proliferation of sensors-equipped mobile devices cleared the way for notable improvements in the field of Participatory GIS (PGIS). This study contributes to PGIS literature through the development of a collaborative platform for three-dimensionally visualizing and interacting with field-collected information reported from mobile devices. To our knowledge, it is the first research that implements a full participative framework allowing also data visualization in the third dimension.
In agreement with Goodchild’s (2007) theory that human beings behave like sensors able to acquire geographic knowledge from the Earth surface, users can exploit their mobile devices (e.g. smartphones and tablets) to geo-tag cultural and tourism Points Of Interest (POIs), by compiling a predefined questionnaire and providing also an image of the POI. The major innovation of the research is however represented by the three-dimensional geographic visualization implemented using a virtual globe (in detail, the World Wind virtual globe developed by NASA), that makes user experience more realistic and enhances the data expressive power. The application is able to read the field-reported POIs, which are published on the Web using standard protocols, and to locate them on the globe. The described work has been carried out in relation to the cultural heritage of Como city (Northern Italy), but can be widely generalized.
Another new feature with respect to the existing PGIS literature lies in the rich user interaction with POIs. Different profiles (i.e. non registered users, registered users and registered users who are also the owners of POIs) have different permissions in terms
of viewing and editing the POI contents. The implementation of an authentication mechanism allows also users to create and save customized map mash-ups, built with WMS layers that can be retrieved from whatever available server. If, on the one hand, each user can manage his own layers and projects, on the other all the information added to the platform remains available for the whole user community. In this way, taking also into account user permission to add comments and multimedia contents, the developed application acquires a revolutionary, social nature. The proper functioning of the system, which is feeded by real-time, voluntary user contributions, provides support for the potential usage of the developed platform in circumstances characterized by the need of constant, updated field information (e.g. emergency management). Furthermore, the implemented architecture is fully built using free and open source software (see Figure 1), which thus proved to be suitable for creating all the components of a PGIS system.
Future work should first of all improve the performance of the Android ODK Collect application, which currently allows users to register their position only exploiting a device positioning service (e.g. the GPS receiver or a wireless network). Hence, if no positioning service is available during the POI report, the user is not able to finalize his questionnaire. Another weakness arises from the poor performance of many mobile device GPS receivers, whose estimated POIs positions result thus to be scarcely accurate. Finally, the survey position (i.e. the position of the device) does not usually coincide with the position of the POI which is being surveyed. These drawbacks might be overcome by editing the code of the Android ODK Collect application, providing users with an interactive map that they can use for manually placing the POI position (or for refining the GPS-estimated position). This way, devices which are not GPS-enabled could also be used for POIs reports. Future work should finally extend the PGIS system also to the fourth dimension, providing users with ad hoc tools in order to visualize time-filtered POIs submissions.
International Archives of the Photogrammetry, Remote Sensing and Spatial Information Sciences,
REFERENCES
Brovelli, M.A., Zamboni, G., 2012. Virtual globes for 4D environmental analysis. Applied Geomatics, 4, pp. 163-172.
Bugs, G., Granell, C., Fonts, O., Huerta, J., Painho, M., 2010. An assessment of Public Participation GIS and Web 2.0 technologies in urban planning practice in Canela, Brazil.
Cities: The International Journal of Urban Policy and Planning, 27(3), pp. 172-181.
Burke, J., Estrin, D., Hansen, M., Parker, N., Ramanathan, S., Reddy, S., Srivastava, M.B., 2006. Participatory Sensing. In:
Workshop on World-Sensor-Web (WSW'06): Mobile Device Centric Sensor Networks and Applications (Boulder, October
2006), Boulder, CO, pp. 117-134.
Elwood, S., 2006. Critical Issues in Participatory GIS: Deconstructions, Reconstructions, and New Research Directions. Transactions in GIS, 10(5), pp. 693-708.
Goodchild, M.F., 2007. Citizens as Voluntary Sensors: Spatial Data Infrastructure in the World of Web 2.0. International
Journal of Spatial Data Infrastructure Research, 2, pp. 24-32.
Graham, P., 2005. Web 2.0.
http://www.paulgraham.com/web20.html (1 Jul. 2013).
Haklay, M., Singleton, A., Parker, C., 2008. Web Mapping 2.0: The Neogeography of the GeoWeb. Geography Compass, 2, pp. 2011-2039.
Hall, G.B., Chipeniuk, R., Feick, R.D., Leahy, M.G., Deparday, V., 2010. Community-based production of geographic information using open source software and Web 2.0.
International Journal of Geographical Information Science,
24(5), pp. 761-781.
Howe, J., 2006. The rise of crowdsourcing. Wired Magazine, 14(6), pp. 176-183.
Maguire, D.J., 2007. GeoWeb 2.0 and Volunteered GI. In:
Workshop on Volunteered Geographic Information, University
of California, Santa Barbara, pp. 104-106.
Maisonneauve, N., Stevens, M., Ochab, B., 2010. Participatory noise pollution monitoring using mobile phones. Information
Polity, 15(1), pp. 51-71.
O’Reilly, T., 2005. What is Web 2.0: Design patterns and business models for the next generation of software. http://oreilly.com/pub/a/web2/archive/what-is-web-20.html (1 Jul. 2013).
Peng, Z.R., Tsou, M.H., 2003. Internet GIS. John Wiley & Sons, Hoboken, NJ.
Rinner, C., Keßler, C., Andrulis, S., 2008. The use of Web 2.0 concepts to support deliberation in spatial decision-making.
Computers, Environment and Urban Systems, 32, pp. 386-395.
Scharl, A., Tochtermann, K., 2007. The Geospatial Web: How
Geobrowsers, Social Software and the Web 2.0 are Shaping the Network Society. Springer, London.
Schultz, R.B., Kerski, J.J., Patterson, T.C., 2008. The use of virtual globes as a spatial teaching tool with suggestions for metadata standards. Journal of Geography, 107(1), pp. 27-34.
Sieber, R., 2006. Public Participation Geographic Information Systems: A Literature Review and Framework. Annals of the
American Association of Geography, 96(3), pp. 491-507.
Turner, A., 2006. Introduction to Neogeography. O’Reilly Media Short Cuts, Sebastopol, CA.
International Archives of the Photogrammetry, Remote Sensing and Spatial Information Sciences,