IMAGE FUSION AND IMAGE QUALITY ASSESSMENT OF FUSED IMAGES
Zhen Han a, *, Xinming Tang b, Xiaoming Gao b, Fen Hub
a
School of Mapping And Geographic Information Systems, Lanzhou Jiao Tong University, China - b
Satellite Surveying and Mapping Application Centre, NASG, China -
KEY WORDS : Image Fusion, Brovey, PCA, Pansharp, SFIM , Accuracy Evaluation
ABS TRACT:
It is of great value to fuse a high-resolution panchromatic image and low-resolution multi-spectral images for object recognition. In the paper, tow frames of remotely sensed imagery, including ZY03 and SPOT05, are selected as the source data. Four fusion methods, including Brovey, PCA, Pansharp, and SFIM , are used to fuse the images of multispectral bands and panchromatic band. Three quantitative indicators were calculated and analyzed, that is, gradient, correlation coefficient and deviation. According to comprehensive evaluation and comparison, the best effect is SFIM transformation, combined with fusion image through four transformation methods.
* Corresponding author. Han Zhen,Tel:13521798206,E-mail:[email protected]. 1. INTRODUCTION
In recent years, the launch of high-resolution satellites has opened a new era for remote sensing. With these remote sensors, images of various spatial and spectral characteristic can be obtained. For example, from the ZY03 sensor, 2.1 m resolution panchromatic and 5.6 m resolution multispectral and 3.5 m resolution front-facing, rear-facing images are available. With the development of remote technique and the launch of new satellites, remote image have great promoted at spatial resolution and spectral resolution (Wang, 2003). Fusion of two images from different sources can provide information that cannot be obtained when the images are processed individually. Image fusion can improve the accuracy when we extract useful information from image (Jia, 2000). To data, various fusion algorithms have been developed ( Chavez, 1991, Siddiqui, 2003, Hallada, 1983, Vrabel, 2002). As Zhang combined DWT and IHS algorithms and apply to image fusion of the IKONOS and Quick Bird (Zhang, 2005). Yang combined NSCT and HIS and apply to image fusion of the SPOT and TM (Yang, 2008). In the paper, we tested Brovey,PCA,Pansharp and SFIM . And we assessed the quality of fusion image with indices of gradient, correlation coefficient and deviation.
2. IMAGE FUS ION METHODS AND QUALITY INDICATORS
2.1 Image fusion methods
In this section, we analyze image fusion method that can be used for high-resolution satellite image fusion, such as those for fusion of panchromatic and multi-spectral images. Four categories of image fusion methods are addressed: Brovey, PCA, Pansharp, and SFIM .
1) Brovey Algorithm
The Brovey Algorithm is a ratio method that normalizes multispectral bands used for a RGB display (GILLESPIE, 1987). The result is then multiplied by a high-resolution band to add high spatial frequency information. The Brovey Algorithm can only allow a limited number of bands to be fused. The Brovey Algorithm can be defined as follows:
h
_ _
_
_
_
B
B
B
B
B
B
m b m g m r
m i NEW
i
(1)Where
B
i_NEW is thei
th band of fused high-resolution image,B
i_m is one of the bands, that is red band, green bandor blue band.
B
r_m,
B
g_m,
B
b_m stand the pixel value of redband, green band and blue band.
B
h is the high-resolution image.2) PCA Algorithm
PCA transform is created based on the statistical characteristics dimensional linear transformation, the mathematical transformation is called K-L(Sun, 2002). The PCA transform converts intercorrelated M S bands into a new set of uncorrelated components. The first component also resembles a PAN image. It is, therefore, replaced by a high-resolution PAN for the fusion. The PAN image is fused into the low-resolution M S bands by performing a reverse PCA transform.
3) Pansharp Algorithm
The PANSHARP algorithm is based on the least number of squares to an approximate
International Archives of the Photogrammetry, Remote Sensing and Spatial Information Sciences,
Volume XL-7/W1, 3rd ISPRS IWIDF 2013, 20 – 22 August 2013, Antu, Jilin Province, PR China
gray-value relationship between the original multispectral image, panchromatic image,
and fused image. This method also statistics all bands of the input and fusion results in order to eliminate the dependence of the data set(Tan,2008).
4) SFIM Algorithm
The SFIM is a ratio method that the high-resolution image is divided by a simulated low-resolution image and the result is then multiplied by the low-resolution image. The algorithm was defined by LIU (2000a) as below:
input image, co-registered to a high-resolution input image
high
B
, andB
mean is a corresponding pixel in a simulatedlow-resolution image derived from
B
high using an average filter for aneighborhood equivalent to the resolution of
B
high.2.2 Quality indicators for assessing image fusion The purpose of image fusion is to enhance the spatial and spectral resolution from several low-resolution images. Several indices have been proposed for assessing image quality, which can also be applied to assessing the quality of a fusing image. In this section, we select three indices to assess the quality of fusion image. Those includes: gradient, correlation coefficient and deviation.
The gray-scale variation of the image in a direction. Tiny detail and texture changes can be reflected with this index.
2) Deviation:
denotes the fusion image gray level of
a pixel with coordinate
i
,
j
. Deviation index used to compare the degree of deviation of fusion images and low-resolution fusion image fidelity .3. RES ULT AND ANALYS IS 3.1 Result
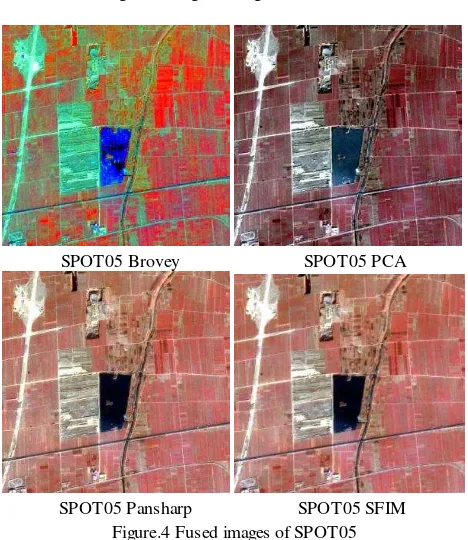
In the paper, four fusion methods, including Brovey, PCA, Pansharp, and SFIM , are used to fuse the images of multispectral bands and panchromatic band. Three quantitative indicators were calculated and analyzed, that is, gradient, correlation coefficient and deviation. Figure.1 is the original image of ZY03, Figure.2 is the fusion image of ZY03, Figure.3 is the original image of SPOT05, Figure.4 is the fusion image of SPOT05.
ZY03 Pan ZY03 M ul
Figure.1 Original images of ZY03
ZY03 Brovey ZY03 PCA International Archives of the Photogrammetry, Remote Sensing and Spatial Information Sciences,
Volume XL-7/W1, 3rd ISPRS IWIDF 2013, 20 – 22 August 2013, Antu, Jilin Province, PR China
ZY03 Pansharp ZY03 SFIM Figure.2 Fused images of ZY03
SPOT05 Pan SPOT05 M ul Figure.3 Original images of SPOT05
SPOT05 Brovey SPOT05 PCA
SPOT05 Pansharp SPOT05 SFIM Figure.4 Fused images of SPOT05
3.2 Quantitative analysis
Considering the drawbacks of the subjective quality assessment method, much effort has been devoted to develop objective image quality assessment methods. A good fusion approach retain the maximum spatial and spectral information from the original images and should not damage the internal relationship among the original bands. Based on these three criteria, we select gradient, correlation coefficient and deviation to assess the fusion image.
fusion methods gradient deviation correlation coefficient Brovey 8.31111 0.528676 0.432419
PCA 9.78541 0.41091 0.88355
Pansharp 13.16326 0.03310 0.93890
SFIM 13.10289 0.02274 0.96633
Table 1 Assessment results of ZY03 fused image
fusion methods gradient deviation correlation coefficient
Brovey 1.61168 0.65731 0.22867
PCA 4.52237 0.05483 0.81224
Pansharp 3.31930 0.02060 0.93861
SFIM 3.44472 0.01801 0.95655
Table 2 Assessment results of SPOT05 fused image
Form Table 1,we observe that the value of gradient obtained by SFIM transformation method is almost the largest(SFIM : 13.102892≈Pansharp: 13.163267), the value of deviation obtained by SFIM transformation method is minimum, and the value of correlation coefficient obtained by SFIM transformation method is the largest. From these quantitative results, we can conclude that the fusion result which is obtained by SIFM transformation method is the best.
Form Table 2,we observe that the value of gradient obtained by SFIM transformation method is the largest, the value of deviation obtained by SFIM transformation method is minimum, and the value of correlation coefficient obtained by SFIM transformation method is the largest. From these quantitative results, we can conclude that the fusion result which is obtained by SIFM transformation method is the best.
4. CONCLUS IONS
Selection of proper fusion technique depends on the specific remote image. Four fusion methods, including Brovey, PCA, Pansharp, and SFIM , are used to fuse the images of multispectral bands and panchromatic band. Three quantitative indicators were calculated and analyzed, that is, gradient, correlation coefficient and deviation. Finally, form the above analysis and comparison, we can conclude that SFIM algorithm can preserve the spectral characteristics of the source multispectral image as well as the high spatial resolution characteristics of the source panchromatic image and suited for fusion ZY03 and SPOT05 images.
5. ACKNOWLEDGEMENTS
This work was supported by the funds from the M onitoring Techniques System of Base Geographical Conditions Research(Project No. 2012BAH28B01).
References
Ping Wang,2003. Experiment of LUCC Information Based on Fusion of M ulti-source RS Data. Surveying and Mapping, 32
4 :pp.14-17
International Archives of the Photogrammetry, Remote Sensing and Spatial Information Sciences,
Volume XL-7/W1, 3rd ISPRS IWIDF 2013, 20 – 22 August 2013, Antu, Jilin Province, PR China
Yonghong Jia ,2000. Data Fusion Techniques for M ulti-sources Remotely Sensed Imagery . Remote Sensing Technology and Application , 15 1 :pp.41-42
Pat S,1991. Comparison of Three Different M ethods to M erge M ulti-resolution and M ultispectral Data: Landsat TM and SPOT Panchromatic. Photogrammetric Engineering& Remote Sensing, 57(3):pp.295-303
Siddiqui Y, 1983. The Modified IHS Method for Fusing Satellite Imagery. ASPRS 2003 Annual Conference Proceedings
Hallada, 1983. Image Sharpening for Mixed Spatial and Spectral Resolution Satellite Systems. Proc. of the 17th International Symposium on Remote Sensing of Environment
Vrabel J,2002. Demonstration of the Accuracy of Improved Resolution Hyperspectral Imagery . SPIE Symposium Proceedings
Zhang Y,2005. An IHS and Wavelet Integrated Approach to Improve Pan - sharpening Visual Quality of Natural Colour IKONOS and Quick Bird Images . Information Fusion, 6 (3) : pp. 225 - 234.
Yang X, 2008. Fusion Algorithm for Remote Sensing Images Based on Nonsubsampled Contourlet Transform. Acta Automatica Sinica, 34 (3) :pp. 274 - 281.
Gillespie,1987.Color enhancement of highly correlated image-Ⅱ: Channel ratio and “chromaticity” transformation techniques. Remote Sensing of Environment, 22(2):pp.343-365.
Sun,2002. Study on Fusion Algorithms of IKONOS PAN and M ulti- spectral Images. Remote Sensing Technology and application,17(1): pp.41-45
Tan,2008. Study on Fusion Algorithms of Quick Bird PAN and M ulti Spectral Images. Bulletin of Science and Technology, 24(4):pp.498-503
International Archives of the Photogrammetry, Remote Sensing and Spatial Information Sciences,
Volume XL-7/W1, 3rd ISPRS IWIDF 2013, 20 – 22 August 2013, Antu, Jilin Province, PR China