Jurnal Informatika dan Komputer (JIKO) – Vol. 2, No. 1, Februari 2017
AN APPLICATION OF ROUGH SET THEORY TO CLUSTER
STUDENT ASSESSMENT AT UNIVERSITIES
Suhirman
Department of Information Engineering, University of Technology Yogyakarta Jl. Ringroad Utara, Jombor, Sleman, Yogyakarta, Indonesia
e-mail : [email protected]
ABSTRAK
Penilaian adalah tahap terakhir dari kuliah di perguruan tinggi. Ada beberapa komponen yang membentuk dasar perhitungan. Sebuah teknik digunakan untuk memilih pengelompokan atribut berdasarkan teori himpunan kasar. Data diambil dari survei terhadap 150 mahasiswa arsitektur desain studio. Data yang diambil dari mahasiswa semester 6 jurusan arsitektur Universitas Teknologi Yogyakarta Indonesia. Penilaian terdiri dari lima komponen, yaitu tiga tugas, presentasi, ujian tengah semester dan ujian akhir. Penilaian ini dilakukan pada tahun 2015. kriteria evaluasi yang digunakan berbagai 0-100. Nama siswa, usia, ras, dan kehadiran yang tidak diperlukan dalam penilaian ini. Dalam makalah ini, kami menunjukkan bagaimana menentukan atribut dominan dari sekumpulan atribut penilaian menggunakan teori set kasar (Max-Max kekasaran). Hasil yang diperoleh berpotensi memberikan kontribusi untuk memberikan rekomendasi dalam pemberian nilai akhir yang lebih cepat dan akurat.
Kata kunci: Penilaian, Klastering, Teori himpunan kasar, Atribut
ABSTRACT
Assessment is the last session of a lecture in college. There are several components that form the basis of calculations. A technique to select a clustering attribute based on rough set theory is presented. Dataset is taken from a survey of 150 architectural design studio students. Data are taken on 6th semester students majoring in architecture University of Technology of Yogyakarta Indonesia. Assessment consists of five components, namely three tasks, presentations, midterms and final exams. This assessment was conducted in 2015. The evaluation criteria used range from 0-100. Student name, age, race, and attendance are not required in this assessment. In this study, we show how to determine the dominant attributes of a set of attributes of an assessment list by using the rough set theory (Max-Max roughness). The results obtained can potentially contribute to give a recommendation in awarding the final grade of a course more quickly and accurately.
Keywords : Assessment, Clustering, Rough set theory, Attributes
I. INTRODUCTION
ducation is the foundation for achieving sustainable development. Concerning with the importance of this kind of education, the key aspect is needed on the measuring achievement levels in higher environmental education [1]. Higher education institutions are overwhelmed with huge amounts of information regarding student's enrollment, number of courses completed, achievement in each course, performance indicators and other data. This has led to an increasingly complex analysis process of the growing volume of data and to the incapability to take decisions regarding curricula reform and restructuring. On the other side, educational data mining is a growing field aiming at discovering knowledge from student's data in order to thoroughly understand the learning process and take appropriate actions to improve the student's performance and the quality of the courses delivery [2].
The techniques of grouping data of an object are similar, both to deal with certain conditions and in conditions of uncertainty. especially with high complexity, speeds and stability will be a problem in itself. The data collection can be described as vague and uncertain. Obtained clusters and applied queries do not necessarily have boundaries. Rough set theory was developed as a matematical tool for dealing with vagueness and uncertainty. It is successfully applied in various tasks, the selection / attribute extraction, synthesis and classification rules, knowledge discovery, etc. Tolerance rough set model employing a tolerance relation is not an eqivalence relationship in the original model of rough sets [3].
Clustering can be said as identification of similar classes of objects. By using clustering techniques we can further identify dense and sparse regions in object space and can discover overall distribution pattern and correlations among data attributes. Classification approach can also be used for effective means of distinguishing groups or classes of object but it becomes costly so clustering can be used as preprocessing approach for attribute subset selection and classification. To make learning process more effective, the educational systems deliver content adapted to specific user’s needs. Adequate personalization requires the domain of learning to be described explicitly in a particular detail, involving relationships between knowledge elements referred to as concepts [4].
Cluster analysis is an important exploratory technique for discovering patterns and underlying structure in data. The aim of clustering is to partition a data set into classes such that within-class homogeneity is high and between-class homogeneity weak. However, standard clustering techniques, including agglomerative hierarchical
clustering solution. This results in a nonunified approach to clustering, allowing for different clusters to be obtained when a given technique is applied to the same data by different people.
Clustering is a mostly unsupervised procedure and the majority of the clustering algorithms depend on certain assumptions in order to define the subgroups present in a data set. As a consequence, in most applications the resulting clustering scheme requires some sort of evaluation as regards to its validity.
II. RELATED WORKS
Educational data mining can be applied to wide areas of research including elearning, intelligent tutoring systems, text mining, social network mining etc. In education, EDM can function as a replacement for less accurate but more established psychometric techniques. Educational data mining is an interactive cycle of hypothesis formation, testing and refinements that alternates between two complementary types of activities. One type of activity is qualitative analysis, focuses on understanding individual tutorial events. Other type involve, knowledge tracing analyses the growth curve by aggregating over successive opportunities to apply skills [5].
The emerging fields of academic analytics and educational data mining are rapidly producing new possibilities for gathering, analyzing, and presenting student data. University might soon be able to use these new data sources as guides for course redesign and as evidence for implementing new assessments and lines of communication between instructors and students. This essay links the concepts of academic analytics, data mining in higher education, and course management system audits and suggests how these techniques and the data they produce might be useful to those who practice the scholarship of teaching and learning [6].
The EDM process converts raw data coming from educational systems into useful information that could potentially have a great impact on educational research and practice. This process does not differ much from other application areas of DM, like business, genetics, medicine, etc., because it follows the same steps as the general DM process [7]. Even so, there are some important issues that differentiate the application of DM, specifically to education, from howit is applied in other domains :
1. Objective: The objective of DM in each application area is different. For example, in EDM, there are both
applied research objectives, such as improving the learning process and guiding students’ learning, as well as pure research objectives, such as achieving a deeper understanding of educational phenomena. These goals are sometimes difficult to quantify and require their own special set of measurement techniques.
2. Data: In educational environments, there are many different types of data available for mining. These data are specific to the educational area, and therefore have intrinsic semantic information, relationships with other data, and multiple levels of meaningful hierarchy.
3. Techniques: Educational data and problems have some special characteristics that require the issue ofmining to be treated in a different way. Although most of the traditional DM techniques can be applied directly, others cannot and have to be adapted to the specific educational problem.
There are actually more groups involved with many more objectives, namely : 1. Learners/students
2. Educators/lecturers
3. Course/educational/researchers
4. Organizations/learning/providers/universities/privat training companies 5. Administrators
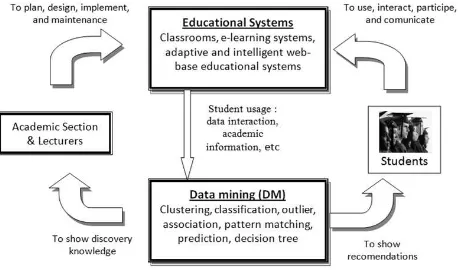
Figure 1. The cycle of applying data mining in educational systems
Jurnal Informatika dan Komputer (JIKO) – Vol. 2, No. 1, Februari 2017
helps to improve the learning process. The discovered knowledge can be used not only by providers (lecturers) but also by own users (students). So, the application of data mining in educational systems can be oriented to different actors with each particular point of view (figure 1). An existing learning management system is improved by using data mining techniques and increasing the efficiency of the courses using custom modules [8].
Frequency and percentage calculations were made with the data obtained. Majority of the administrators and teachers have moderate computer usage skills. The administrators and particularly the teachers can use internet for limited periods due to reasons such as internet connections at schools are not regular and number of computers connected to internet is low [9].
The main concern is, by assigning inappropriate program which is not reflected their overall interest; it may create serious problems such as poorly in academic commitment and academic achievement [10].
There are many studies that apply/compare several DM models that provide feedback. Association rules, clustering, classification, sequential pattern analysis, dependency modeling, and prediction have been used to enhance learning environments to improve the degree to which the educator can evaluate the learning process [11]. One way to achieve highest level of quality in higher education system is by discovering knowledge for prediction regarding enrolment of students in a particular course, alienation of traditional classroom teaching model, detection of unfair means used in examination, detection of abnormal values in the result sheets of the
students, prediction about students’ performance and so on. The knowledge is hidden among the educational data
set and it is extractable through data mining techniques. Data mining techniques in context of higher education by offering a data mining model for higher education system in the university [12].
The modest size dataset and well-defined problems are still rather hard to obtain meaningful and truly insightful results with a set of traditional data mining (DM) approaches and techniques including clustering, classification and association analysis [13]. The rough set theory can help solve uncertain problem well [14]. A system for analyzing student's results based on cluster analysis and uses standard statistical algorithms to arrange their scores data according to the level of their performance is described. A clustering algorithm is used for analyzing student's
result data. The model was combined with the deterministic model to analyze the students’ results of a private
which is a good benchmark to monitor the progress of academic performance of students in higher Institution for the purpose of making an effective decision made by the academic planners [15].
Rough sets may provide representation of clusters, where it is possible for an object to belong to more than one cluster. This is of particular interest when buffer zones between clusters are a buffer zone required to diminish the clustering mistakes. The objects in such a buffer zone need a second look before eventually being assigned to a cluster [16]. Data clustering under rough set theory show how variable precision rough set model can be used to
groups student in each study’s anxiety. The results may potentially contribute to give a recommendation how to design intervention, to conduct a treatment in order to reduce anxiety and further to improve student’s achivement [17].
The applicability data mining techniques are aimed to identify the main drivers of student satisfaction in education institutions [18]. The various data mining techniques like classification, clustering and relationship mining can be applied on educational data to predict the performance of a student in the examination and bring out betterment in his academic performance [19]. A computational method can efficiently assess the ability of students from of a learning environment capturing their problem solving processes [20]. An approach based on grammar guided genetic programming, which classifies students in order to predict their final grade based on features is extracted from logged data in a web based education system. This approach could be quite useful for early identification of students at risk, especially in very large classes, and allows the instructor to provide information about the most relevant activities to help students have a better chance to pass a course [21].
Predicting student failure at school has become a difficult challenge due to the high number of factors that can affect the low performance of students and the imbalanced nature of these types of datasets. A genetic programming algorithm and different data mining approaches are proposed for solving these problems using real data. To select the best attributes in order to resolve the problem of high dimensionality. Then, rebalancing of data and cost sensitive classification have been applied in order to resolve the problem of classifying imbalanced data [22]. Research results show that there is a marginal difference, suggesting giving students scaffolding questions is less effective at promoting student learning than providing them delayed feedback [23].
The various data mining techniques can be applied to the set of educational data and what new explicit knowledge or models discover. The models are classified based on the type of techniques used, including prediction and description [26].
Reduct is defined as the set of attributes which distinguishes the entities in a homogenous cluster. It is observed that most of the remaining attributes in the cluster has same value for attribute value pair. Reduct attributes are removed to formulate pattern by concatenating most contributing attributes [27]. Thereby determining the most dominant attribute of a set of attributes is necessary to accelerate the decision-making process.
III. ROUGH SET THEORY
In the 1980’s, Pawlak introduced rough set theory to deal with this problem. [28]. Similar to rough set theory it is not an alternative to classical set theory but it is embedded in it. Concepts of the rough set theory are discussed for approximation, dependence and reduction of attributes, decision tables and decision rules. The applications of rough sets are discussed in pattern recognition, information processing, business and finance, industry, environment engineering, medical diagnosis and medical data analysis, system fault diagnosis and monitoring and intelligent control systems[29]. Rough set theory has attracted attention to many researchers and practitioners all over the world, who contributed essentially to its development and applications. The original goal of the rough set theory is induction of approximations of concepts. The idea consists of approximation of a subset by a pair of two precise concepts called the lower approximation and upper approximation. Intuitively, the lower approximation of a set consists of all elements that surely belong to the set, whereas the upper approximation of the set constitutes of all elements that possibly belong to the set. The difference of the upper approximation and the lower approximation is a boundary region. It consists of all elements that cannot be classified uniquely to the set or its complement, by employing available knowledge. Thus any rough set, in contrast to a crisp set, has a non-empty boundary region. Motivation for rough set theory has come from the need to represent a subset of a universe in terms of equivalence classes of a partition of the universe. In this chapter, the basic concept of rough set theory in terms of data is presented.
Data are often presented as a table, columns of which are labeled by attributes, rows by objects of interest and entries of the table in the form of attribute values. By an information system, we mean a 4-tuple (quadruple) , where U is a non-empty finite set of objects, A is a non-empty finite set of attributes, , is the domain (value set) of attribute a, is a total function such that , for every , called information (knowledge) function. An information system is also called a knowledge representation systems or an attribute-valued system and can be intuitively expressed in terms of an information table (refer to Table 1).
TABLE I. AN INFORMATION SYSTEM
U/A a1 a2 .. ak .. a|A|
u1 f(u1,a1) f(u1,a22) .. f(u1,ak) .. f(u1,a|A|)
u2 f(u2,a1) f(u2,a22) .. f(u2,ak) .. f(u2,a|A|)
u3 f(u3,a1) f(u3,a22) .. f(u3,ak) .. f(u3,a|A|)
..
u|U| f(u|U|,a1) f(u|U|,a22) .. f(u|U|,ak) .. f(u|U|,a|A|)
This information is expressed by means of attributes used as descriptions of the objects. The data is treated from the perspective of set theory and none of the traditional assumptions of multivariate analysis are relevant. The Information system reveal all available knowledge about the object under review. In many applications, there is an outcome of classification that is known. This a posteriori knowledge is expressed by one (or more) distinguished attribute called decision attribute; the process is known as supervised learning. An information system of this kind is called a decision system. A decision system is an information system of the form , where D is the set of decision attributes and . The elements of C are called condition attributes.
The starting point of rough set theory is the indiscernibility relation, which is generated by information about objects of interest. The indiscernibility relation is intended to express the fact that due to the lack of knowledge we are unable to discern some objects employing the available information. Therefore, generally, we are unable to deal with single object. Nevertheless, we have to consider clusters of indiscernible objects. The following definition precisely defines the notion of indiscernibility relation between two objects.
Let S U, A,V, f be an information system and let B be any subset of A. Two elements x, yU are said to be B-indiscernible (indiscernible by the set of attribute B A in S) if and only if f x,af y,a, for every aB.
Jurnal Informatika dan Komputer (JIKO) – Vol. 2, No. 1, Februari 2017
relation induces unique partition. The partition of U induced by INDBin S U,A,V,fdenoted by U / B and the equivalence class in the partition U / B containing xU , denoted by xB.
The indiscernibility relation will be used to define set approximations that are the basic concepts of rough set theory. The notions of lower and upper approximations of a set can be defined as follows.
Let S U, A,V, f be an information system, let B be any subset of A and let X be any subset of U. The B-lower approximation of X, denoted by BX and B-upper approximations of X, denoted by BX , respectively, are defined by
(1)
From Definition the following interpretations are obtained
1. The lower approximation of a set X with respect to B is the set of all objects, which can be for certain classified as X using B (are certainly X in view of B).
2. The upper approximation of a set X with respect to B is the set of all objects which can be possibly classified as
X using B (are possibly X in view of B).
The accuracy of approximation (accuracy of roughness) of any subset X U with respect to B A, denoted X B
is measured by
(2)
where X denotes the cardinality of X. For empty set , it is defined that B1[30]. Obviously, 0BX 1
. If X is a union of some equivalence classes of U, then BX 1 . Thus, the set X is crisp (precise) with respect to B. And, if X is not a union of some equivalence classes of U, then BX1. Thus, the set X is rough (imprecise) with respect to B [30]. This means that the higher of accuracy of approximation of any subset X U is the more precise (the less imprecise) of itself. It means that the concept “Decision” can be characterized partially employing attributes Analysis, Algebra and Statistics.
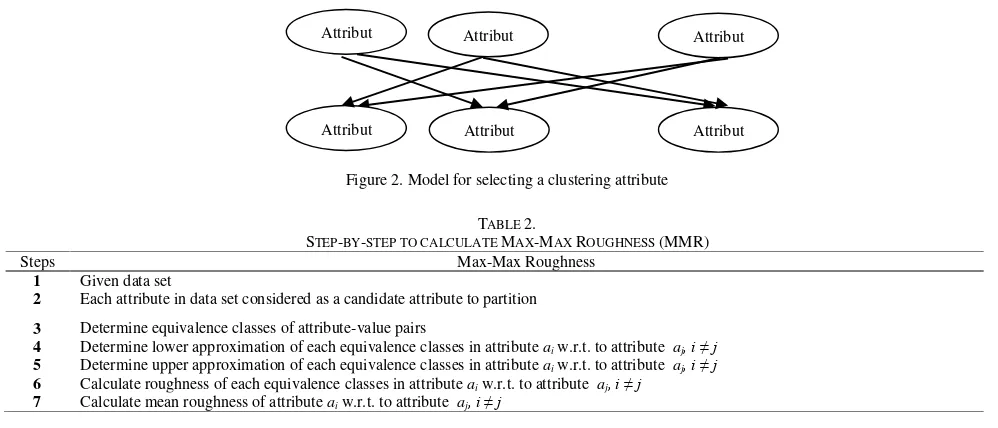
In this section, a technique for selecting a clustering attribute based on rough set theory is presented. This section, however, will be presenting the technique Max-Max Roughness to select the clustering attributes. To find meaningful clusters from a dataset, clustering attribute is conducted so that attributes within the clusters made will have a high correlation or high interdependence to each other while the attributes in other clusters are less correlated or more independent. Model for selecting a clustering attribute is given in figure 2. While the steps to calculate the Max-Max Roughness shown in table 2.
Figure 2. Model for selecting a clustering attribute
TABLE 2.
STEP-BY-STEP TO CALCULATE MAX-MAX ROUGHNESS (MMR)
Steps Max-Max Roughness
1 Given data set
2 Each attribute in data set considered as a candidate attribute to partition
3 Determine equivalence classes of attribute-value pairs
4 Determine lower approximation of each equivalence classes in attribute aiw.r.t. to attribute aj, i ≠ j
5 Determine upper approximation of each equivalence classes in attribute aiw.r.t. to attribute aj, i ≠ j
6 Calculate roughness of each equivalence classes in attribute aiw.r.t. to attribute aj, i ≠ j
7 Calculate mean roughness of attribute aiw.r.t. to attribute aj, i ≠ j
Example, suppose data from student’s values is given, as shown in table 3 There are 5 students with 5 attributes
(assessment)
TABLE 3.ASTUDENT DECISION SYSTEM
Student/ Assessment A1 A2 A3 A4 A5 Grade
1 49 70 60 70 90 B
2 88 60 80 70 90 A
3 59 60 85 75 75 B
Attribut
1
Attribut
Attribut
Attribut
Attribut
The following values are obtained from table 3
U = {1,2,3,4,5}; A = {A1,A2,A3,A4,A5,Grade}; Where
C = {A1,A2,A3,A4,A5}; D = {Grade},
VA1={30,45,49,59,88}; VA2={60,70,75}; VA3={45,60,70,80,85}; VA4={60,70,75};
VA5={75,90}; VGrade={A,B,C}
a. S(A1=30)={4}, S(A1=45)={5}, S(A1=49)={1}, S(A1=59)={3}, S(A1=88)={2} b. S(A2=60)={2,3}, S(A2=70)={1,4}, S(A2=75)={5}
c. S(A3=45)={4}, S(A3=60)={1}, S(A3=70)={5}, S(A3=80)={2}, S(A3=85)={3} d. S(A4=60)={4}, S(A4=70)={1,2,5}, S(A4=75)={3}
e. S(A5=75)={3,4,5}, S(A5=90)={1,2}
Calculating of roughness and mean roughness
First, determining of upper and lower approximations of singleton attribute with respect to other different singleton attribute. Then calculate the roughness and the average roughness of each attribute
Attribute A1
For attribute A1, it is clear that |V(a1)|=5. The roughness and the mean roughness on A1 with respect to Ai, i 2,3,4,5
is calculated as the following.
1. With respect to A2
The lower and upper approximations are
}
The lower and upper approximations are
}
The lower and upper approximations are
}
The lower and upper approximations are
Jurnal Informatika dan Komputer (JIKO) – Vol. 2, No. 1, Februari 2017
1 1 1 ) 59 1 | (
4S A
RA
0 3 0 ) 88 1 | (
4S A
RA
Mean roughness
4 , 0 5
0 1 0 0 1 ) 1 (
RoughA4 A
0 3 0 ) 59 1 | (
5S A
RA
0 2 0 ) 88 1 | (
5S A
RA
Mean roughness
0 5
0 0 0 0 0 ) 1 (
RoughA5 A
Likewise, The roughness and the mean roughness on A2 and so on, thus obtained (table 4 ).
TABLE 4.
MEAN ROUGHNESS MAX-MAX ROUGHNESS
Mean Roughness MMR
a1 a2 a3 a4 a5 1; 0.4
0.2 1 0.4 0
a2 a1 a3 a4 a5 1; 1; 0.167
1 1 0,167 0
a3 a1 a2 a4 a5 1; 0.4
1 0,2 0,4 0
a4 a1 a2 a3 a5 1; 1; 0.133
1 0,067 1 0,133
a5 a1 a2 a3 a4 1; 1; 0.2
1 0,1 1 0,2
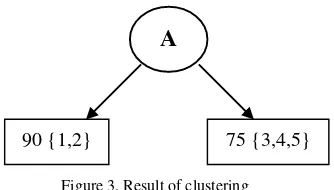
Clustering result based on the Splitting attribute A5 : { 1, 2 } and { 3, 4, 5 }. In this example where there are more than two attributes, the splitting is on the attribute value which has the overall maximum roughness versus the other attributes. The partition at this stage can be represented as a tree and is shown in figure 3.
Figure 3. Result of clustering
So it can be said that the purity of the cluster which is the percentage of the dominant class label within each cluster. The higher the number of the dominant class label within each cluster, the higher the level of purity of the cluster. Cluster purity is used as a determination of the accuracy or quality of the group made. However, clustering is an unsupervised learning process does not deal with the label or standard dataset. Therefore, the assumptions made in which all samples are thought to be members of the dominant class is actually for the cluster. The greater the value of purity indicates good clustering [31].
IV. EXPERIMENTALRESULT
1. Datasets
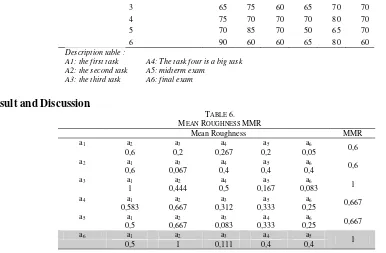
Data were taken from the assessment of architectural design studio course at the architectural program University Technology Yogyakarta Indonesia. The number of respondents was 150 students. Assessment consists of five components, namely the first task, the second task, midterms, the third task, the fourth task, and a final exam. This assessment is conducted in odd semester of academic year 2010/2011 of the fourth semester students. Evaluation criteria used range from [0-100]. The first task and the second task given to students individually to complete case studies provided by lecturers. The third task is a group of students made a paper to be presented. Task four is a big task that the invidual create a design. Midterms done in the middle of the semester is done in writing, the final exams is given at the end of the semester. Both are done on a scheduled basis. students’ name, age, race, and the force were not necessary in this assessment. From these data later in the process to give weight or a certain percentage to get the final value in the form of A for the highest value to the E to the lowest value. The rough set theory is to classify and determine the most dominant attributes of the six components. Sample of the data is shown in Table 5.
TABLE 5.
LIST ASSESSMENT OF THE ARCHITECTURAL DESIGN STUDIO COURSE
STUDENT/ASSESSMENT A1 A2 A3 A4 A5 A6
1 70 80 70 80 75 65
2 60 60 80 50 70 60
A
5 70 85 70 50 65 70
6 90 60 60 65 80 60
Description table :
A1: the first task A4: The task four is a big task A2: the second task A5: midterm exam
A3: the third task A6: final exam
2. Result and Discussion
TABLE 6.
MEAN ROUGHNESS MMR
Mean Roughness MMR
a1 a2 a3 a4 a5 a6 0,6
0,6 0,2 0,267 0,2 0,05
a2 a1 a3 a4 a5 a6 0,6
0,6 0,067 0,4 0,4 0,4
a3 a1 a2 a4 a5 a6 1
1 0,444 0,5 0,167 0,083
a4 a1 a2 a3 a5 a6 0,667
0,583 0,667 0,312 0,333 0,25
a5 a1 a2 a3 a4 a6 0,667
0,5 0,667 0,083 0,333 0,25
a6 a1 a2 a3 a4 a5 1
0,5 1 0,111 0,4 0,4
From table 6. Clustering result based on the Splitting attribute A6 : { 1 }, { 2,6 }, { 3,4,5 }. In architectural design studio course where there are more than two attributes, the splitting is on the attribute value which has the overall maximum roughness versus the other attributes. The partition at this stage can be represented as a tree and is shown in figure 4.
Figure 4. Result of clustering dataset
V. CONCLUTIONSANDLIMITATIONS
Rough set theory has been used as an attribute for the selection of a college student assessment. The approach described in this paper is Max-Max Technique Roughness (MMR). Data were obtained from the subjects of architectural design studio at the Department of architecture University Technology Yogyakarta. The results indicate that the dominant attributes on other attributes can be specified, other attributes can be ignored, so that the process of assessment and provision of recommendations can be made more quickly. For future studies, the development of methods and software need to be better. Thus able to handle larger data and complex.
This technique is more focused on categorical data, whereas in a real database, variety and range of data is enormous. Data is transformed into a form category. Not all data can be processed well by this technique. Data must be transformed into data category. In this technique, this is still done separately. Data transformation has not been conducted properly. The amount of cluster was not specified by the user, and the number of clusters generated may not match expectations.
REFERENCES
[1] Petrovic, N., S. Isljamovic, and V. Jeremic, A new concept for measuring achievement levels in higher environmental education. Energy Education Science and Technology Part B: Social and Educational Studies. 5(3): p. 809-818,(2013).
[2] Trandafili, E., et al. Discovery and evaluation of student's profiles with machine learning. in 5th Balkan Conference in Informatics. Novi Sad,(2012). [3] Obadi, G., et al. A Tolerance Rough Set Based Overlapping Clustering for the DBLP Data. in IEEE/WIC/ACM International Conference on Web
Intelligence and Intelligent Agent Technology.(2010).
[4] Simko, M. and M. Bielikova. Automatic Concept Relationships Discovery for an Adaptive E-course. in International Conference Educational Data Mining. Cordoba, Spain,(2009).
[5] Sachin, B.R. and S.M. Vijay. A Survey and Future Vision of Data mining in Educational Field. in Second International Conference on Advanced Computing & Communication Technologies. IEEE Computer Society,(2012).
[6] Baepler, P. and C.J. Murdoch, Academic Analitics and Data Mining in Higher Education. International Journal for the Scholarship of Teaching and Learning. 4(2): p. 1-9,(2010).
[7] Romero, C., S. Ventura, and P.D. Bra. Knowledge discovery with genetic programming for providing feedback to courseware author. Kluwer Academic Publisher,(2004).
A6
Jurnal Informatika dan Komputer (JIKO) – Vol. 2, No. 1, Februari 2017
[8] Blagojevic, M. and Z. Micic, A web-based intelligent report e-learning system using data mining techniques. Computers and Electrical Engineering: p. 1-10,(2012).
[9] Gokyer, N., Evaluation of internet usage in education by administrators and teachers serving in secondary education schools. Energy Education Science and Technology Part B: Social and Educational Studies. 5(705-716),(2013).
[10] Abdullah, Z., et al., Extracting highly positive association rules from students‟ enrollment data. Procedia - Social and Behavioral Sciences. 28: p. 107-111,(2011).
[11] Zaiane, O. Web Usage Mining for a BetterWeb-Based Learning Environment. in Conf. Adv. Technology Education. Canada: Banff, AB,(2001). [12] Baradwaj, B.K. and S. Pal, Mining Educational Data to Analyze Student Performance. (IJACSA) International Journal of Advanced Computer Science
and Applications. 2(6): p. 63-69,(2011).
[13] Pechenizkiy, M., et al. Mining the Student Assessment Data : Lessons Drawn from a Small Scale Case Study. in Int. Conf. Educational Data Mining. Montreal, QC, Canada,(2008).
[14] Chiu, D.Y., Y.C. Pan, and W.C. Chang. Using Rough Set Theory to Construct E-Learning FAQ Retrieval Infrastructure. in IEEE Ubi-Media Computer Conference. Lanzhou, China,(2008).
[15] Oyelade, O.J., O.O. Oladipupo, and I.C. Obagbuwa, Application of k-Means Clustering algorithm for prediction of Students’ Academic Performance.
International Journal of Computer Science and Information Security. 7(1): p. 292-295,(2010).
[16] Lingras, P. and G. Peters. Applying Rough Set Concepts to Clustering. in Springer-Verlag London Limited. London,(2012).
[17] Yanto, I.T.R., et al., Applying variable precision rough set model for clustering student suffering study’s anxiety. Expert Systems with Applications.
39: p. 452–459,(2012).
[18] Dejaeger, K., et al., Gaining insight into student satisfaction using comprehensible data mining techniques. European Journal of Operational Research.
218: p. 548–562,(2012).
[19] Kumar, S.A. and M.N. Vijayalakshmi. Mining of student academic evaluation records in higher education in International Conference on Recent Advances in Computing and Software Systems. Chennai,(2012).
[20] Lee, Y.J., Developing an efficient computational method that estimates the ability of students in a Web-based learning environment. Computers & Education. 58: p. 579-589,(2012).
[21] Zafra, A. and S. Ventura, Multi-instance genetic programming for predicting student performance in web based educational environments. Applied Soft Computing Journal. 12(8): p. 2693-2706,(2012).
[22] Márquez-Vera, C., et al., Predicting student failure at school using genetic programming and different data mining approaches with high dimensional and imbalanced data. Applied Intelligence: p. 1-16,(2012).
[23] Feng, M., J.E. Beck, and N.T. Heffernan. Using Learning Decomposition and Bootstrapping with Randomization to Compare the Impact of Different Educational Interventions on Learning. in International Conference Educational Data Mining. Cordoba, Spain,(2009).
[24] Dekker, G.W. Predicting students drop out: a case study. in International Conference Educational Data mining. Cordoba, Spain,(2009).
[25] Mishra, K.K., A. Tripathi, and A.K. Misra, A performance evaluation tool for behavioral analysis of students. Journal of Applied Sciences. 12(15): p. 1572-1579,(2012).
[26] Delavari, N., S. Phon-amnuaisuk, and M. Beikzadeh, Data mining application in higher learning institutions. Informatics in Education Journal. 7(1): p. 31-54,(2008).
[27] Upadhyaya, S., A. Arora, and R. Jain, Deriving Cluster Knowledge Using Rough Set Theory. Journal of Theoretical and Applied Information Technology. 4(8): p. 668-696,(2008).
[28] Pawlak, Z., Rough Sets. International Journal of Computer and Information Sciences. 11(5): p. 341-356,(1982).
[29] Wu, C., et al., The rough set theory and applications. Engineering Computations: Int J for Computer-Aided Engineering. 21(5): p. 488-511,(2004). [30] Pawlak, Z. and A. Skowron, Rudiments of rough sets. Information Sciences. 177(1): p. 3-27,(2007).