SHAPING URBAN SPATIAL STRUCTURE
From Policy to Energy Consumptionby : Beta Paramita1
A. Introduction
Cities in Asian countries have many similarities in regard to its form and shape, especially in the south-east Asian regions. The history of the city trace back along the transportation stripe (mainly rivers) with its linear character. Singapore, Indonesia, Malaysia, Thailand, Vietnam, Cambodian, and
Philippine were have a main river in their major cities respectively. Water was become the main reason for some people to build their houses along the river.
It is interesting to discuss the urban spatial structure since cities growth patterns are undergoing quantitative and qualitative change. For the last two centuries, cities have been sprawling out, then
the process of decentralization has taken a more polycentric form, with a number of concentrated
employment centers making their mark on both employment and population distribution. 2Indonesia
-with around 240 million people inhabitant, as the 4th populous country in the world is facing
demography’s problem on an urban spatial structure associated with the population growth, such as land use, water supply, equipping settlement and its facilities.
This paper will describe the correlation between the spread of the city growth, urban spatial structure, spatial policies and regulations and then finally the urban energy consumption. Overcrowded
residential areas along Cikapundung River in the middle of Bandung City will be taken as a case study.
(keywords: urban spatial structure, spatial policies, energy consumption)
1. Urban Structure
Urban structure was established as the result of complex sources, such as: history, economy,
politic as well as its unique character of urban geomorphology. Gradually, all of these aspects will
create some demographic problems of the city like overcrowded population, needs of land,
limited access to clean water, bad sanitation and city infrastructures as well as lack of public
spaces, including green open space. The physical aspect of urban structure is the urban form,
and it is closely related to scale and has been described as the ‘morphological attributes of an
urban area at all scales. (Williams et al., 2000) 2
Urban form generally encompasses a number of physical features and nonphysical
characteristics including size, shape, scale, density, land uses, building types, urban block
layout and distribution of green space.
3
1
Doc. student at Kitakyushu University, Lecturer at Indonesia University of Education, researcher and professional at urban design and environmental science
2
In Jenks, Mike, 2010
3
Density, will be the most crucial elements of urban form, such as land use and access to
services – for example, for a service or facility to be viable, it needs to serve a population of a
particular size. Density, on the one hand, can be seen as an outcome of the competition
between land uses within a given urban transport infrastructure and its associated pattern of
accessibility. On the other hand, it is a policy goal as it is also an input into the quality of
urban life through the viability of services provision and availability of public and private
space. Density has therefore been used as a tool to measure the viability of public transport
infrastructure and other service provision, the feasibility of certain land uses, particularly
commercial and service, in urban design and construction. At what point density becomes
high (or too high) is unclear, but in recent years planning policy and practices in many
countries have been attempting to increase the average density of new development.
Thus, this paper tries to describe the relationship between urban form and sustainable
development, which have a strong effect to energy use. In particular, it outlines a typology of
city forms. The three main archetypal urban forms discussed are: the linear city; the city set
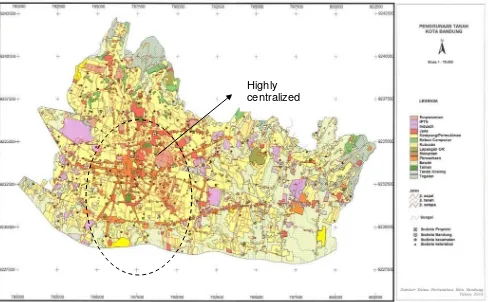
out in the form of a grid; and the highly centralized or inward-looking city. The regularities and
irregularities of urban structure on this paper will be described by using land-use in 2009 of
Bandung City, and it will be explained in the degree of spatial concentration of urban
population and the form of town. The research concentrates on the physical design of urban
form with respect to: physical configuration and layout, including links to the wider urban
system; its land uses and functions; the typology and density of built form.
2. Urban Settlement in Bandung
Bandung is mention as the most attractive city in Indonesia, this city as never sleep. The
distance from Jakarta is about the 128km or 3hours trip. It made Bandung as backyard of
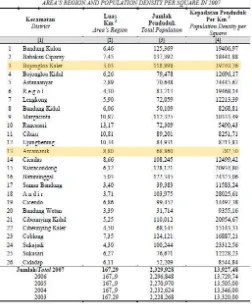
Jakarta citizen. The population of Bandung City is 2.329.928 persons, which determines the
growth rate 1,88%. The average of population density in Bandung City is 13.927,48
pr/sq. This density is not including the commuters from a periphery who work to Bandung in
a day, and there will be around 3 million in Bandung in working hours. The limited land and
with the population growth, such as land use, water supply, equipping settlement and its
facilities.
Fig. 1 Land use of Bandung city, 2003 Source : BPN (National Land Administration Agency)
In 2000, land use for settlement has already occupied 53% of total land use, which is
8.866.715 ha and accommodate for 2.136.260 inhabitant of Bandung citizen. In 2013, the
planning of land use for settlement already set maximum 60% of total Bandung’s land, which
is 10.037. 790ha and prepared to accommodate for 2.944.860 inhabitant. The land's rest is
counted as 1.171.075ha, which is very limited land compare to the inhabitant who is needed
to be settled, the other problem that may have to face is the spread of the inhabitant in
Bandung wasn’t in the same amount and condition. The dense district is Bojongloa Kaler
with 39.240pd/km2 and the lowest dense district is Arcamanik with 782.5pd/km2. The limited
land then became the most problem in Bandung in supplying house demand, with the
population increasing from year to year. It's become urgent matters to be addressed.
The number of urbanization, limited subsidized house, uncontrolled birth and the other
helplessness of demography’s problem are such a classic problem in big city-like Bandung, Highly
its force incompetent citizens to supply their demands as their own ways and the other hand
infirmness of the legal aspects could not clearly be operated. The urban structure of Bandung
now, is the result of stack of the land use problem, which create the dense and tend to slum
area.
B. Urban Structure as The Result of Historical and Political Will
The layouts of today’s cities are largely
artifacts of their historical development and
planning and building regulations. The
configuration of the street network, in terms
of its urban block sizes, their overall
location within the city, pedestrian and
vehicular connectivity, can affect the
functioning of a city by, for example,
influencing the location intensity of activities
(Penn et al., 1998; Porta et al., 2008).
1. Density and Land-use
As one element of urban form of the most
influential in shaping the structure of the city,
it is necessary to set out the measurement
and assessment of the density of a city.
See population density of Bandung at
Table 1.
Recent moves towards the creation of more sustainable towns and cities that offer a high
quality of life whilst minimizing resource consumption (such as energy, land and water), have
reawakened interest in the concept of density. The benefits of seeking higher-density levels
in overall terms are well recognized especially in the context of delivering mixed-use
development where a minimum housing density is required to sustain non-residential uses. 4
4
llewelyn – davies, Urban Design Compendium,2001
It should be shaping the mass of built form to frame positive, but unfortunately somehow in
the high dense area, this artifact resulting in negative scenery of a city.
In contrast, much recent development, which may have exactly the same population density
of its traditional counterpart, is characterized by flat, featureless density profiles. This is the
product of building down to imposed standards or density levels, such as 25-30 dwellings or
150 - 200 habitable rooms per hectare. Built form is distributed and density bumps ironed out.
2. Slum, an Excess of Density
Density is a measure. How comfortable a place feels is a matter of the design and its social
characteristics. Somehow, overcrowded is closely to slum area, since the high needs of a
land and infrastructure requirements which is often neglected by local government also the
growth rate of building that do not meet the rule of building regulation. That condition then
shows in the urban spatial structure as an unplanned area. The density of population and
building should be equilibrated with the equipping of infrastructure, if there is no powerful
policy to settle down the accretion of building or the urban sprawl, so that would be crashed
with urban land use and also give impact to urban form, which is finally set up the urban
structure irregularly and could be said as a slum area.
The definition of slum area by UN Habitat: slum is an area that combines to various extents
the following characteristics, such as :
a. Inadequate access to safe water
b. Inadequate access to sanitation and other infrastructure
c. Poor structural quality of housing
d. Overcrowding
e. Insecure residential statue
In Indonesia, slum area is defined by 6(six) criteria, which are: 5
a. Vitality area in non economic aspect (congruity with urban planning, physical condition of
building, demographic condition)
b. Vitality of economic aspect (existence to the surrounding, distance to activity, function of
surrounding area)
c. Land statue (domination of legal aspect, domination of ownership of land)
5
d. Infrastructure (street, drainage, water service, sewage, solid waste)
e. Government commitment ( institutional, fund)
f. Priority of handling the problem (management plans, physical improvement)
From the criteria above, urban form of Bandung will be accessed to measure the physical
quality and to classify area (district) as an urban artifact. The density tend to slum, if the
building in 1ha more than 100unit, and habitable room more than 25unit/ha. To assess the
dense area as a slum area, it is made a typology of housing which is divided into 3 typologies
with their characteristics, and shown in table 2.
Table 2. Typology Slum Settlement Based On Physical Characteristic
No Typology Code Characteristic
1 High slum HS Settlement area with water service less than 30%, condition of outer main of sewage and drainage less than 30%, the breakage of neighborhood street and connection more than 70%. Building density more than 100 unit/ha, the distance between building less than 1m, Building Coverage (BC) more than 70% without open space in the neighborhood. The growth of building construction in a high rate.
2 Medium slum
MS Settlement area with water service between 30-60%, condition of outer main of sewage and drainage 30-60%, the breakage of neighborhood street and connection are 50-70%.
Building density between 80-100 unit/ha, the distance between building are 1,5-3 meter, Building Coverage (BC) 50-70%. The growth of building construction in a medium rate.
3 Low slum LS Settlement area with water service more than 60%, condition of outer main of sewage and drainage more than 60%, the breakage of neighborhood street and connection are less than 50%. Building density less than 80 unit/ha, the distance between building are more than 3 meter, Building Coverage (BC) less than 50%. The growth of building construction in a low rate.
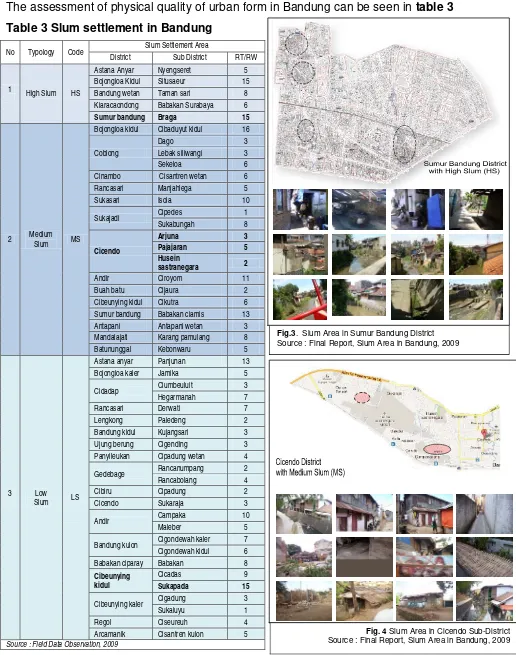
The assessment of physical quality of urban form in Bandung can be seen in table 3 Table 3 Slum settlement in Bandung
No Typology Code Slum Settlement Area
District Sub District RT/RW
1
High Slum HS
Astana Anyar Nyengseret 5
Bojongloa Kidul Situsaeur 15 Bandung wetan Taman sari 8 Kiaracaondong Babakan Surabaya 6
Sumur bandung Braga 15
2 Medium Slum MS
Bojongloa kidul Cibaduyut kidul 16
Coblong
Cibeunying kidul Cikutra 6 Sumur bandung Babakan ciamis 13
Antapani Antapani wetan 3
Mandalajati Karang pamulang 8
Batununggal Kebonwaru 5
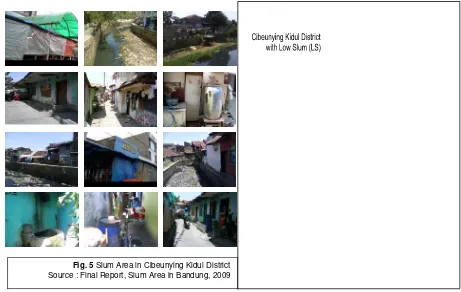
3 Low Slum LS
Astana anyar Panjunan 13
Bojongloa kaler Jamika 5
Cidadap Ciumbeuluit 3
Hegarmanah 7
Rancasari Derwati 7
Lengkong Paledeng 2
Bandung kidul Kujangsari 3
Ujung berung Cigending 3
Panyileukan Cipadung wetan 4
Gedebage Rancanumpang 2
Rancabolang 4
Cibiru Cipadung 2
Cicendo Sukaraja 3
Andir Campaka 10
Maleber 5
Bandung kulon Cigondewah kaler 7 Cigondewah kidul 6
Babakan ciparay Babakan 8
Cibeunying kidul
Cicadas 9
Sukapada 15
Cibeunying kaler Cigadung 3
Sukaluyu 1
Regol Ciseureuh 4
Arcamanik Cisantren kulon 5
Source : Field Data Observation, 2009
Fig. 4 Slum Area in Cicendo Sub-District Source : Final Report, Slum Area in Bandung, 2009
C. Environment and Energy Implication
The negative effects from the inner to the use of energy and its impact on the environment and energy consumption still requires further research, but at least here can be described in general, the impacts that occur every day in the slums
The lack of open space in the slum area, give a complex impact to many aspects, such as:
1. The availability of daylight, which means people in this area, live in the dark and the demands of electricity much greater
2. The high of temperature and also humidity inside the house force them to use fan to make the better air circulation. Bandung is tropical city, so the highest temperature (day) is average 32ºC and the lowest (night) 19ºC and the humidity reach between 70-90%.
3. The limitation of area of infrastructure placement made the absence of sewerage lines, either overflow of rain water, dirty water from house, in some case all this liquid waste is directly pour to river.
4. No access for waste transport vehicle, accumulate of solid waste. In some river bank settlement, the solid waste discharged into the river whereas the river is a source of clean and drinking water for Bandung. Beside for clean and drinking water, Cikapundung River is one of river which is supplying for hydroelectric-power, which is downstream to Citarum River. There are three power using water discharge Citarum watershed as its supply, i.e.
power Ir H. Juanda (Jatiluhur), Hydroelectric-power Saguling, and hydroelectric-power Cirata. Hydroelectric-power plant supplying electricity to the island of Java, Madura, and Bali. Calculations obtained from the three hydropower in Citarum river flow was produced energy equivalent fuel oil by 16 million tons / year
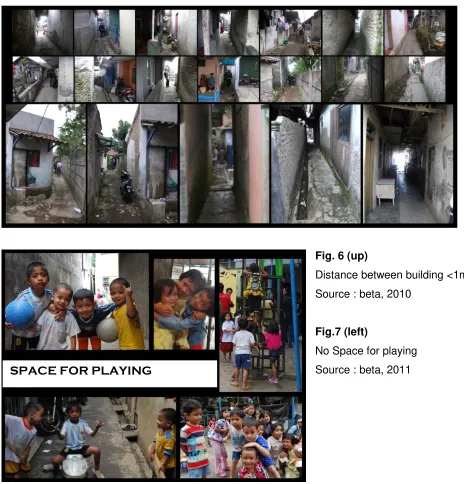
5. No space for social activity, this is bad for children because they lost their space for playing, and also people live here sometimes neglected between private or public space
Some of urban structure problem in slum area could be seen as figure below :
Fig. 6 (up)
Distance between building <1m Source : beta, 2010
Fig.7 (left)
No Space for playing Source : beta, 2011
Fig.8 solid waste in River change to reuse product as bag an home equipment The volunteer of Cikapundung River, enjoy the water
Source; Beta, 2010
Fig.9 Solid waste accumulation in the corner of area functioned as landfills
D. Reference
Bentley, I., Alcock, A., Murrain, P., McGlynn, S. and Smith, G. (1985) Responsible Environments –
A manual for designers. London: The Architectural Press.
Gaffron, Philine., Huismans, Gé., Skala, Franz. (2008) Ecocity : How to Make it Happen (Book II),
Vienna, Facultas Verlags- und Buchhandels AG
Jenks, M., Burton, E. and Williams, K. (eds) (1996) The Compact City: A Sustainable Urban
Form?, E & FN Spon, London.
Jenks, Mike., Burgess, Rod., (2000) Compact Cities : Sustainable Urban Forms for Developing
Countries, New York, Spon Press
Jenks, Mike., Jones, Colin. (2010) Dimensions of the Sustainable City
Kivell, Philip. (1993) Land and The City : Patterns And Processes Of Urban Change, London, Routledge
Lang, John., (2005) Urban Design:A Typology of Procedures And Products, Oxford, The Architectural Press
Lawson, Bryan. (2001) The Language of Space, London, The Architectural Press.
Llewelyn-Davies, Urban Design Compendium, English Partnership and The Housing Corporation
McDonnell, Mark J., Hahs, Amy K., Breuste, Ju¨rgen H. (eds) (2009) Ecology of Cities and Towns : A
Comparative Approach, Cambridge University Press
Moughtin, Cliff., Shirley, Peter. (2005) Urban Design: Green Dimensions – Second Edition, London : The Architectural Press
Indonesian Public Work Department, Guidelines for Identification of Slum Settlement Area in Metropolitan-Ring Buffer, 2006
Newman, Peter., Jennings, Isabella (2008) Cities as Sustainable Ecosystems : Principle and Practice,
Washington, Island Press
Salingaros, Nikos A. (2005)Principles of Urban Structure, Amsterdam – Holland, Techne Press Scott, Andrew and Joseph, Eran Ben,. (2009) Re-New Town, Massachusetts Institute of Technology