T H E J O U R N A L O F H U M A N R E S O U R C E S • 47 • 3
Ability into Different Schools
A Natural Experiment
Nina Guyon
Eric Maurin
Sandra McNally
A B S T R A C T
The tracking of pupils by ability into elite and nonelite schools represents a controversial policy in many countries. There is no consensus on how large the elite track should be and little agreement on the effects of any further increase in its size. This paper presents a natural experiment where the increase in the size of the elite track was followed by a significant im-provement in average educational outcomes. This experiment provides a rare opportunity to isolate the overall effect of allowing entry to the elite track for a group that was previously only at the margin of being admitted.
I. Introduction
The tracking of students by ability into different school types is a widespread, but highly controversial policy, with some countries starting to track as early as age ten (Germany, Austria) whereas other countries start tracking much later, after the years of compulsory schooling (United States, United Kingdom,
Nina Guyon is a PhD candidate at the Paris School of Economics and a research associate at LIEPP-Sciences Po Paris. Eric Maurin is a professor at the Paris School of Economics. Sandra McNally is a senior research fellow at the Centre for Economic Performance, London School of Economics. The au-thors thank participants at EALE/SOLE conference in London, JMA conference in Angers, EEA confer-ence in Glasgow as well as “Frontier of Economics of Education” conferconfer-ence in Tel Aviv. The authors are very grateful to the Department of Education, Northern Ireland for providing data and much useful information. In particular, the authors would like to thank Ivor Graham, John Toogood and Patricia Wyers. The authors are grateful for helpful comments and information from Tony Gallagher. The authors thank Patrick Puhani for very helpful discussions and also for information about detracking in Germany. The authors thank Reyn Van Ewijk and Edwin Leuven for information about detracking in The Nether-lands. The data used in this article can be obtained beginning January 2013 through December 2016 from Eric Maurin, Paris School of Economics, 48 Boulevard Jourdan, 75014 Paris, eric.maurin@ens.fr. This is subject to permission being obtained from the data providers.
[Submitted October 2010; accepted July 2011]
France). The selection of a fraction of high-ability students into a subset of elite schools modifies the peer groups and school context for all students. The net impact of such a strategy is extremely difficult to identify, as is the net effect of any edu-cation expansion policy relying on increased access to the more elite track. On the one hand, an increase in the size of the elite sector may have a positive effect on the group of students who are allowed entry to elite schools and who were only at the margin of being admitted before the expansion policy. On the other hand, such an expansion may dilute the value of education received by high-ability students, while negatively affecting the school context of the low and middle-ability students who remain in the nonelite sector, which could mean an overall negative effect on average performance. Even in countries where there is no tracking at school-level, this becomes an issue when considering whether we should develop public schools specifically designed for academically talented pupils from deprived neighborhoods, such as various types of “magnet” schools in the United States or newly created “Internats d”excellence” in France.
It is very difficult to shed light on these issues. One basic problem is that more selective areas (or countries) differ in many respects to those which are less selective. Hence, a comparison of average outcomes in more or less selective education sys-tems does not provide a credible strategy for evaluating the true effect of educational tracking. Several countries, including Germany and the Netherlands, have experi-enced increases over time in the relative size of the most selective track of their lower secondary school system, but these evolutions have been either gradual or caused by reforms that have changed the education system in other ways.1Thus, it is difficult to ascertain the specific effects of “detracking” in these countries. Overall, there is still little convincing evidence about how variation in the relative size of the elite and nonelite tracks affects average educational outcomes. This is the sub-stantive question that we address in this paper.
We make use of a unique natural experiment where the distribution of students by ability across secondary schools was modified within Northern Ireland at a par-ticular point in time (1989). The secondary school system in Northern Ireland in-volves the distribution of students across a small set of elite schools and a much larger set of nonelite schools, where elite schools select about a third of students who obtain the best results at a national ability test taken at the end of primary school (at age 11). In 1989, elite schools were required to accept pupils up to a new (larger) admission number determined only by “physical capacity,” where “physical capacity” was defined on a school-by-school basis by the Northern Ireland Education Department.
This reform led to a significant increase in the overall proportion of pupils in the elite track (“grammar schools”) at the beginning of their secondary school education. Furthermore, the impact was very significant in some areas of Northern Ireland, but almost negligible in other areas (plausibly those where elite schools were considered already near “full capacity” before the reform). This natural experiment allows
tification of the effect of an increase in the share of pupils selected into elite schools on average educational attainment, by comparing average outcomes just before and after the reform as well as the distribution of average outcomes across local areas just before and after the reform. The attractiveness of this experiment is that the detracking reform is the only change that occurred during the period of interest. Most educational expansion reforms have several very different components whose effects cannot be separately identified. To the best of our knowledge, the reform in Northern Ireland is the first where it is possible to isolate the net effect of an increase in the relative size of the elite track. It is important to note that this question is very different from one that investigates the impact of attending the elite track for the marginal student. Our approach identifies the net effect of an increase in the size of the elite track for all students (whether they attended the elite track or not).
We use administrative data covering the entire relevant population to examine the impact of the reform on entry flows to elite schools and the outcomes of affected cohorts. There is a clear discontinuity in the overall inflow to elite schools just after the reform—the number of students entering elite schools increased by about 15 percent between the 1978 and 1979 birth cohorts whereas it was reasonably stable for the three preceding and three subsequent cohorts. This discontinuity is reflected in outcome measures. For example, the number of students obtaining three or more A-levels at age 18 (a typical entry qualification for university) increased by about 10 percent over the same period whereas it followed the same stable trend as the number attending grammar school in the three preceding and subsequent cohorts. The increase is also reflected in GCSE examinations (General Certificate of Sec-ondary Education), which are the national examinations taken by all students at age 16, just prior to the end of compulsory education. The reform has been accompanied by a clear discontinuous improvement in average educational outcomes, which pro-vides the first piece of evidence for a positive effect of increasing the proportion of pupils in the elite track. We show that this is also reflected in university entry rates. As expected, our administrative data also reveal significant heterogeneity in the effect of the reform within Northern Ireland across local areas. In some areas, the reform was followed by a very significant shift in the proportion of pupils selected into elite schools. In other areas, the reform produced only very small changes. We find that the reform produced shifts in educational achievement at age 16 or 18, which are much more significant in areas where the initial shift in elite school attendance was stronger.
of losing more able peers on the group of students entering nonelite schools after the reform; the effect of having less able peers on the group of students who would have entered the elite school even in the absence of the reform. Separately identi-fying these effects would amount to identiidenti-fying the effect of changes in school type (or school context) for different ability groups, which is notoriously difficult. As shown in the last part of the paper, it is nonetheless possible to provide lower bound estimates of these effects by analyzing the effect of the reform separately on elite and nonelite school outcomes. Interestingly, we find that the reform had a negative effect on average performance in nonelite schools, but not in elite schools, in spite of a decline in the average ability of their students. Hence, elite students do not seem to suffer from attending more heterogeneous schools with additional, relatively less able, peers. Also, students at the margin of being selected to elite schools seem to perform as well as top-ability students when they are actually selected into these schools and benefit from a “high-ability” school context. Thus, increasing the share of the elite sector seems to generate positive externalities for mid-ability students, but no negative externalities for top-ability students. This is a plausible reason for why this policy has such a strongly positive net effect on average outcomes.
The remainder of the paper is structured as follows. In Section II we briefly discuss the relevant literature. In Section III, we describe the institutional context and the reform. In Section IV, we present our administrative data as well the con-struction of the panel of local areas in Northern Ireland that is used in the econo-metric analysis. In Section V we provide several sets of estimates of the elasticity of the number of students passing national examinations at age 16 or 18 to the proportion selected into elite schools at age 11. Section VI provides a discussion of our basic results, building on a separate analysis of the effect of the reform on elite and nonelite schools. Section VII concludes.
II. Literature
Several recent strands of U.K. and international literature on school segregation by ability are relevant to our study. Using a panel of about 20 countries, Hanushek and Wo¨ßmann (2006) identify the effect of tracked secondary school systems by comparing performance differences between primary and secondary schools across tracked and nontracked systems, where each country’s own primary school outcome is included as a control. They find that tracked systems tend to increase educational inequality and to reduce average performance to some extent, although this effect is only marginally significant. These findings have been chal-lenged by Waldinger (2007) who finds that results are not stable to using different tracking measures and to restricting the sample to OECD countries.
to estimate the effect of exposure to a tracked system on educational outcomes (regardless of the school type actually attended by an individual). Atkinson et al. (2006) use more recent administrative data to perform a similar analysis in a con-temporary setting (the “selective school” system was retained in a small number of areas in Great Britain). Manning and Pischke (2006) use the same data as that used by Galindo-Rueda and Vignoles (2004) and Kerkhoff et al. (1996), but show that the abolition of the grammar school system was not random across areas. They find that strategies relying on local variation in the degree of selectivity of the school system produce the same results regardless of whether the dependent variable is after the “treatment” (age 16 test scores) or before the “treatment” (age 11 scores). They conclude that caution is required in drawing strong conclusions from studies that rely on the timing chosen by local areas to abolish the tracked system.
A different approach has been used by Clark (2010) to look at the impact of attending grammar schools in one region of England during the 1970s (Yorkshire). He uses a regression discontinuity design, comparing students scoring just below the admission cutoff with those scoring just above. His approach identifies the impact of going to grammar school for the marginal student. He finds only small effects on test scores but large effects on academic course-taking and on college enrollment.2
This is one piece of evidence to show the positive effects of going to grammar school for the marginal student, although the paper does not address the overall impact of a change in the system (which potentially affects all students).
Our paper is also related to the literature that investigates the effect of within school ability segregation (see, for example, Betts and Shkolnik 1999; Figlio and Page 2002; Duflo, Dupas, and Kremer 2011). Using a randomized evaluation applied to primary schools in Kenya, Duflo et al. (2011) find that schools with (maximum) segregation in two equal-sized ability groupings do better than schools with no segregation at all. Also they find that segregation was beneficial to students at all points in the ability distribution. Segregation within primary schools in a developing country is of course not equivalent to segregation across secondary schools in a developed country. For example, the potential negative effect of being assigned to a nonelite group is likely to depend a lot on the age of the students and on the importance placed on educational success in society. Also, it should be emphasized that education expansion reforms (such as that in Northern Ireland) typically involve an increase in the homogeneity of peers for low-ability pupils, but a decrease in homogeneity for high-ability pupils. It is unlikely to be possible to infer the effects of such policies from experiments where all pupils are affected by the same increase in the extent of homogeneity within the school (in terms of pupil ability).
Finally, our research is also related to the literature3on the impact of the
educa-tional expansion reforms that took place in Europe after World War II since
detrack-2. These findings are consistent with papers showing that early tracking leads to substantially different schooling experience across students who differ only with respect to their exact date of birth within the year (Mu¨lhenweg, Puhani, 2010). Also they are consistent with literature looking at the impact of attending elite schools for marginal students in other contexts (Cullen, Jacob and Lewit 2006; Altonji, Elder and Taber 2005).
ing was often part of these reforms. However the reforms had typically several very different components, including increases in school-leaving age. Hence, outcomes cannot be attributed to the specific effect of detracking. A distinguishing feature of our study is that the natural experiment under consideration has not modified the nature of the school system but only modified the relative size of the elite sector. To identify the effect of widening access to the academic track on average outcomes, we rely on comparisons between children who go to school in the same educational system, where marginal reforms are made to that system rather than involving con-version to a different type of system. To the best of our knowledge, this experiment is the first to isolate the overall contextual effect of allowing entry to the elite track for a group that was previously only at the margin of being admitted.
III. Institutions and reform
In a number of key respects, the education system is the same in Northern Ireland as that in England and Wales. Pupils spent six years in primary school, from age five to age 11, and then five additional years in secondary school, until age 16, the minimum school-leaving age. At the end of compulsory education (age 16), all students take GCSE examinations. It is usual for students to take eight to ten subjects, including English and Math. There is an externally set and marked exam for each subject (pass grades areA*,A,B, C....G,and then a fail). Anything from gradeA* to gradeCis regarded as “good” and the standard outcome measure for a student is whether he/she achieves five or more grades atA*–C.4The National
Qualifications Framework (NQF) used by U.K. employers consider gradesD–Gas a Level 1 qualification; grades A*–C as Level 2 (A-level being at Level 3). The proportion of students achieving five or more grades atA*–Cis also the key national indicator to measure performance at the end of compulsory schooling (and applies to England, Wales, and Northern Ireland). In the United Kingdom, many studies find that qualifications that mark the end of compulsory education have a very large impact on labor market outcomes. In terms of data and methodology, one of the most convincing studies is by Blundell et al. (2005) who found a wage return of 18 percent for those entering the labor market with these qualifications versus stopping at age 16 without qualifications (see also McIntosh 2006).
If the student decides to pursue academic education beyond GCSE, this involves studying for A-level exams, which normally requires an extra two years of study. These examinations are externally set and graded and are the usual entry route to university. Compared to leaving school without qualifications, Blundell et al. (2005) finds an average wage return of 24 percent for those completing A-levels only, which rises to 48 percent for those completing higher education.
The education system in England, Wales, and Northern Ireland is also similar in that they operate under a similar legislative framework and have a similar National
4. Students might not be allowed to continue in a subject to A-level if they had not managed to get aC
Curriculum.5However, in Northern Ireland, there is still a selective system of
sec-ondary education whereas England and Wales largely converted to the comprehen-sive model in the 1960s and 1970s.6 This change almost happened in Northern
Ireland as well but plans were halted following the election of the Conservative government in 1979.
A. Tracking of students by ability in Northern Ireland
Unlike the comprehensive system (where schools are not allowed to select on the basis of academic ability), the selective system in Northern Ireland involves a test at age 11 that determines the type of secondary school a child will attend: grammar schools (for the more academically able) or other secondary schools. Between 1981 and 1994 (that is, cohorts born in 1970 and 1983), the transfer test was based on two tests of the verbal reasoning type with some questions designed to test specific aspects of English and mathematics (Sutherland 1993).7On the basis of performance
in these tests, pupils were awarded one of three grades (grade A awarded to the top 20 percent; grade B awarded to the next 10 percent). Pupils were admitted to gram-mar schools (or not) on the basis of performance on these tests.8Within this
frame-work, the key difference between grammar and other secondary schools is in their pupil composition in terms of ability—along with the consequences this has for the teaching environment and the ethos of the school. Gallagher and Smith (2000) sug-gest that the “grammar school effect” is explained by a combination of the clear academic mission of schools, high expectations for academic success on the part of teachers and the learning environment created by a pupil peer group which is se-lected on academic grounds. All of these factors combine to make the education experience very different in grammar schools than in other secondary schools, even though they operate under the same National Curriculum and implement the same public examinations. In contrast, there is no suggestion in the literature that this effect could be explained by differences in funding between sectors. Funding to schools in both sectors is largely driven by pupil numbers.9
5. Important Acts are the 1944 Education Act for England and Wales and the 1947 Act for Northern Ireland, the 1988 Education Reform Act in England and Wales, and the Education Reform (Northern Ireland) Order 1989.
6. Other important differences are religious segregation in the education system of Northern Ireland: Most Catholics attend schools under Catholic management (“maintained”) whereas most Protestants attend other state schools. Also, there are many more single sex schools in Northern Ireland—25 percent compared to 16 percent in England. Of single sex schools, about 45 percent are grammar schools (that is to say those that select the more academically able).
7. In 1993/94, the transfer tests were changed from a verbal reasoning to a curriculum orientated format. This affects cohorts born from 1983 onward.
Unfortunately we do not have information on how exactly schools responded to changes in funding after the reform. However, note that the new maximum admis-sions number was based on “capacity constraints” at each individual school, thus deliberately avoiding any dramatic change (change involving new buildings for instance). All schools are expected to apply the same National Curriculum, which prescribes, in detail, the range of subjects which must be taught at all levels of compulsory education; the relative time allocation to different areas of the curricu-lum; and the actual course content for the various subjects (see Morgan 1993). While grammar schools and other secondary schools operate under this same framework, in practice, there is some evidence of heterogeneity in the curricula actually imple-mented by schools, with pupils in a sample of grammar schools spending more time at academic subjects (particularly languages) than their counterparts in a sample of other secondary schools (Harland et al. 2002).
The same public examinations are taken in both school types (GCSE at age 16, A-levels at age 18). In all grammar schools and in many other secondary schools, it is possible to stay on for two extra years.10Although school type is highly cor-related with the probability of obtaining A-levels (reflecting the selection process as well as any genuine “school” effect), there is no automatic relationship between entering grammar school and achieving A-levels or entering other secondary school and failing to achieve them. Before the reform about 78 percent of pupils attending grammar school achieved at least one A-level whereas this was true of 6.6 percent of those attending nongrammar schools. With regard to GCSEs, the percentage of students achieving five or more GCSEs at A*–Cwas 91 percent and 22 percent in grammar schools and nongrammar schools respectively.
B. The 1989 Reform
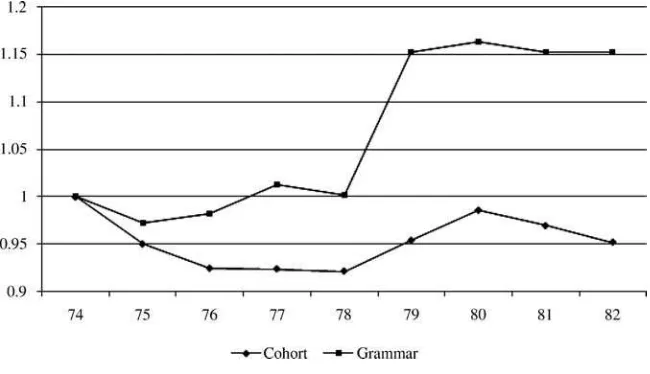
As explained above, it was a political accident that Northern Ireland did not abolish “selective schooling” at the same time as the rest of the United Kingdom in the 1960s and 1970s. As a consequence, the system of very early tracking (at age 11) has been maintained in Northern Ireland up to the present day, whereas in other respects the education system has remained similar to that in other parts of the United Kingdom. However, an important reform to grammar school admission was imple-mented in Northern Ireland in the late 1980s. This involved a rise in quotas applied to grammar school intakes. Following the Education Reform (Northern Ireland) Or-der 1989 (implemented from 1990 and affecting cohorts born from 1979), grammar schools were required to accept pupils, on parental request, up to a new (larger) admission number determined by the Department of Education and based only on the physical capacity of the school. This “open enrollment” reform was in the spirit of making the education system more amenable to parental choice. Between 1985 and 1989 (before the reform), about 8,100 pupils (31 percent of the cohort) entered grammar schools each year, whereas this increased to about 9,400 pupils (35 percent of a cohort) just after the reform, between 1989 and 1992 (that is, between cohorts born from 1979 to 1982, see Figures 1 and 2).
Figure 1
Number of Entrants to Grammar School in Northern-Ireland, by Year of Birth.
Figure 2
Evolution of Cohort Size and Number of Entrants to Grammar School, by Year of Birth (1974=1).
between the 1978 and 1979 cohorts, whereas this probability was fairly stable im-mediately before the policy (1976–78) and imim-mediately afterward (1979–81).
The Northern Ireland Council for Educational Research (NICER) carried out a series of studies before and after the reform which provides information on academic level of the “marginal” students, namely students observed in grammar schools after the reform but who would not have been admitted before (see Wilson 1986; Gal-lagher and Smith 2000). Specifically, according to the NICER, the probability of grammar school enrollment for pupils ranked among the top 30 percent at the trans-fer test (grade A or B) is almost as high during the prepolicy period as during the postpolicy period (88 percent in 1981–85, 92 percent in 1993–97). By contrast, the probability of grammar school enrollment for pupils ranked among the bottom 70 percent at the transfer test (grade C or below) was almost negligible prepolicy (4 percent in 1981–85), but become much more significant postpolicy (19 percent in 1993–97). Overall, pupils ranked among the bottom 70 percent at the transfer test represented about 9.6 percent of the grammar school population prepolicy, but almost 32.5 percent postpolicy. The main effect of the reform is a significant increase in the proportion of medium-ability students within grammar schools.
The raising of quotas on grammar school intakes was controversial because of the fear that grammar schools would “cream-skim” the highest-ability students from other secondary schools and that all would suffer as a result. A concern voiced by the Northern Ireland Economic Council (1995) was that the reform could undermine the selective system: “The educational impact of allowing the grammar school sector to expand needs to be questioned. The fundamental point of such a system is that educating the more academically able is seen as being of benefit to both the more and least able. By definition, it would seem that allowing students who previously would have entered a secondary environment to attend a grammar school must in-evitably dilute the perceived value of selective education . . .” Our evidence allows us to consider what reducing selectivity did to educational credentials in the overall population.
IV. Data and variables
We use two administrative data sets that were obtained from the Department of Education in Northern Ireland. The first one provides annual school-level information on the number of pupils entering each grade. The second data set provides school-level data on all school leavers by grade and year.11Also, this data
set contains information on national examination outcomes and key indicators of qualifications attained. Both data sets contain information on the name, religious affiliation (Catholic or Protestant), location and type of school (grammar or non-grammar). Note that these data sets cover the entire population of secondary schools, except independent schools. In Northern Ireland only a small percentage of pupils
attend independent schools (less than one per cent) and this has not changed over the time period of interest to us.
We use these administrative datasets to build a panel of 23 local areas with in-formation on the proportion of pupils attending grammar schools and average ex-amination outcomes for each local area and each cohort born between 1974 and 1982.12 We created these local areas on a geographic and religious basis: first we
divide the set of all schools in Northern Ireland by religious denomination13 (in general, Catholics attend either Catholic grammar or nongrammar schools; Protes-tants attend Protestant grammar or nongrammar schools). Second, we match each nongrammar school to the grammar schools of its local administrative district (LAD). Education at a local level in Northern Ireland is administered by five “Education and Library Boards” (ELB) covering different geographical zones (Belfast, North Eastern, South Eastern, Southern, Western) and these ELB are divided in 26 LAD. Whenever a LAD does not contain any grammar school of a given religious denom-ination we match the corresponding nongrammar schools of this LAD to an adjacent LAD.14Finally, we merge some additional adjacent LADs in order to eliminate small areas with erratic size. Overall, we obtain a total of 23 areas (ten Catholic and 13 Protestant) such that the proportion of pupils found in each area is very stable across cohorts. There is, for example, no significant difference in the average number of pupils in each area before and after the reform, which is consistent with the as-sumption that the reform has mostly affected the allocation of students across schools within areas and not across areas.15
With respect to religion and size, our procedure yields one large Protestant area (with 11 grammar schools) and one large Catholic area (with seven grammar schools) in the Belfast region, plus 12 smaller Protestant and nine smaller Catholic areas outside Belfast (with, on average, 2.6 grammar schools in each of these smaller areas). Each large Belfast area represents about 12 percent of the population of pupils whereas each smaller area represent on average 3.6 percent of the population (see Appendix Table A1a).
Within this framework, our basic research question is whether the reform to gram-mar school admission had any influence on the number of students achieving five or more GCSEs at grades A*–C at age 16 or achieving A-levels at age 18. As discussed above, GCSE is the compulsory examination taken by all students at age 16 and A-levels are the examinations taken by a subset of students interested in pursuing academic education beyond the compulsory phase. We have information on key indicators of achievement in both of these examinations (used in this paper),
12. Since grade repetition is not a feature of the school system in the United Kingdom, it is possible to derive birth cohort using available information on grade and date (that is, cohort = date−grade). The
birth-day cutoff for school entry being July 1, each cohort corresponds to children born between the July 1 and June 30 of two consecutive years (for example, cohort 1974 refers to children born between July 1, 1973 and June 30, 1974).
13. There are 113 Catholic schools (31 grammar and 82 nongrammar) and 143 Protestant schools (40 grammar and 103 nongrammar) in Northern Ireland.
14. We observe 4 LAD without any Protestant grammar school, 11 LAD without any Catholic grammar school.
Figure 3
Educational Outcomes in England, by Year of Birth.
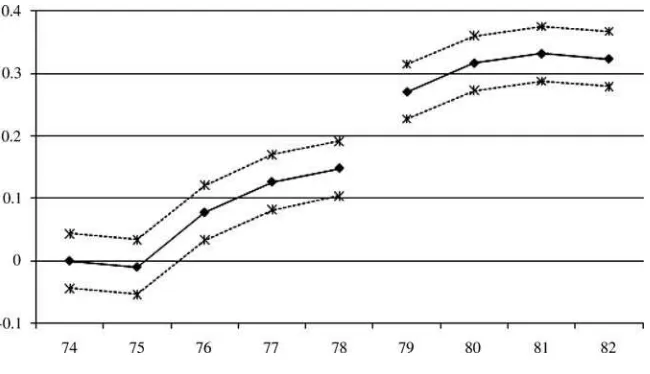
although not the full range of scores. Data are available for cohorts born between 1974 and 1982, for which there were no major reforms to A-levels, or to the age 16 examinations or to the transfer tests determining entry to grammar school (see descriptive statistics in Appendix Table A1b). As it happens, reforms to the A-level system have taken place in 1987/88 (affecting cohorts from 1972 onward) and in 2000 (affecting cohorts from 1984 onward) whereas reforms to the examination taken at age 16 by all pupils (GCSE—formerly O-levels) took place in 1988 (af-fecting cohorts from 1972 onward), but no reforms took place for cohorts born between 1972 and 1988.16 To illustrate this, Figure 3 shows the change in our
measures of educational success in England17for the cohorts born before and after
the reform under consideration (that is, before and after 1978). We do not find any significant shift at the time of the reform. We observe the same smooth increase in the proportion of successful students across cohorts born before and after the reform (about a one percentage point increase per year). Given that the examination system at age 16 and 18 is exactly the same in England and Northern Ireland, this figure provides further support to the assumption that examination procedures and the over-all ability to pass examinations did not undergo any discontinuous change in
North-16. As discussed above, reform to the transfer test affected cohort born from 1983 onward. The Universities and Colleges Admission Service (UCAS) provide a detailed account of these reforms and what the ex-aminations consist of.
ern Ireland at the time of the reform. In the next section, we build on this assumption to provide several estimates of the effect of early detracking on subsequent average educational outcomes.
V. Educational Effects of the Reform
In this section, we estimate the educational effects of the reform using different identifying assumptions. We use a simple model where the number of students who pass their exams at the end of secondary education in areai and cohortcdepends on (a) the total number of students who enter secondary education in areai and cohortcand (b) the distribution of students across elite and nonelite schools in area i and cohort c. Specifically, we assume the following model of education production:
Y =α+βG +γS +θ(c) +u +ε
(1) i,c i,c i,c 0 i i,c
whereYi,crepresents the number of students who pass their exams at age 16 (or 18)
in area i and cohort c, Si,c the total number of pupils who enter into secondary
education in areaiand cohortcandGi,cthe proportion of pupils selected into elite
schools at age 11 in areaiand cohortc. VariablesYi,c,Gi,c, andSi,care specified in
log format so that parameterβcan be directly interpreted as the educational effect of a 1 percent increase in admission numbers in elite schools, holding cohort size constant. Variable θ0(c) captures any continuous cohort trends that may affect the proportion of successful students either before or after the reform: we use a spline function with a knot at the reform date.18The variable u
i represents fixed effects
that capture permanent differences in outcomes across areas. Finally,εi,crepresents
cohort-specific shocks to pupils” ability to pass examinations at age 16 (or 18) in area i. Within this framework, the parameter of interest is β, which captures the effect of school segregation by ability on educational outcomes. The basic identifi-cation issue comes from the fact that cohort-specific shocks to student ability εi,c
may be correlated with the cohort-specific shocks to the proportion of students se-lected into elite schools.19In such a case, the OLS regression ofY
i,conGi,cprovides
a biased estimate ofβ, even after detrending and purging out fixed effects. To address this issue, we first make use of the discontinuous shift affecting the average level of elite school attendance as a consequence of the reform.
A. Change in Average Elite School Attendance After the Reform
Assuming that there is no discontinuity in average ability to pass exams at the time of the reform in Northern Ireland, parameterβis identified as the ratio of the shift in the proportion of successful students and the shift in the proportion of pupils in
18. θ0(c) is writtenθ01c+θ02(c−c0)1(c>c0) where parameterθ01captures prereform cohort trend whereas
parameterθ02represents the change in cohort trend after the last unaffected cohortc0.
Figure 4
Variation across Cohorts in the (log) Number of Students Attending Elite Schools in Northern Ireland.
Note: Using the area-level data, the graph shows the change across cohorts in the (log) number of students attending grammar schools (cohort 1974 taken as a reference). The average number of students attending elite schools is 15 percent higher in cohort 1979 than in cohort 1978. Dotted lines show confidence intervals.
elite schools observed just after the reform. It can be estimated in Model 1 using a “reform on” dummy 1(c > c0) as an instrumental variable (wherec0is the last
un-affected cohort).
Before moving on to the estimation results, it is of interest to consider Figures 4 to 6, which use the area-level data to show variation across cohorts in the average proportion of grammar school students and average number of successful students at age 16 (or age 18). Interestingly, they reveal a significant discontinuity in both variables at the reform date,20which is consistent with the hypothesis that variation
in the proportion of students selected into elite schools at age 11 affected the number of successful students at age 16. For example, the reform generated an increase of about 14 percent in our measure of success at age 18, whereas it was only weakly increasing in the prereform period and it is stable in the period immediately post policy.
Table 1 provides the result of the corresponding regression analysis. Column 1 shows the results of the first-stage regression,
G =δ+π1(c>c) +γ S +θ (c) +v +υ
(2) i,c 0 1 i,c 1 i i,c
Figure 5
Variation across Cohorts in the (log) Number of Successful Students at Age 16. Note: Using area-level data, the graph shows the change across cohorts in the average of the (log) number of students obtaining five or more GCSEs at gradesA*–C(cohort 1974 taken as a reference). Dotted lines show confidence intervals.
Figure 6
Guyon,
Maurin,
and
McNally
699
Discontinuity in Grammar School Attendance at the Reform Date
First-stage Reduced form IV OLS
Proportion Reform on (c> 1978) 0.124
(0.010)
Year of birth (c) 0.011 (0.002)
Note: Column 1 shows the regression of the (log) proportion of students attending grammar school (Gic) on a “reform on” dummy, using (log) cohort size (Sic), a spline
where 1(c>c0) is a dummy indicating that the reform is on whereasθ1(c) is a spline
function with a knot at c0, that is θ1(c) =θ11c+θ12(c−c0)1(c>c0). It confirms a
significant discontinuous increase inGi,cat the date of the reform. The estimate of
πis positive and significant at standard levels. Columns 2 and 3 show the results of reduced form regressions. These confirm that there was a shift in the number of successful students (either at GCSE or A-level) at the date of the reform which is parallel to that observed for the proportion of students selected into elite schools for the relevant cohort. Columns 4 and 5 show results for the corresponding second-stage regressions, which suggest that a 10 percent increase in the proportion of students selected into elite schools generates a 4.1 percent increase in the number of successful students at age 16 and a 7.5 percent increase at age 18. These estimates are actually quite close to the basic OLS estimates21(see Columns 6 and 7). With
respect to the effect of cohort size, it remains close to one and statistically not different from one, which suggests that there are no significant economies (nor dis-economies) of scale in the educational production function. Changes in average school size in an area have, as such, no effects no average outcomes.
In Appendix 2, we report the results of several additional robustness analyses. To start with, Appendix Table A2a shows the results of using alternative specifications for both the dependent and independent variables and we obtain very similar results. For example, the results remain qualitatively unchanged when we do not use (log) cohort size as a control variable and regress the (log) proportion of successful stu-dents on the (log) proportion of stustu-dents enrolled in grammar schools (see Specifi-cation 2). We prefer the specifiSpecifi-cation where no constraint is imposed on the effect of cohort size since it is not obviousex ante whether and how cohort size affects the quality of education and probability of success in an area.22 We have also
checked that the different specifications provide qualitatively similar results when we regress the proportion of successful students on the proportion of students se-lected to an elite school (rather than the log proportion, see Specifications 3 and 4 in Table A2a). Nonetheless, the specification in logs seems better adapted to the right-skewed distribution of cohort size and provides a slightly more precise IV estimate.
Regardless of specification, the regression analysis in Table 1 relies on the as-sumption that unobserved determinants of educational outcomes in Northern-Ireland did not change discontinuously after the reform. Appendix Table A2b provides the
21. One possible reason for the similarity of OLS and IV estimates is that they use the same basic source of identification. As it happens, putting aside the year of the reform, the probability of selection into grammar schools is the ratio between a quasi constant number of places and a more fluctuating cohort size (see Figure 2). Thus, the unobserved shocks to the selection probability in fact coincide with shocks to cohort size. Given that these shocks are absorbed in our regressions by the control variableSi, the only remaining source of identification in an OLS regression ofYi,conGi,cis the shift inGi,cat the time of the reform—that is to say, exactly the same source of identification as the IV.
results of an alternative strategy, where we do no longer exclude discontinuous shifts, but where we assume that such shifts (if any) have affected Northern Ireland and England in the same way. Specifically, we consider England as an additional area (whereGi,cis set to zero) and the effect of grammar school enrollment is identified
using the interaction between a Northern Ireland dummy and a “reform on” dummy as an instrumental variable, holding constant a full set of cohort fixed effects and area fixed effects. This amounts to using England as a control group in a standard difference-in-differences setting.23This approach yields estimated impacts that are
very similar to those in Table 1 for age 18 outcomes and larger estimates for age 16 outcomes (although the difference between the two estimates is not significant at standard levels).
Overall, this initial analysis suggests that when the share of the elite track is exogenously expanded in an area, the average outcomes improved. Further investi-gations (not reported) suggest that effects are perceptible for the group of areas with a relatively high prereform share of students in the elite track as well as for the group with a relatively low prereform share. More generally, our data do not make possible to identify an “optimal” share above which further increase in the elite track become ineffective. It does not mean that such an “optimal” size does not exist, but it cannot be identified with the natural experiment used in this paper.
Finally, it should be emphasized that Table 1 provides cluster robust estimates of standard errors, using the generalized White procedure (White 1984), where clusters correspond to cohorts. As pointed out by Moulton (1990), statistical inference on aggregated regressors (such as our “reform on” dummy) requires clustering at that level.24
B. Change in the Distribution of Elite School Attendance Across Areas
The analysis in Table 1 provides an estimate of the effect of the reform under the assumption that other national-level determinants of educational outcomes did not undergo a discontinuous shift in Northern Ireland at the time of the reform. In this subsection, we provide an evaluation relying on a completely different assumption, using a feature of the reform that we have not yet exploited. Specifically, we make use of the fact that the reform did not have the same impact on the proportion of pupils in elite schools in different areas of Northern Ireland. As discussed above, the effect of the reform in a given area was determined only by local capacity
23. Alternatively, we could reestimate Model 1 using the difference in average outcomes between areas in Northern Ireland and England as the dependant variable (that is to say, usingYi,c−Y0,crather thanYi,c
as the dependant variable, whereY0,crepresents English outcomes) and using a full set of cohort fixed effects (rather than a spline function) in the set of control variables. We have checked that this estimation strategy provides similar estimates.
constraints. Hence, the effect of the reform on grammar school entry was determined in each local area by parameters that had plausibly nothing to do with the variation in pupils” ability to pass exams across cohorts. In such a case, the educational effect of increasing the proportion of pupils entering elite schools in an area can be iden-tified by evaluating whether the most affected areas are also those which experienced the largest improvement in educational outcomes after the reform. Specifically, under the maintained assumption that the area-specific changes inυi,cbetween postreform
and prereform cohorts are uncorrelated with the area-specific changes inεi,cacross
the same periods, we can evaluate parameterβby estimating Model 1 after taking long-differences between postreform and prereform period,
Y −Y =δ+β(G −G ) +γ(S −S ) + (ε −ε )
(3) i,after i,before i,after i,before i,after i,before i,after i,before
where, for each variablexic,xi,afterrepresents the mean ofxicin areaiacross
postre-form cohorts andxi,beforerepresents the mean ofxicin areaiacross prereform cohorts.
Note that this second strategy provides an unbiased estimate ofβeven in the case where there is a nation-level discontinuity in pupils” average ability at the time of the reform, namely even when our first identification strategy25 provides a biased
estimate ofβ. Also this second strategy does not necessarily coincide with the fixed effect OLS estimate of Model 1 since it relies on the sole change observed at the time of the reform whereas the fixed-effect OLS evaluation uses all observed fluc-tuations for identification. Table 2 shows the result of estimating Model 3. Panel A uses the full set of available cohorts (1974–82) and provides estimates using the difference in mean educational outcomes between the four postreform cohorts and the five prereform ones as the dependant variable. By contrast, Panel B focuses on the sole two prereform and two postreform cohorts (that is, 1977–80) and provides estimates using the difference in mean educational outcomes between the two pos-treform and the two prereform cohorts as the dependant variable. Comfortingly, the regression results are very similar across the two specifications.26
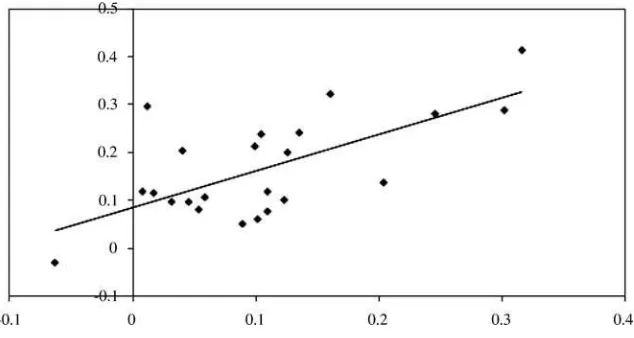
Overall, this “long difference” analysis suggests that a 10 percent increase in the proportion of grammar school entrants generates an increase of about 4 percent in the number of students obtaining five or more GCSEs at grades A*–C and an in-crease of about 7 percent in the number of students with three A-levels or more at age 18. Most interestingly, this estimated elasticity is very close to the estimates obtained in the previous subsection even though the source of identification is com-pletely different. The first strategy used the nation-level discontinuity in the rela-tionship between entry to elite schools and cohort of birth whereas the second strat-egy uses the differential impact across areas as a source of identification. Figures 7 and 8 show graphically that there is a very clear correlation between area-level variation in the proportion of successful students at age 16 (five or more GCSEs at
25. As it happens, the two strategies rely on two different sources of identification: the change in the average level of elite school attendance over time (first strategy) vs. the change in the distribution of elite school attendance across areas (second strategy).
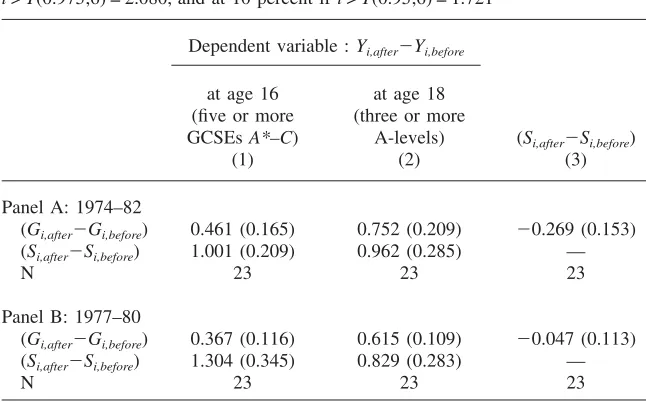
Table 2
The Effect of the Variation in Elite School Attendance at Age 11 on the Variation in Average Educational Outcomes Across Prereform and Postreform Cohorts Remark: 23−2 = 21 degrees of freedom, so significant at 5 percent if t>T(0.975;6) = 2.080, and at 10 percent ift>T(0.95;6) = 1.721
Dependent variable :Yi,after−Yi,before
at age 16 (five or more GCSEsA*–C)
(1)
at age 18 (three or more
A-levels) (2)
(Si,after−Si,before)
(3)
Panel A: 1974–82
(Gi,after−Gi,before) 0.461 (0.165) 0.752 (0.209) −0.269 (0.153)
(Si,after−Si,before) 1.001 (0.209) 0.962 (0.285) —
N 23 23 23
Panel B: 1977–80
(Gi,after−Gi,before) 0.367 (0.116) 0.615 (0.109) −0.047 (0.113)
(Si,after−Si,before) 1.304 (0.345) 0.829 (0.283) —
N 23 23 23
Notes: Columns 1 and 2 show the regression of the difference in average (log) number of successful students at age 16 and 18 between prereform and postreform period (denotedYi,after−Yi,before) on the
dif-ference in average (log) proportion of students attending grammar schools (Gi,after−Gi,before) and the
dif-ference in average (log) cohort size (Si,after−Si,before). Column 3 shows the regression of the difference in
average (log) cohort size between prereform and postreform cohort on the difference in average (log) proportion attending grammar schools. In Panel A, prereform cohorts = 1974–78 and postreform co-horts = 1979–82. In Panel B, prereform coco-horts = 1977–78 and postreform coco-horts = 1979–80. In Panel C, prereform cohorts = 1974–76 and postreform cohorts = 1979–80. Standard errors are in parentheses.
gradesA*–C) or at age 18 (three A-levels or more) and area-level variation in the proportion of students selected into grammar schools.
postre-Figure 7
Variation in the Proportion of Successful Students at Age 16 and Variation in Elite School Attendance Between Prereform and Postreform Cohorts.
Note: for each local area, the X-axis corresponds to variation in the log proportion attending elite schools between cohorts 1974–78 and cohorts 1979–82, whereas the Y-axis corresponds to variation in the log proportion of successful students at age 16.
Figure 8
Variation in the Proportion of Successful Students at Age 18 and Variation in Elite School Attendance Between Prereform and Postreform Cohorts.
form cohorts, this also confirms that the reform has not been associated with any significant reallocation of students from weakly affected to strongly affected areas. Appendix Table A2c provides additional evidence showing that the reform did not coincide with any significant reallocation of pupils from low socioeconomic back-grounds across strongly and weakly affected areas. In our data, eligibility to receive free schools meals is the available measure of socioeconomic background. This is an entitlement for families who are on various types of income support. It represents a good proxy for the proportion of families in the lowest quartile of the income distribution.27 When we replicate regression Models 2 or 3 using this proxy as
dependent variable, we do not find any evidence that the reform has been associated with a significant change in the distribution of pupils eligible to receive free school meals across cohorts or across areas (Table A2c, Columns 1 and 2).
C. Differences-in-Differences Analysis
The previous “long difference” approach is potentially problematic since actual at-tendance rates may have increased to a greater extent in places where the academic potential of students increased by more just after the reform. To further explore the robustness of our results, it would be interesting to have administrative data on schools’ capacity before the reform and to use this information to construct a mea-sure of the “likely intensity” of the reform across areas. It would then be possible to test whether stronger “likely intensity” of the reform in an area is associated with stronger improvement in educational outcomes after the reform. Unfortunately, we do not have such direct information on schools” capacity. It is nonetheless possible to construct a proxy (denotedTi,) by considering the fluctuations in grammar school
enrollment across cohorts before the reform. In areas where grammar schools are near full capacity, grammar school enrollment should not fluctuate a lot and the impact of the reform on grammar school enrollment should not be very large.
To conduct this difference-in-differences analysis, we have taken our measure of “likely intensity” of the treatmentTito be the coefficient of variation of the
distri-bution of the number of pupils enrolled in grammar schools across prereform cohorts in areaiand we have assumed an extended version of Model 1,
Y =α+βG +γS +τ +u +ε
(4) ic ic ic c i ic
whereτc represents cohort fixed effects,uirepresents area fixed effects and where
the difference in average abilityεicacross high-Tiand low-Tiareas is assumed to be
the same before and after the reform. Under this maintained assumption, parameter
βis identified even when there is a change in average ability at the reform datec0,
namely even when OLS estimation of Model 3 is biased. Specifically, we can use the interaction between our measure of treatment intensityTiand a reform dummy
as an instrumental variable. β is identified as the ratio between the shift in the difference in student achievement at the reform date across low and high treatment
intensity, areas and the corresponding shift in the difference in grammar school attendance at the same cutoff date.
To start with, Column 1 of Table 3 shows the corresponding first-stage regression,
G =δ+π1(c>c )×T +γS +τ +u +ε
(5) ic 0 i ic c i ic
Comfortingly, the estimate of π is significantly positive which confirms that the reform was followed by a larger increase in grammar school enrollment in areas where fluctuations in grammar school size before the reform were the largest. This result is consistent with our working assumption that prereform fluctuations in gram-mar school enrollment provide a good proxy for the “likely intensity” of treatment. Columns 2 and 3 show the reduced form regressions which reveal that the larger increase in grammar school enrollment observed in high-intensity, areas is
accom-panied by a stronger increase in the number of successful students in these areas. This finding is obviously consistent with the result obtained in the previous sections that educational outcomes in an area are causally affected by the proportion of students admitted to grammar schools in this area. Columns 4 and 5 show the cor-responding IV estimates. The estimated effects on the number of successful students at age 16 or at age 18 are significant at standard levels and very similar to estimates obtained in the previous sections. Finally, the last column of the table shows that there is no significant change in the relative size of high intensity areas after the reform. The reform has not generated any significant reallocation of students and families across low intensity and high intensity areas. Using the proportion of stu-dents eligible to receive free school meals as the dependent variable (the last column of Appendix Table A2c) further confirms that the reform is not associated with any statistically significant change in the relative social background of pupils in high intensity areas. These results are consistent with the identifying assumption that changes in students” characteristics after the reform are unrelated to the likely in-tensity of the reform (as captured byTi).
One possible issue with difference-in-differences (DD) methods is that neglecting serial correlation in outcomes may generate significant biases in estimated standard errors. To address this issue, our regression tables provide estimates of standard errors that are consistent in the presence of any correlation pattern within areas over time using again the generalized White method where clusters correspond to areas. Analyzing similar DD specifications Bertrand, Duflo, and Mullainathan (2004) finds that this strategy performs very well in finite samples when the number of clusters is larger than 20 (we have 23 areas). An even more conservative approach consists in aggregating time series information into prereform and postreform observations and using these area-level aggregated outcomes as dependent variables.28
Comfort-ingly, this strategy provides us with estimates that are very similar to those in Table 3 and not less precise (regressions available on request).
28. See again Donald and Lang (2007) or Cameron and Miller (2010). This strategy is equivalent to regressing the differences between postreform and prereform aggregated outcomes on the difference be-tween postreform and prereform aggregated elite schools” share using the likely intensity of the treatment
Guyon,
Maurin,
and
McNally
707
Prereform Variation in the Number of Students attending Elite Schools
First-stage Reduced-form IV
Note: Column 1 shows the regression of the (log) proportion of students attending grammar school (Gi,c) on a variable interacting a “reform on” dummy and intensity
of treatmentTiusing (log) cohort size (Si,c), nine cohort fixed effects, and 23 area fixed effects as control variables. Columns 2 and 3 shows the regression of the (log)
D. Effect on Entry into Higher Education
The School Leavers Survey (SLS) consists of a questionnaire sent to all secondary schools where they are asked to provide information on the secondary qualifications obtained by school leavers (GCSEs, A-levels) and also on the postsecondary desti-nation of these students (higher education, employment, unemployment, training, unknown). By construction, the information on destinations is more speculative and less precise than the information on qualifications obtained before leaving school.29
As mentioned in the guidance notes of the SLS, schools often have difficulties in coding the destinations of students who change residence or students who start to work during the summer after leaving school, but who may nonetheless enter into university at the beginning of the next academic year. With all these data limitations in mind, for each area and each cohort, we have constructed a measure of the number of students who have attended higher education after secondary school30 and we
have analyzed this destination outcome using exactly the same methods as those used previously to analyze secondary qualifications. As shown in Table 4, all three strategies suggest a positive effect of the reform on university attendance, even though the effect is less well estimated than the effect on qualifications. For example, Model 3 shows that the increase in university attendance is stronger in areas where the increase in grammar school attendance is greater, suggesting that a 10 percent difference across areas in the increase in grammar school attendance between periods 1977–78 and 1979–80 generates a 5 percent difference across areas in the increase in university attendance between the same period (0.53 elasticity significant at the 1 percent level). Although one might be concerned in principle that a big increase in the demand for university places might have led to constraints on the ability of the higher education system to absorb the new applicants, this does not apply in Northern Ireland. Students can apply to go to university in any part of the United Kingdom (as well as Northern Ireland) and thus there are many options. In a country the size of the United Kingdom, an increase in the supply of applicants of this magnitude is very unlikely to have caused difficulties.
VI. Interpretation and Discussion
The interpretation of the overall improvement in exam performance in Northern Ireland is that it is the combination of three basic effects: the effect of attending grammar school on pupils who would otherwise have attended another secondary school; the effect of losing more able peers on students still entering nongrammar schools after the reform; the effect of having less able peers on students who would have entered a grammar school even in the absence of the reform. It is not possible to point-identify the specific contribution of each of these effects.
None-29. The guidance notes ask schools to use the “unknown” code in not more than 5 percent of the cases. Thus it is not possible to have an idea of the true “unknown” rate (that is to say, the one that would emerge without coding constraints).
Guyon,
Maurin,
and
McNally
709
Simple difference Difference-in-differences
Reduced Form IV OLS Reduced Form IV OLS
(1) (2) (3) (4) (5) (6)
Proportion in Elite (Gic) — 0.368 (0.090)
0.627 (0.106)
— 0.670
(0.511)
0.690 (0.098) Reform on × T
i — — — 0.953
(0.879)
— —
Reform on 0.046
(0.010)
— — — — —
N 207 207 207 207 207 207
Long difference
Panel A (cohorts 1974–82)
(7)
Panel B (cohorts 1977–80)
(8)
Panel C
(cohorts 1974/1976–79/1982) (9)
(Gi,after−Gi,before) 0.776 (0.170)
0.534 (0.121)
0.842 (0.296) (Si,after−Si,before) 1.401
(0.315)
1.242 (0.275)
1.525 (0.359)
N 23 23 23
theless, it is possible to provide plausible lower bounds by examining the impact of the reform separately for elite and nonelite schools.
A. Bounds to Contextual Effects
To be specific, the reform defines three different ability groups (g=A,B, andC). Firstly, there is a group of relatively high-ability pupils (g=A) who would have entered grammar school even in the absence of the reform. The impact of the reform compared with no reform on this group is having a group of peers with relatively low-average ability. Secondly, a group of mid-ability pupils (g=B) attend grammar school after the reform, but would have attended another secondary school had the reform not taken place. The effect of the reform on these pupils is potentially very important since such pupils are exposed to a radically different school context than what they would have faced in the absence of the reform. Finally, there is a group of relatively low-ability pupils (g=C) who attend other secondary schools both before and after the reform. They are affected by the change in the composition of these schools. Specifically, they have lost their best peers (GroupB) because of the reform.
Using these notations, elite schools include Group Aonly before the reform, but are composed of GroupsA+Bafter the reform. In such a case, the variation in elite schools” average outcomes after the reform reflects (1) the fact that the average ability of pupils has declined in these school (because of the inclusion of GroupB) (2) the fact that the performance of GroupAmay itself have been affected by this new group of peers. In other words, the change in elite schools’ average outcomes is a mix between a potentially negative composition effect and more ambiguous peer effects on high-ability pupils.
Hence, the impact of the reform on the average outcomes in elite schools does not point-identify peers’ effect on Group A, but provides a lower bound for this contextual effect. A more formal presentation of this argument is given in Appendix 3.
Similarly, the variation in average outcomes in nonelite schools after the reform is a mix between (1) the effect of the change in peers’ composition on the Group C of low-ability pupils and (2) the potentially negative composition effect due to the loss of Group B—that is, a group of pupils with higher ability than GroupC. Hence, the effect of the reform on the average outcomes in nonelite schools does not point-identify peers’ effect on GroupC, but provides a plausible lower bound for this effect. In the next subsection, we provide a separate empirical evaluation of the effects of the reform on grammar and nongrammar schools, which we interpret as lower bounds for the contextual effects that have affected top- and bottom-ability students after the reform.
B. Separate Effects for Grammar and Nongrammar Schools
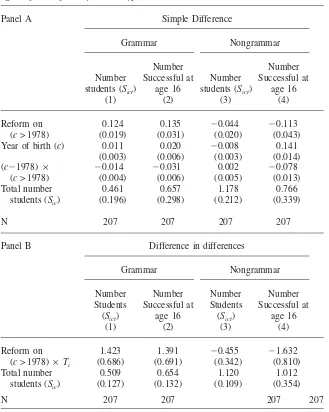
The Panel A of Table 5 shows regressions of the number of successful students in each school type (and of the total number of students in each school type) on a “reform on” dummy using the same set of control variables as those used in Table 1: cohort size (Si,c) and a spline function of cohort with a knot at the reform date.
Table 5
Effect of the Reform by School Types
Panel A Simple Difference
Panel B Difference in differences
Grammar Nongrammar
just after cohort 1978. This timing corresponds to the inflow of relatively low-ability students generated by the reform in these schools. Interestingly, Column 2 reveals that the reform was followed by an even larger shift ( + 13.5 percent) in the number of successful students at age 16 in these schools. Overall, success has increased at about the same rate as entry to grammar schools, which is consistent with the as-sumption that new students in elite schools have not generated negative externalities (in spite of their relatively low-ability) and have in fact strongly benefited from their new high-ability peers.31
Another possible explanation for the relatively good performance of grammar schools after the reform is that they have benefited from economies of scale, namely their increase in size after the reform has had, as such, a positive effect on their students” average outcomes. To separate the effect of change in size and the effect of change in composition, we have regressed the number of successful students in grammar schools on both the proportion of the total population of students selected to a grammar school (composition effect) and the absolute number of students se-lected in grammar school (size effect) using the “reform on” dummy and the cohort size (Si,c) as instrumental variables. This analysis (available on request) confirms that
change in composition has, as such, no significant effect on outcomes, whereas the elasticity of the number of successful students for the number of enrolled students is close to one (and not significantly different from one). It confirms that there are no significant economies of scale in these schools and that they have benefited from unambiguously nonnegative contextual effects after the reform.
The picture is somewhat different in nonelite schools. Column 3 confirms that they underwent a significant negative shift in size just after the reform (−4.4
per-cent). But Column 4 reveals that it was accompanied by an even more negative shift in the number of successful students at age 16 in these schools (−11.3 percent),
although the difference between the two estimates is not statistically different. Over-all, success seems to have declined more rapidly than attendance in nonelite schools. Hence, we are a situation where the sign of the contextual effect of the reform on low-ability students is ambiguous. The decline in average outcomes observed in nongrammar schools may simply reflect the decline in the average level of ability of students after the reform in these schools. However, it may also partly reflect the fact that students in these schools have lost their best peers after the reform.
As a robustness check, Panel B of Table 5 replicates the difference-in-differences analysis separately for each school type, using the same set of explanatory variables as those used in Table 3: an interaction between treatment intensityTiand a “reform
on” dummy, cohort size, area and cohort fixed effects. To start with, Columns 1 and 2 in Panel B show that an increase inTiin an area is associated with an increase in
the number of successful students in grammar schools after the reform, which is almost as large as the increase in the size of grammar schools in this area. By contrast, Columns 3 and 4 show that an increase in treatment intensityTiin an area
is associated with a decline in the number of successful students in nongrammar schools after the reform which is stronger than the decline in nongrammar schools’
size in this area. These findings confirm that the reform has been associated with nonnegative contextual effects in elite schools, whereas the sign of contextual effects in nonelite schools is ambiguous.
VII. Conclusion
The
Journal
of
Human
Resources
Appendix 1
Descriptive statistics
Table A1a
Descriptive statistics on the 23 local areas
Number of
Prereform (cohorts 1974–78)
Postreform (cohorts 1979–82)
Local Administrative Districts
Elite Schools
Nonelite
Schools Elitea Weight Elitea Weight
CVb
Catholic
Antrim, Belfast, Carrickfergus, Castelreagh, Lisburn, Newtonabbey, North Down
7 21 29.2 11.9 33.0 12.4 0.059
Ards, Down 2 6 25.0 3.3 27.9 3.4 0.059
Armagh, Cookstown, Craigavon, Dungannon
5 14 28.0 7.2 28.5 7.8 0.038
Ballymena, Larne, Magherafelt 3 6 34.8 4.3 36.2 4.3 0.039
Banbridge, Newry & Mourne 5 8 33.5 6.1 38.4 5.8 0.029
Coleraine 2 5 33.7 2.1 35.6 1.9 0.108
Derry, Limavady 2 10 24.9 7.0 27.5 6.9 0.029
Fermanagh 2 7 32.2 2.5 32.6 2.5 0.057
Omagh 2 4 47.9 2.0 48.3 2.1 0.042
Guyon,
Maurin,
and
McNally
715
Ards, North Down 4 7 42.7 6.1 45.0 5.6 0.030
Armagh, Banbridge, Craigavon, Newry&Mourne
4 13 38.3 5.5 36.1 6.4 0.043
Ballymena, Larne 4 4 42.1 3.9 47.6 3.8 0.073
Belfast, Castelreagh 10 24 41.7 12.4 46.5 12.4 0.027
Carrickfergus, Newtonabbey 3 9 27.1 5.7 31.8 5.3 0.046
Coleraine 3 6 38.3 3.7 42.4 3.5 0.059
Cookstown, Dungannon 1 4 17.2 2.1 21.9 1.9 0.068
Derry, Limavady, Omagh, Strabane
4 9 33.5 4.5 36.6 4.4 0.046
Down 1 7 27.8 1.1 38.0 1.1 0.115
Fermanagh 2 4 31.8 1.4 42.8 1.3 0.078
Lisburn 2 5 37.7 3.2 38.9 3.0 0.041
Magherafelt 1 2 40.4 0.9 44.6 0.9 0.120
Mean outside Belfast: 2.6 6.7 32.2 3.6 35.5 3.6 0.062
Standard deviation outside Belfast 1.3 3.0 8.3 2.0 8.4 2.1 0.029
Mean including Belfast 3.1 8.0 32.5 4.3 35.9 4.3 0.060
Standard deviation including Belfast
2.2 5.4 8.2 3.1 8.3 3.2 0.029
Reading: the Antrim district represents 1.6 percent of the total number of pupils in protestant secondary schools in Northern Ireland between 1974 and 1978. The students in this district are distributed across one elite school and six nonelite schools. Between 1974 and 1978, in this district, the fraction of students attending an elite school is 24 percent.
a. Percentage of students in elite schools.
The
Journal
of
Human
Resources
Table A1b
Educational Outcomes Before and After the Reform: Descriptive statistics.
Levels Logs
Prereform (cohorts 1974–78)
Postreform (cohorts 1979–82)
Prereform (cohorts 1974–78)
Postreform (cohorts 1979–82)
Mean
Standard
deviation Mean
Standard
deviation Mean
Standard
deviation Mean
Standard deviation
Proportion in elite schools (Gic) 0.32 0.08 0.36 0.08 −1.16 0.28 −1.06 0.26
Number of successful age 16 students
488 360 620 453 5.93 0.74 6.17 0.74
Number of successful age 18 students
245 200 303 235 5.21 0.79 5.44 0.76
Number entering higher education 265 204 324 247 5.30 0.77 5.51 0.76
Number of beneficiaries from FSM background
347 291 390 326 5.49 0.90 5.62 0.87