© 2020 Program Studi Ilmu Lingkungan Sekolah Pascasarjana UNDIP
JURNAL ILMU LINGKUNGAN
Volume 18 Issue 3 (2020) : 610-616 ISSN 1829-8907
Relationship between Plant Biodiversity and Carbon Stock in Rural
Area of Cisadane Watershed
Sunardi
1, Kaswanto
2, and Sofyan Sjaf
31Study Program of Agricultural Technology, Faculty of Agriculture, Nusa Bangsa University, Indonesia e‐mail: [email protected]
2Department of Landscape Architecture, Faculty of Agriculture, IPB University, Indonesia
3Department of Communication Science and Community Development, Faculty of Human Ecology, IPB University,
Indonesia
ABSTRAK
Kegiatan utama pada lanskap perdesaan adalah pertanian yang didalamnya juga mencakup pengelolaan sumber daya alam dengan berbagai fungsi lanskap seperti area pemukiman, pelayanan pemerintahan, pelayanan sosial dan kegiatan ekonomi. Berbagai kegiatan tersebut akan berdampak pada perubahan keanekaragaman hayati dan cadangan karbon. Penelitian ini bertujuan untuk mengevaluasi hubungan antara keanekaragaman hayati dan cadangan karbon di wilayah pedesaan DAS Cisadane. Dua desa dipilih dengan metode purposive sampling, yaitu Desa Sukadamai dan Desa Bantarsari. Pengamatan dilakukan sebanyak 3 ulangan pada setiap klasifikasi bentuk lanskap sesuai dengan penggunaan lahan di kedua desa tersebut. Bentuk plot berupa bujur sangkar dengan ukuran berdasarkan tipe vegetasi yaitu: 20 x 20 m untuk tipe pohon; 10 x 10 m untuk tipe tiang; 5 x 5 m untuk tipe pancang; dan 2 x 2 m untuk tipe semai. Jumlah spesies dihitung, diukur diameter setinggi dada (DBH) dan tinggi tumbuhan. Data digunakan untuk menghitung indeks keragaman dan kekayaan jenis serta melakukan estimasi cadangan karbon menggunakan software Microsoft Excel. Selanjutnya dilakukan analisis korelasi dengan software R versi 3.6.1. Hasil penelitian menunjukkan bahwa lanskap di Desa Sukadamai dan Bantarsari terdiri dari arena pemukiman, lahan pertanian, kebun campuran dan perkebunan kelapa sawit. Di lanskap dua desa tersebut ditemukan sebanyak 106 spesies dari 43 famili yang diklasifikasikan dalam 9 keragaman horizontal berdasarkan fungsi dan 5 strata keragaman vertikal berdasarkan tinggi tumbuhan. Indeks keragaman tumbuhan Shannon‐Wiener (H’) berkisar antara 2,78–3,20 dan cadangan karbon antara 1,16–51,40 Mg ha‐1. Dari penelitian ini dapat disimpulkan adanya korelasi negatif antara kekayaan jenis dan indeks keragaman dengan cadangan karbon di lanskap perdesaan.
Kata kunci: Lanskap perdesaan, Desa, Indeks keragaman, Kekayaan jenis, Cadangan karbon
ABSTRACT
The main activities in the rural landscape are agriculture, involved natural resources management that compose the function of area as settlement, government services, social services and economy activities. These activities affected the rural landscape that changed plant diversities as well as carbon stock. The aim of this research was to evaluate biodiversity and carbon stock in the rural area of Cisadane Watershed. Two villages were defined on a purposive random sampling, i.e. Sukadamai and Bantarsari. The sampling plots were selected based on main land use type with size for tree was 20 m × 20 m, pole was 10 m x 10 m, sapling was 5 m x 5 m and seedling was 2 m x 2 m; with 3 replications. Similarly, other concentric plots were established. The number of plant species were counted, diameter at breast height (DBH) and plant height were measured. The analysis of carbon stock, plant diversity and the relationship was developed using Microsoft Excel and R 3.6.1 software. The results showed that main land use in Sukadamai and Bantarsari Village consisted of settlement area, farmland, mixed farming and palm oil plantation. In the research area where 106 species from 43 families that classified into 9 horizontal diversity based on function and 5 vertical diversity based on plant height. The values of Shannon‐Wiener Diversity Index (H’) ranged 2,78–3,20. Estimated carbon stocks were 1,16–51,40 Mg ha−1 in research areas, respectively. These research concluded there was a negative correlation between species richness and diversity index with carbon stock in the village landscapes.
Keywords: Rural landscape, Village, Plant diversity index, Species richness, Carbon stock
Citation: Sunardi, Kaswanto, and Sjaf, S. (2020). Relationship between Plant Biodiversity and Carbon Stock in Rural Area of Cisadane Watershed. Jurnal Ilmu Lingkungan, 18(3), 610‐616, doi:10.14710/jil.18.3.610‐616
1. Introduction
Rural areas have main activities on agricultural work, including natural resources management that implied on landscape structure and function.
Multifunctionality of rural areas were resident, government services, social services and economy activities. In Indonesia, rural areas have several types of landscape, mostly agricultural landscape. Rural
areas is the main service providing units for urban area, such as agricultural landscape has main role on food services in local, regional until global scale (White et al 2009). Human activities affect landscape changes related to human needs and landscape service usage that involve demographic processes, economy, politics, cultures and biophysics (Nelson et al 2006). Biophysical condition on rural landscape are varied such as farm area, forest, garden and other agricultural field have benefit on nature to maintain environment balance and sustainability (Lamarque et al 2011).
Different types of landscape provide different types and amounts of landscape services, which require different management (Wu et al 2013). Nowak and Grunewald (2018) reported that in agricultural landscapes there were low landscape diversity and connectivity of forest patches, low values of erosion control and climate regulation, but high values of nutrient retention. Besides, there is another significant growing concern about the relationship between biodiversity and carbon stock as the asset and ecosystem sharing value to improve rural community welfare (Kaswanto and Nakagoshi, 2014).
There were several studies of biodiversity in rural areas, especially Shannon Wiener diversity index on home garden (pekarangan) of 2.56‐2.84 (Filqisthi and Kaswanto 2017), 0.99 for tree (Wiryono et al 2016) and 0.77‐2.51 on small scale agroforestry (Choliq and Kaswanto 2017). On the other side the correlation of biodiversity and carbon stock were varied in each area, i.e. insignificant relationship at home garden (Filqisthi and Kaswanto 2017; Choliq and Kaswanto 2017), then positive and very weak relationship at collaborative forest (Mandal et al 2013). However,
there were lacks on assessment of biodiversity index and carbon stock correlation on the whole rural area with varied landscape function. Thus it became necessary to carry out studies to understand plant diversity and estimate the carbon stock stored in village landscapes. The information will be useful to decide land use type development or prevent land changes in order to optimize carbon stock stored in rural areas. Therefore, this research aims to assess correlation between biodiversity index and carbon stock at several biophysical conditions of Sukadamai and Bantarsari Villages along Cisadane Watershed.
2. Methods
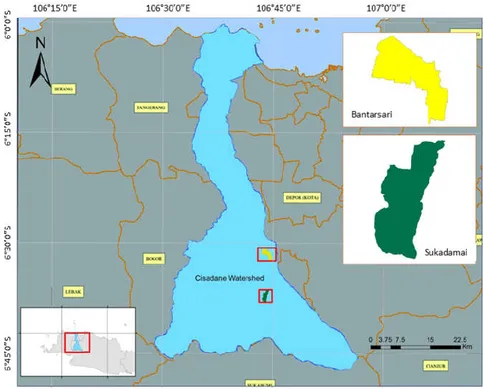
The study site is located at Cisadane Watershed, Bogor, West Java, Indonesia (Figure 1). Village samples were taken by purposive random sampling, i.e. Sukadamai Village of Dramaga District (altitude is 300 m above sea level) and Bantarsari Village of Rancabungur District (165 m asl).
Sampling plots were carried out on five land use consisting of two type in Sukadamai Village, namely farmland (S‐LP) and mixed farming (S‐KP) while in Bantarsari Village on farmland (B‐LP), mixed farming (B‐KP) and palmoil plantations (B‐SW).
Stratified random sampling was applied to gather the biophysical data. The main strata specifically regeneration, pole, and tree based on the biophysical condition of the village. The plot sampling was carried out to calculate the number of sample plots. For this purpose three sample plots were taken from each land use due to small village scale and uniformity human activities. In this context, the diameter at breast height (DBH) and height of vegetations were measured to determine the minimum number of sample plots based on coefficient of variance (Hairiah et al 2011).
Jurnal Ilmu Lingkungan (2020), 18 (3): 610-616, ISSN 1829-8907
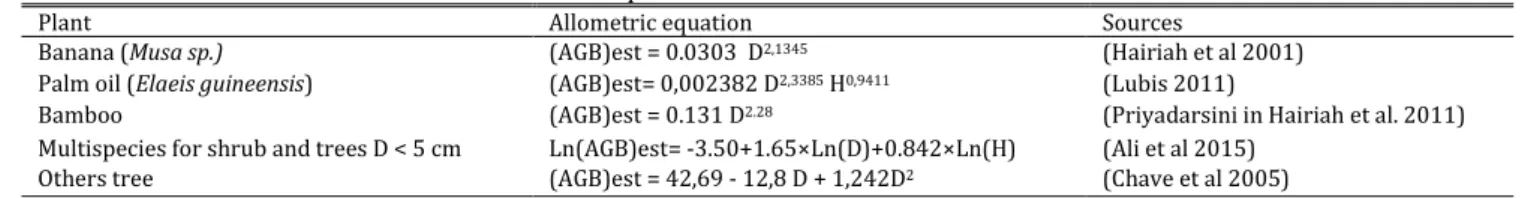
Table1. Allometric Equations for Estimated Above Ground Biomass
Plant Allometric equation Sources
Banana (Musa sp.) (AGB)est = 0.0303 D2,1345 (Hairiah et al 2001)
Palm oil (Elaeis guineensis) (AGB)est= 0,002382 D2,3385 H0,9411 (Lubis 2011)
Bamboo (AGB)est = 0.131 D2.28 (Priyadarsini in Hairiah et al. 2011)
Multispecies for shrub and trees D < 5 cm Ln(AGB)est= ‐3.50+1.65×Ln(D)+0.842×Ln(H) (Ali et al 2015)
Others tree (AGB)est = 42,69 ‐ 12,8 D + 1,242D2 (Chave et al 2005)
(AGB)est = Estimated above ground tree biomass, kg/tree; D = DBH, diameter at breastheight, cm; H = tree height, m
Firstly, sample plots were distributed on each stratum on the villages map, and the coordinates of sample plots were uploaded in GPS. Secondly, concentric sample plots were established in the field by navigating the GPS coordinates. A total of 15 plots were laid out (6 in Sukadamai and 9 in Bantarsari). The plot sampling was laid out and nested plots for various plant types. The size for trees 20 m × 20 m, for poles 10 m × 10 m, for sapling 5 m × 5 m and for seedling 2 m × 2 m. The plot was laid out simultaneously (Figure 2). The height and diameter at breast height (DBH) of plants having > 2 cm were measured, seedlings, herbs, and shrubs were counted. In addition, the list of tree, sapling, seeding, herbs and grasses species was prepared to assess the biodiversity.
Figure 2. Design of Plot Sampling Base of Plant Type
The diversity divided into five stratum based on vertical structure, plant less than 1 meter for the first stratum (I) that, 1 to 2 meters for second stratum (II), 2 to 5 meters for third stratum (III), 5 to 10 meters for fourth stratum IV and more than 10 meters high for the fifth stratum (V). Based on horizontal diversity (the function of plants) divided into nine functions i.e ornamental plants, industrial plants, starch crops, medicinal plants, vegetables, fruit, forage for animals, spices and other purposes.
2.1. Data Analysis
Biodiversity was calculated by Shannon‐Wiener index, which combines the number of species and number of individuals of each type within a community (Ponce‐Hernandez, 2004).
The index is thus as below : = −
Where H’ is diversity index and pi is s the total individuals in a species community.
Carbon Stock conducted by estimation species biomass using alometric equations. Alometric equations were used for estimation by Table 1. All plants on each landscape are considered for determining above ground biomass.
Trees biomass that have more than 5 cm DBH were estimated by allometric model (Chave et al 2005), while shrub generalized by allometric model (Ali et al 2015). Carbon stock for seedling type was estimated by Roshetko et al (2002) i.e. 0.3 Mg ha‐1
while plant on farmland by Syam'ani et al. (2012) i.e. 1.16 Mg ha‐1. The above ground carbon stock was
considered as 50% of above ground biomass (Hairiah et al 2001). Results were then scaled from Mg plot‐1 to
Mg ha‐1.
3. Result
3.1. Rural Landscapes
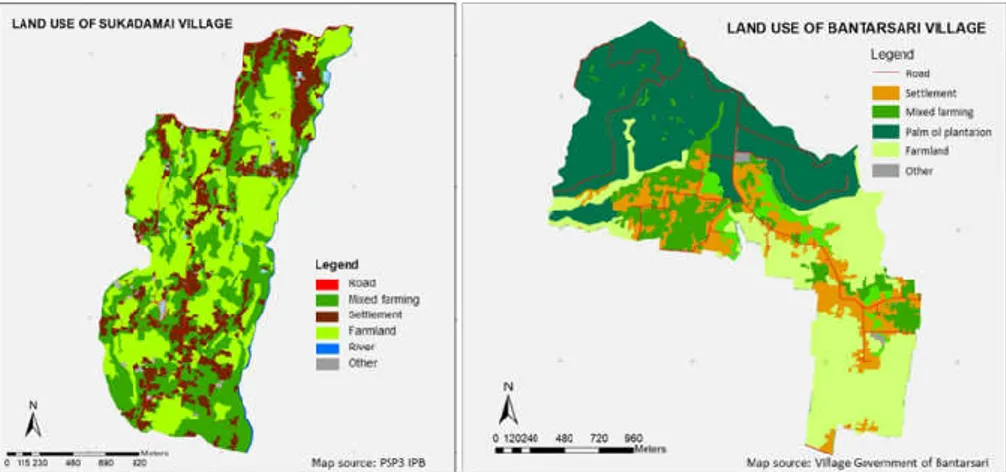
Sukadamai and Bantarsari Village in the upstream segment of Cisadane Watershed at 165‐437 m. asl. Rural landscapes at Sukadamai in the upstream village divided by three main types, i.e. settlement, farmland and mixed farming. Landscape at Bantarsari Village is similar to Sukadamai, beside it has palm oil plantation area (Figure 3). In this research, biodiversity and carbon stock were studied at farmland, mixed farming and palm oil plantation.
Generally, farmers cultivate horticulture and other crops in farmland. They practice a monoculture farming system in farmland. On the other side, farmers cultivate various plants in mixed farming, including some trees and medicinal herbs. Farming management and agricultural practices implied on plant diversity limitation (Eilu et al 2003).
3.2. Plants Biodiversity
The research identified 106 species in 43 families that have collected in all landscape areas in Sukadamai and Bantarsari Village. The plants divided in some functions i.e ornamental plants (6%), industrial plants (5%), starch crops (6%), medicinal plants (19%), vegetables (15%), fruit (6%), forage (13%), spice (4%) and others (27%) (Figure 4).
The number of species was smaller than previous studies in Ciliwung and Cisadane Watersheds in West Java which reached 265 species (Kaswanto et al 2016). It was related to range of research area in the previous research was larger and involved several villages, however, some species also found in this research.
Figure 3. Land Use Type of Sukadamai and Bantarsari Village
Poaceae, asteraceae, fabaceae, amaranthaceae, euphorbiaceae, moraceae family are the highest number of species with a percentage of 45%. Most of plants from these poaceae function as forage such us Brachiaria reptans, Digitaria sanguinalis, Echinochloa crusgalli, Ischaemum rugosum, Panicum maximum and Setaria palmifolia.
Medicinal plants are usually found in Euphorbiaceae, Phyllanthaceae, Asteraceae, and Cyperaceae such as Euphorbia hirta, Phyllanthus urinaria, Ageratum conyzoides, Eclypta alba and Peperomia pellucida. Most vegetables plants are found from asteraceae, cucurbitaceae, convolvulaceae family such as Cosmos caudatus, Ipomoea reptans, Cucumis sativus, Diplazium esculentum and Momordica charantia. Diplazium esculentum (vegetable fern/paku sayur) is used as vegetables at Bantarsari Village that were harvested in the palm oil plantation area. Palm oil and nutmeg (Myristica fragrans) categorized in industrial plants.
Figure 4. Percentage of Plant Function
Plants in the first stratum are commonly found with 84%, such as Poaceae, Amaranthaceae, Polypodiceae, Asteraceae, Euphorbiaceae and Araceae. The tree is more often found in stratum V with 7% and stratum IV with 4%, stratum II and III only by 2% and 3% (Figure 5). In these height stratum IV and V include fruits plants such as durian (Durio
zibethinus), duku (Lansium parasiticum), nangka (Artocarpus heterophyllus) and coconut (Cocos nucifera) than stratum II and III found guava (Psidium guajava), papaya (Carica papaya), and banana (Musa sp.). It represents that plant diversity in this area was selected to fulfil human needs, especially food sources.
Figure 5. Percentage of Plants Stratification
The result showed that there were different compositions of plant types in each landscape (Table 2).
Tabel 2. Diversity Index Based on Plant Type
Plant type Shannon–Wiener index (H’)
B‐KP B‐LP B‐SW S‐KP S‐LP
Seedling 2.66 2.84 3.16 2.36 2.87 Sapling 0.84 N/A N/A N/A N/A Pole 0.56 N/A N/A 0.35 N/A Tree 0.69 N/A 0.0* 1.90 N/A *only one spesies of palm oil; seedling= plant height below 1.5 m; sapling= plant height from 1.5 m with diameter <10 cm; pole= plant diameter 10 cm< x <20 cm; trees= plant diameter ≥20 cm; S‐LP= farmland at Sukadamai; S‐KP= mixed farming at Sukadamai; B‐KP= mixed farming at Bantarsari; B‐LP= farmland at Bantarsari; B‐SW= palm oil plantation at Bantarsari
Seedling could be found in all landscapes, sapling and pole were found in mixed farming while trees were found in mixed farming palm oil plantation. The
Jurnal Ilmu Lingkungan (2020), 18 (3): 610-616, ISSN 1829-8907
associated diversity at all types. Stupino et al (2008) reported that conventional agricultural management limited plant diversity and increased homogeneously distributed plants group.
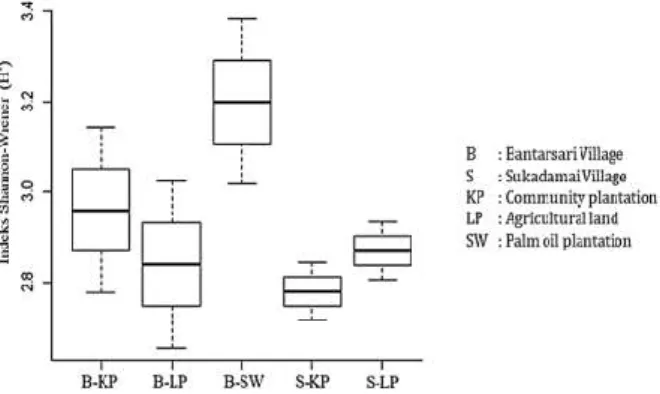
In general, average Shannon‐Wiener index (H’) in Sukadamai Village was 2.83 lower than Bantarsari was 3.00. Most farmland structures include intensive landscape areas that have vertical and horizontal diversity quite high with H’ range of 2.78 – 3.20 (Figure 6). In the farmland area, plant diversity is limited due to mechanised nature of farming and the monocultures involved (Eilu et al 2003).
Figure 6. Shannon Wiener Index based on Land Use Type
The highest species diversity index at palm oil plantation areas is dominated by fern (9 species) and grasses (13 species). In Indonesia’s rural area, plant diversity supports village community life as food and fuel sources (Kaswanto et al 2016). The difference of plant life time increases plant support ability through different seasons (Wiryono et al 2016). It has a potential to optimize community plantation through an integrated system that needs policy and collaboration of stakeholders (Estrada‐Carmona et al 2014).
3.3. Carbon Stock
The research revealed that carbon stock in palm oil plantations was around 0.3 until 17.51 Mg ha‐1
while mixed farming reached 0.3 until 50.78 Mg ha‐1
(Table 3). The various carbon stocks occur on this research due to differences in plant types on each land use.
Table 3. Above Ground Carbon Stock Based on Plant Type
Plant type Above‐ground carbon stock (Mg ha‐1)
B‐KP B‐LP B‐SW S‐KP S‐LP
Seedling 0.30 1.16 0.30 0.30 1.16
Sapling 0.82 N/A N/A N/A N/A
Pole 3.04 N/A N/A 0.32 N/A
Tree 25.49 N/A 17.51 50.78 N/A
S‐LP= farmland at Sukadamai; S‐KP= mixed farming at Sukadamai; B‐KP= mixed farming at Bantarsari; B‐LP= farmland at Bantarsari; B‐SW= palm oil plantation at Bantarsari
Carbon stock value in this area was appropriate as the range of palm oil plantations in Malaysia that carbon stock reached 2.0‐60.0 Mg ha‐1 (Kho and
Jepsen, 2015). Carbon stock value in palm oil plantations affected by soil carbon, neutrality of carbon ion, ratio canopy: root included cover crop diversity (Khasanah et al, 2015). Moreover, carbon stock value is also related to micro climate, community activities and soil pH in palm oil plantation (Chen et al, 2018).
The result showed that carbon stock in mixed farming was higher than palm oil plantation (Table 4). In the research area, carbon stock in mixed farming average calculation reached 38.14 Mg ha‐1, totally.
Henry et al (2009) revealed that the high number of plants per area in community plant and tree growth rate of each plant affects the amount of carbon that can be stored.
Table 4. Land Use Type, Plant Diversity Index, Dimension and Carbon Stock
Land use type Species H' DBH (cm) Carbon Stock (Mg
ha‐1) <10 10‐20 21‐30 31‐40 >40 B‐KP 28 2.96 F F F F ‐ 28.95 B‐LP 36 2.84 F ‐ ‐ ‐ ‐ 1.16 B‐SW 37 3.20 F ‐ ‐ ‐ F 17.81 S‐KP 27 2.78 F F F F F 51.40 S‐LP 34 2.87 F ‐ ‐ ‐ ‐ 1.16
DBH= diameter at breast height, H’= Shannon‐Wiener Index, F= found
Mixed farming consisted of various fruit trees that affected vegetation structure and composition of landscape. Each fruit tree has different size, especially on plant height and canopy width. In this research, carbon stock value increases related to plant diameter at breastheight (Figure 7). Bajigo et al (2015) reported that plant structure and composition involving tree size, height and density, have influence on the above ground carbon stock. Average carbon stock in these research tend higher than other research at downstream, middle and upstream of Cisadane watershed (Kaswanto et al, 2016) due to
3.4. Correlation of Diversity Index and Carbon Stock
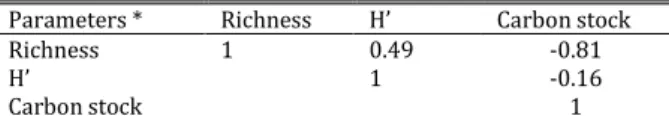
Correlation analysis of plant diversity index and species richness with carbon stock at village landscapes presented on Table 5. Correlation analysis used Product‐Moment Pearson Test revealed that species richness and diversity index has negative correlation with carbon stock, i.e. r= ‐0.81 and r=‐0.16.
Table 5. Correlation analysis of richness, diversity index
and carbon stock
Parameters * Richness H’ Carbon stock
Richness 1 0.49 ‐0.81
H’ 1 ‐0.16
Carbon stock 1
*Correlation analysis used Product‐Moment Pearson Test (r) H‘= Shannon‐Wiener Diversity Index
The negative correlation value between plant diversity index and stored carbon shows that the higher plant diversity index decreases the value of carbon stored in the research area. The carbon stock value depends on tree size (girth), wood density, and height, where wood density is very important (Chave et al 2014). Plant diversity in Bantarsari Village was dominated by stratum I that plant height less 1 m and only few trees have diameter more than 20 cm (Table 2). Moreover, Nero (2018) reported that carbon stock increased with increasing diameter class of trees. On the other side, Markum et al (2013) proved that stored carbon values have correlation with wood density. The high value of plant diversity in the palm oil plantations was not followed by carbon stock value in Bantarsari Village due to low wood density of palm oil tree. Ashaari (2017) reported that wood density of monocot trees is lower than other trees, which ranges from 0.196 ‐ 0.362 Mg m‐3 dry air. The average density
of palm oil tree values ranged between 0.11 ‐ 0.24 Mg m‐3 (Sunaryathy et al 2015). In Bantarsari Village,
domination of palm oil tree which is categorized as monocot mixed with pteridophyta or fern.
4. Conclusion
Sukadamai and Bantarsari Village are divided in four main types of landscape, i.e. settlement, farmland, mixed farming and palm oil plantation area. There were 106 species in 43 families in all landscape areas with diversity index were 2.78‐3.20 and carbon stock were 1.16‐51.40 Mg ha‐1. Correlation analysis
revealed that carbon stock has a negative relation with species richness and diversity index, i.e. r = ‐0.81 and r=‐0.16. These findings could provide insights for considering plant type cultivation to increase carbon stock in rural areas. However, the plant type choices can be analyzed more precisely.
REFERENCES
Ali, A., Xu, M.S.S., Zhao, Y.T.T., Zhang, Q.Q.Q., Zhou, L.L.L., Yang, X.D.D., and Yan, E.R.R. 2015. Allometric Biomass Equations for Shrub and Small Tree Species in Subtropical China. Silva Fennica, Vol. 49 No. 4. Pages 1–10.
Ashaari, Z. 2017. Low Density Wood from Poor to Excellent, Universiti Putra Malaysia Press. Serdang. Malaysia. Bajigo, A., Tadesse, M., Moges, Y., and Anjulo, A. 2015.
Estimation of Carbon Stored in Agroforestry Practices in Gununo Watershed, Wolayitta Zone, Ethiopia. Journal Ecosystem Ecography, Vol. 5. Pages 157. Chave, J., Andalo, C., Brown, S., Cairns, M. A., Chambers, J. Q.,
Eamus, D., Fölster, H., Fromard, F., Higuchi, N., Kira, T., Lescure, J.‐P., Nelson, B. W., Ogawa, H., Puig, H., Riéra, B., and Yamakura, T. 2005. Tree allometry and improved estimation of carbon stocks and balance in tropical forests. Oecologia, Vol. 145. Pages 87–99. Chave, J., Réjou‐Méchain, M., Búrquez, A., Chidumayo, E.,
Colgan, M.S., Delitti, W.B.C., Duque, A., Eid, T., Fearnside P.M., Goodman, R.C, Henry, M., Martínez‐ Yrízar, A., Mugasha, W.A., Muller‐Landau, H.C., Mencuccini, M., Nelson, B.W., Ngomanda, A., Nogueira, E.M., Ortiz‐Malavassi, E., Pélissier, R., Ploton, P., Ryan, C. M., Saldarriaga, J.G., and Vieilledent, G. 2014. Improved allometric models to estimate the aboveground biomass of tropical trees. Global Change Biology, Vol. 20. Pages 3177–3190.
Chen, S., Wang, W., Xu, W., Wang, Y., Wan, H., Chen, D., Tang, Z., Tang, X., Zhou, G., Xie, Z., Zhou, D., Shangguan, Z., Huang, J., He, J., Wang, Y., Sheng, J., Tang, L., Li, X., Dong, M., Wu, Y., Wang, Q., Wang, Z., Wu, J., Chapin III, F.S., and Bai, Y. 2018. Plant diversity enhances productivity and soil carbon storage. Proceedings of the National Academy of Sciences of the United States of America, Vol. 115 No. 16. Pages 4027‐4032.
Choliq, M.B.S. and Kaswanto, R.L. 2017. Correlation of Carbon Stock and Biodiversity Index at the Small Scale Agroforestry Landscape in Ciliwung Watershed. IOP Conf. Series: Earth and Environmental Science, Vol. 91. Pages 1‐6.
Eilu, G., Obua, J., Tumuhairwe, J.K., and Nkwine, C. 2003. Traditional Farming and Plant Species Diversity in Agricultural Landscapes of SOUTH‐WESTERN Uganda, Agriculture Ecosystems and Environment, Vol. 99. Pages 125‐134.
Estrada‐Carmona, N., Hart, A.K, DeClerck, F.A.J., Harvey, C.A., and Milder, J.C. 2014. Integrated Landscape Management for Agriculture, Rural Livelihoods, and Ecosystem Conservation: An Assessment of Experience from Latin America and the Caribbean, Landscape and Urban Planning, Vol. 129. Pages 1–11. Filqisthi, T.A. and Kaswanto, R.L. 2017. Carbon Stock and
Plants Biodiversity of Pekarangan in Cisadane Watershed West Java. IOP Conf. Series: Earth and Environmental Science, Vol. 54. Pages 1‐10.
Hairiah, K., Sitompul, S.M., and van Noordwijk, M. 2001. Methods for sampling carbon stocks above and below ground. ASB Lecture Note 4B, International Centre for Research in Agroforestry (ICRAF), Bogor.
Hairiah, K., Dewi, S., Agus, F., Velarde, S., Ekadinata, A., Rahayu, S., and van Noordwijk, M. 2011. Measuring Carbon Stocks across Land Use Systems: A Manual. Bogor, Indonesia. World Agroforestry Centre (ICRAF), SEA Regional Office, 154 pages.
Henry, M., Tittonell, P., Manlay, R.J., Bernoux, M., and Alberecht, A. 2009. Biodiversity, Carbon Stock and sequestration potential in aboveground biomass in smallholder farming systems of Western Kenya. Agriculture, Ecosystems and Environment, Vol. 129. Pages 238‐252.
Kaswanto, R.L, Filqisthi, T.A., and Choliq, M.B.S. 2016. Revitalisasi Pekarangan Lanskap Perdesaan sebagai Penyedia Jasa Lanskap untuk Meningkatkan
Jurnal Ilmu Lingkungan (2020), 18 (3): 610-616, ISSN 1829-8907 Kesejahteraan Masyarakat. Jurnal Lansekap
Indonesia, Vol. 8 No. 1. Hal 50‐60.
Kaswanto, R.L., and Nakagoshi, N. 2014. Landscape Ecology‐ Based Approach for Assessing Pekarangan Condition to Preserve Protected Area in West Java. In: Nakagoshi N, A. Mabuhay J, Editors. Designing Low Carbon Societies in Landscapes, Ecological Research Monographs. Springer, Japan, pp: 289‐311.
Khasanah, N., van Noordwijk, M., and Ningsih, H. 2015. Above Ground Carbon Stocks in Oil Palm Plantations and the threshold for Carbon‐Neutral Vegetation Conversion on Mineral Soils. Cogent Environmental Science. Vol. 1 No. 1. Pages 1119964.
Kho, L.K. and Jepsen, M.R. 2015. Carbon Stock of Malaysian Forest and Oil Palm: A Review. Singapore Journal Tropical Geography, Vol. 36. pp: 249‐266.
Lamarque, P., Quetier, F., and Lacorel, S. 2011. The Diversity of the Ecosystem Services Concept and its Implication for Their Assessment and Management. CR Biologies Vol. 344 No. 5‐6. pp: 441‐449.
Lubis, A.R. 2011. Pendugaan Cadangan Karbon Kelapa Sawit Berdasarkan Persamaan Alometrik di Lahan Gambut Kebun Meranti Paham, PT. Perkebunan Nusantara IV, Kabupaten Labuhan Batu, Sumatera Utara. Departemen Ilmu Tanah dan Sumberdaya Lahan. Undergraduate theses, Institut Pertanian Bogor, Indonesia.
Mandal, R. A., Dutta, I. C., Jha, P. K., and Karmacharya, S. 2013. Relationship Between Carbon Stock and Plant Biodiversity in Collaborative Forests in Terai, Nepal, ISRN Botany, 7 pages.
Markum, Arisoesilaningsih, E., Suprayogo, D., and Hairiah, K. 2013. Plant species diversity in relation to carbon stocks at Jangkok watershed, Lombok Island. Agrivita, Vol. 35 No. 3. Pages 2017‐217.
Nelson, G.C., Bennett, E., Berhe, A.A., Cassman, K., DeFries, R., Dietz, T., Dobermann, A., Dobson, A., Janetos, A., Levy, M., Marco, D., Nakicenovic, N., O’Neill, B., Norgaard, R., Petschel‐Held, G., Ojima, D., Pingali, P., Watson, R., and Zurek, M. 2006. Anthropogenic Drivers of Ecosystem Change: An Overview, Ecology and Society, Vol. 11 No. 2. Pages 29.
Nero, B.F., Callo‐Concha, D., and Denich, M. 2018. Structure, Diversity, and Carbon Stocks of the Tree Community of Kumasi, Ghana. Forests, Vol. 9 No. 9. Pages 519. Nowak, A., & Grunewald, K. 2018. Landscape Sustainability
in Terms of Landscape Services in Rural Areas: Exemplified with a Case Study Area in Poland, Ecological Indicators, Vol. 94 No. 2. pp:12‐22. Ponce‐Hernandez, R. 2004. Assessing Carbon Stocks and
Modelling Win‐Win Scenarios of carbon Sequestration Through Land‐Use Changes. FAO, Rome.
Roshetko, J., Delaney, M., Hairiah, K., and Purnomosidhi, P. 2002. Carbon Stocks in Indonesian Homegarden Systems: Can Smallholder Systems be Targeted for Increased Carbon Storage?, American Journal of Alternative Agriculture, Vol. 17 No. 3. Pages 138‐148. Sunaryathy, P. I., Suhasman, Kanniah, K. D., and Kian, K.P.
2015. Estimating Aboveground Biomass of Oil Palm Trees by Using the Destructive Method. World Journal of Agricultural Research, Vol. 3 No. 1. Pages 17‐19. Syam’ani, Agustina AR, Susilawati, and Nugroho Y. 2012.
Cadangan Karbon di Atas Permukaan Tanah pada Berbagai Sistem Penutupan Lahan di Sub‐Sub Das Amandit. Jurnal Hutan Tropika, Vol. 13 No. 2. Hal 148– 158.
Stupino, S.A., Frangi, J.L., Sarandon, S.J., Arturi, M.F., Ferreira, A.C. 2008. Plant Diversity in Two Horticultural Farms Under Organic and Conventional Management in La Plata, Argentina: A Case Study, Revista Brasileira de Agroecologia, Vol. 3 No. 3. Pages 24‐35.
White, E.M., Morzillob, A.T., and Alig, R.J. 2009. Past and Projected Rural Land Conversion in the US at State, Regional, and National Levels, Landscape and Urban Planning, Vol. 89 No. 1‐2. Pages 37‐48.
Wiryono, Puteri, V.N.U., and Senoaji, G. 2016. The Diversity of Plant Species, the Types of Plant Uses and the Estimate of Carbon Stock in Agroforestry System in Harapan Makmur Village, Bengkulu, Indonesia, Biodiversitas, Vol. 17 No. 1. Pages 249‐255.
Wu, J., Fenga, Z., Gao, Y., and Peng, J. 2013. Hotspot and Relationship Identification in Multiple Landscape Services: A Case Study on an Area with Intensive Human Activities, Ecological Indicators 29. Pages 529–537.