CHAPTER IV
FINDINGS AND DISCUSSION
This chapter discusses about the findings of the research based on the data which the data were collected and analyzed.
A.Research Findings 1. Data Description
The data of this study was the score of students’ mastery of past tense and students’ writing past recount text. This study was contucted at SMA N 1 Kotawaringin Lama in which seventh grade students, which located at Jl. Pangkalan Muntai Km. 2 Kotawaringin Lama, Kabupaten Kotawaringin Barat. The research was conducted from March 26th 2016up to April 9th 2016. In this study researcher used quantitative correlation method. To collect the data the writer used test. There were two tests that was given to the participants. It was past tense test and writing test. The test of past tense was conducted by the writer was multiple choice and the test of writing test that was conducted by the writer was writing past recount text. To find out the correlation between students’ mastery of past tense and students’ writing past recount text the writer used product moment
correlation.
a. Students’ Mastery of Past Tense
Researcher used multiple choice test tomeasure students’ mastery of past tense. There were 25 questions and 4 alternative answersfor each question. Based on the test that was given to eleventh
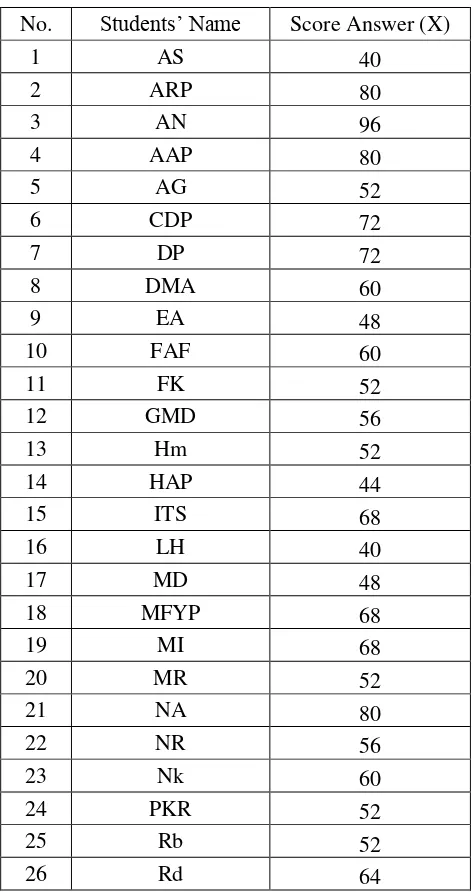
grade students of SMA N 1 Kotawaringin Lama the total score in terms of past tense mastery was 2396. The average result was 59.9. The higher score was 90. The lower score was 40. The result can be seen in table 4.1:
Table 4.1
The Score of Stuents Mastery of Past Tense (X) at Elventh Grade Students of SMA N 1 Kotawaringin lama
27 RP 60
Based on the data above, it can be seen in chart gaps:
It showed that table and figure above, the students’ score in
past tense. There were 3 students who got score 40. There was one student who got score 44. There were six students who got score 48. There were six students who got score 52. There three students who got score 56. There were seven students who got score 60. There were three students who got score 64. There were three students who got score 68. There were two students who got score 72. There was one student who got score 76. There were three students who got 80. There was one student who got score 92. And there was one student who got score 96. b. Students’ Achievement in Writing Past Recount Text
To know the students’ achievement in writing past recount text, researcher used a writing test. Researcher asked the students to write at least three paragraphs about their yesterday’s activity. The total score in writing past recount text of eleventh grade students of SMAN 1 Kotawaringin Lama was 2610. The average score of the students was 64.41.The higher score was 80.5. The lower score was 30.The result can be seen in table 4.2:
Table 4.2
The Score of Stuents Achievement in Writing Past Recount Text (Y) at ESleventh Grade Students of SMA N 1 Kotawaringin lama
No. Students’ Name Score Answer (Y)
1 AS 45
Higher 80.5
Lower 30
Std. Deviation 64.22
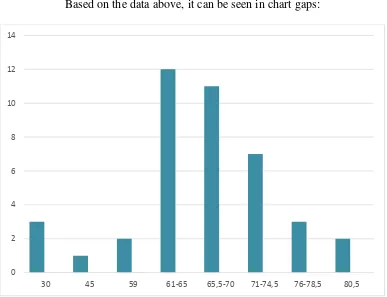
Based on the data above, it can be seen in chart gaps:
Figure 4.2 Writing Score
It showed that table and figure above, the students’ score in
writing past recount text. There were 3 students who got score 30. There was one student who got score 45. There were one student who got score 59. There were twelve students who got score 61-65. There eleven
students who got score 65.5-70. There were seven students who got score 71-74.5. There were three students who got score 76-78.5. And there was one student who got score 80.5.
0 2 4 6 8 10 12 14
The comparison both of the result of the score can be seen in table 4.3:
Table 4.3
Comparison Students’ Past Tense Score and Writing Score
31 Sn 40 71
32 SJ 48 67.5
33 SLA 48 64
34 SM 92 80.5
35 SA 76 78.5
36 Sr 48 78.5
37 UW 64 65
38 WA 60 68
39 Wsm 48 59
40 Yl 60 66
Average 59.9 64.41
Higher 90 80.5
Lower 40 30
Std. Deviation 13.450 64.22
2. Data Analysis
Before analyzed the data, the normality, homogeneity, and linearity distribution of the data sets the two variables (mastery of past tense and writing past recount text) were firstly tested.
a. Test of Normality
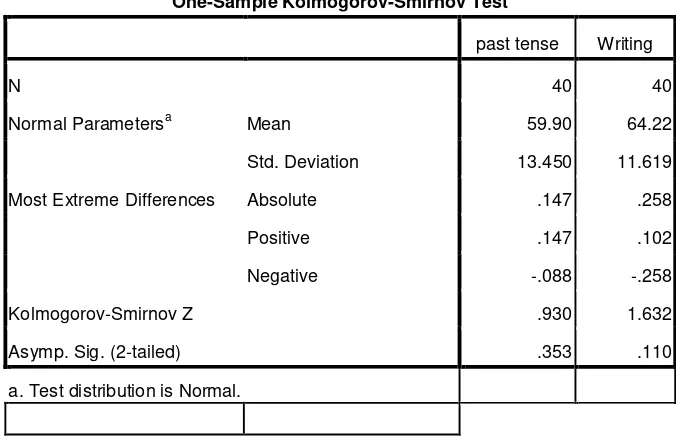
Table 4.4 Test of Normality
One-Sample Kolmogorov-Smirnov Test
past tense Writing
N 40 40
Normal Parametersa Mean 59.90 64.22 Std. Deviation 13.450 11.619 Most Extreme Differences Absolute .147 .258
Positive .147 .102
Negative -.088 -.258
Kolmogorov-Smirnov Z .930 1.632
Asymp. Sig. (2-tailed) .353 .110
a. Test distribution is Normal.
Based on the result of normality using SPSS 16.0 program. It found that kolmogrov-smirnov Z of the test score of past tense=0,930and test score of writing=1.632 which are higher than significance 0.05. Thus, it could be concluded that the null hypothesis was accepted and the data was normally distributed.
b. Test of Homogeneity
Table 4.5
Based on the result of homogeneity using SPSS 16.0 program, it found that significance=0.032 is lower than 0.05, it means that the data is not homogeny.
c. Test of Linearity
The linearity of mastery of pasttense and writing past recount text were analyzed by using SPSS 16.0 program and presented using ANOVA table. The result of analysis was presented in the table 4.6:
Table 4.6
Within Groups 2814.357 27 104.235
The table above reveals the linearity distribution of the data of both (mastery of past tense and writing past recount text). It can be seen that significance=0.158 is higher than 0.05, it means there is significance between students’ mastery of past tense and students’ achievement in
writing past recount text.
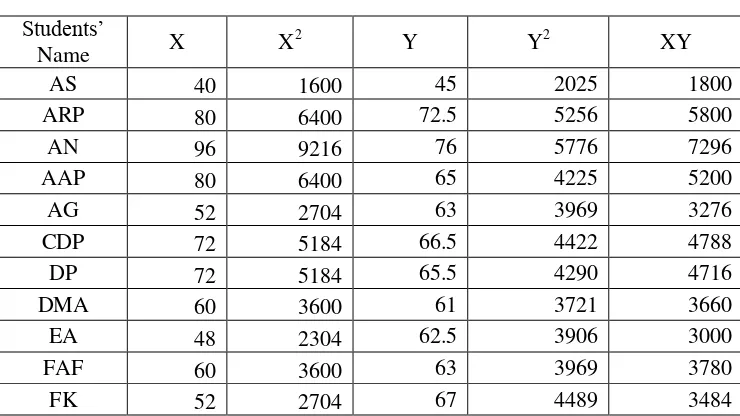
d. Test of Hypothesis Using Pearson Product Moment Correlation 1. Manual Calculation
After calculating the total scores of the variables of this study, past tensemastery (X) and writing past recount text (Y), the data analysis of this study is carried on to investigate the reletionship between both of the varibles. It was analyzed by using Pearson Product moment. The Pearson ProductMoment correlation is symbolized with rxy. To get the score rxy, firstly the scores of ∑xy, ∑x2, and ∑y2
( ) ( )( )
√* ( ) ( ) +* ( ) ( ) +
√* +* +
√* +* +
√
After the score rxy is obtained, it is compared with the score of rtable. To find out the critical value of rtable the writer firstly must find the degrees of significant 5%. The formula of Df as follows:
Df = N – 2 = 40 – 2 = 38
Df = degree of freedom
N = total number of research population
After found the Df, it known that rtable with Df = 38, 5% significant is 0.312.
2. SPSS Calculation
calculation that the writer did manually was correct and to make sure that there is no mismatching calculation between scores that the writer counted manually. The calculation of SPSS was describe in table 4.8:
Table 4.8 SPSS Correlation
Correlations
past tense score writing score past tense score Pearson Correlation 1 .345*
Sig. (2-tailed) .029
N 40 40
writing score Pearson Correlation .345* 1 Sig. (2-tailed) .029
N 40 40
*. Correlation is significant at the 0.05 level (2-tailed).
It could be interpreted based on the result of calculation that Ha there was a significance positive correlation between the students’ mastery of past tense and writingpast recount text. It meant that the mastery of past tense gave significance positive correlation on students writing past recount text at eleventh grade students of SMA N 1 Kotawaringin Lama.
B.Interpretation of The Result
From the computation above, it can be seen that the value of rxyis
0.347. To know whether there is a significant correlation between the two
be concluded that rxy is greater than rtable in other words, 0.347 is greater than 0.312 and lower than 0,403.
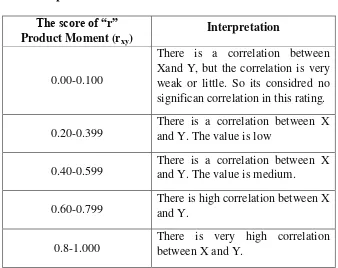
Based on the hypothesis it can be concluded that Ho is rejected and Ha is accepted. It means that there is correlation between students’ mastery of past tense and student’ achievement in writing past recount text.The table of of “r” product moment is such in table 4.9:
There is high correlation between X and Y.
0.8-1.000
There is very high correlation between X and Y.
calculation that was counted by the product moment above showed that the result was 0.347, so that Ha accepted and Ho was rejected.
Even so, it was known the result of “r” =0,403>0.347>0.312 it can be explain that the value of “r” was higher than 5%, the value of “r” was there was low correlation and the correlation was positive.
if rxy>rtable refused Ha it meant it was significant and if rxy<rtable -received Ho, it meant it was not significant. Based on the calculation above 0.347 and n = 40, so df = n – 2 = 38 and rtable was 0.312So, it can be seen that rxy>rtable5% so that the result was the Ha was accepted and Ho was refused. In this case that variable X (mastery of past tense) ensures students’ to do good writing past recount text.
And to know the contribution of the variable X (mastery of past tense) and variable Y (writing past recount text) was used the formula as below:
KP = r2 x 100%1 Where:
KP = determinant coefficient score
r = correlation coefficient score KP = r2× 100%
= 0.3472 x 100
1
=0.120 x 100% =12.04%
So it meant that the variable X (mastery of past tense) gave the contribution’ in writing past recount text was 12.04% and 78.96% was influenced by other aspects.
C.Discussion
The purpose of the data analysis in this research is used to measure
the significant correlation between the students’ mastery of past tense and
writing past recount text at SMA N 1 Kotawaringin Lama.
Based on the data description and data analysis above, it can be seen
the avarage score (mean) of mastery of past tense is 59.9 and the mean score of
writing pat recount text is 64.41.
According tothe result the calculation of data analysis, the score of
correlation coeficient (rxy) is higher than score in r table (rtable). In this case, the
correlation coeficient (rxy) found is 0.347; while the r table (rtable)score in the
significant of 5% is 0.312. therefore, the correlation coeficient (rxy)= 0.347>r
table (rtable)= 0.312. it meant that a correlation exists between two variables. In
other words, there is significan correlation between students’ mastery of past
tense and writing past recount text.
words, the achievment in writing past recount text is influenced by12.04% of their mastery of past tense and87.96% was influenced by other aspects, for example writers’ knowledge, vocabulary mastery and so on.
Besides, the rxy can also interpreted with the table of “r” score
product moment(the table can be seen in the forth chapter or in Table 4.9). based on Table 4.9, the rxy score resulted in this study is 0.347. It places in the range of 0.20-0.399. It indicated that there is lowcorrelation between two variables (mastery of past tense and writing past recount text). Hence, it can be interpreted that the mastery of past tense has low correlation with their writing past recount text of eleventh grade srudents at SMA N 1 Kotawaringin lama. This is in accordance with Siti Istiqomah’s opinion thatas one of components of writing, grammar takes an important role in writing and clearly it effects one’s writing. The better one’s grammar mastery, the better his or her writing.2 Therefore, the students who have good grammar especially past tense, they must have good writing skill as well, particularly writing past recount text.
2
Istiqomah Siti, Journal ofCorrelation Betweem Grammar Mastery and Descriptive