on Member Firm Performance
Graham D. Fenwick
UNIVERSITY OFCANTERBURYCameron I. Wright
UNIVERSITY OFCANTERBURYCountry of origin (COO) effects on consumer purchasing processes have research investigates the effect of the Buy New Zealand-Made
been studied extensively, but the effectiveness of using this cue to encourage Campaign (BNZM) on performance of member firms over a
buying of domestically produced goods is poorly understood. The perfor- 6-year period from just prior to the campaign’s launch.
mance of firms belonging to the Buy New Zealand-Made Campaign over its first 5 years is compared with that of nonparticipating firms in four
industries. Annual sales and staff numbers changed over the period, but
COO Effects on Consumers
differences between campaign members and nonmembers within eachDespite the substantial academic attention given to COO
ef-industry were not significant. These findings are discussed in terms of
fects on consumer purchasing processes, it has yielded few
benefits to and attributes of member and nonmember firms and consumer
unequivocal generalizations for practical application in
mar-responses to buy-national campaigns. J BUSN RES2000. 47.135–145.
keting. Largely, this is because of methodological problems 1999 Elsevier Science Inc.
with several of the earlier studies (Bilkey and Nes, 1982; Ozsomer and Cavusgil, 1991), but considerable progress has been made following successive reviews and refocusing of research. Some key points on COO effects are summarized here.
T
he role of country of origin information in consumerThe image of products from some countries is very positive, decision processes has attracted intense interest from
but negative for others, and this image tends to extend across researchers (e.g. Bilkey and Nes, 1982; Wall, Liefeld,
products and product categories as stereotypes (Ozsomer and and Heslop, 1991; Ozsomer and Cavusgil, 1991; Peterson
Cavusgil, 1991; Wall, Liefeld, and Heslop, 1991; Lawrence, and Jolibert, 1995), and some workers identified practical
Marr, and Prendergast, 1992; Ahmed and d’Astous, 1995; implications of their findings (e.g. Ahmed and d’Astous,
Andaleeb, 1995; Chao and Gupta, 1995). These COO percep-1993). However, given the volume of research on this issue,
tions may change over time (Ozsomer and Cavusgil, 1991). there have been remarkably few attempts to apply this
knowl-Furthermore, it seems that COO product images usually are edge, perhaps because of the complex and confusing
relation-not influenced by nationalistic preferences of consumers, al-ship that has emerged between country of origin (COO)
infor-though such biases do exist for some industrial markets (Oz-mation and consumer decision processes. Among the more
somer and Cavusgil). Consumer nationality does affect prod-visible application of COO information are the buy-national
uct ratings, but these ratings do not necessarily reflect biases in campaigns established in the U.S.A., Canada, Germany,
Aus-favor of domestically produced products (Johansson, Douglas, tralia, and New Zealand. The extent to which these initiatives
and Nonaka, 1985; Papadopoulos, Heslop, and Beracs, 1990; were based on research findings or simply relied on some
Cattin, Jolibert, and Lohnes, 1982), contrary to earlier studies patriotic appeal is uncertain. A few studies sought to
under-(Reierson, 1966; Nagashima, 1970). Also notable is that, al-stand the effects of these campaigns in changing attitudes and
though consumers’ attitudes toward domestically produced behaviors of their target consumers, but none examined the
goods may be more positive (Dickerson, 1982; Wall and Hes-benefits accruing to firms sponsoring the campaigns. This
lop, 1986; Peris, Newman, Bigne, and Chansarkar, 1993), they may be negative (Johannson, Douglas, and Nonaka, 1985; Address correspondence to Dr. Graham D. Fenwick, Department of Manage- Kaynak and Cavusgil, 1983). Different demographic groups ment, University of Canterbury, Private Bag 4800, Christchurch, New Zealand.
E-mail: [email protected] may have quite different responses to COO cues (Lillis and
Journal of Business Research 47, 135–145 (2000)
1999 Elsevier Science Inc. All rights reserved. ISSN 0148-2963/00/$–see front matter
Narayama, 1974; Johansson, Douglas, and Nonaka, 1985;
Buy-National Campaigns
Lawrence, Marr, and Prendergast, 1992; Chao and Rajendran, Most buy-national campaigns are launched with the intention 1993). In some circumstances, normative influences, espe- of generating a patriotic bias for buyers to select domestically cially social pressures in specific market segments, may result manufactured goods, and, thus, increase the sales of domestic in COO becoming an important influence on consumer deci- goods relative to imported goods (Elliot and Cameron, 1994). sion-making (Ozsomer and Cavusgil, 1991). These campaigns are usually established and funded largely COO cues tend to have the greatest effect on product by the domestic manufacturing industries (e.g. the Made in evaluations for consumers with little or no product familiarity, the USA Campaign was sponsored by a group of U.S. textile where the COO cues serve as indicators of quality (Cattin, and apparel suppliers [Ettenson, Wagner, and Gaeth, 1988]), Jolibert, and Lohnes, 1982; Eroglu and Machliet, 1989; Elliot although some government assistance may be involved. Two and Cameron, 1994), and there is a positive relationship be- campaigns, the Buy Canadian and Buy Australian-Made, were tween perceived product quality and the economic develop- instigated by their respective governments (Ettenson, Wagner, ment of the COO (Gaedeke, 1973). Subsequent research indi- and Gaeth, 1998; Elliot and Cameron, 1994).
cates that COO cues are used more by consumers with higher The Buy New Zealand-Made (BNZM) Campaign was estab-lished jointly by the New Zealand Manufacturers Federation product familiarity. Together, these findings indicate that
(NZMF) and the New Zealand Council of Trade Unions with COO provides a halo from which consumers infer beliefs
no financial support from government. Its specific objective about unfamiliar products; whereas, country image
summa-is to “influence the attitudes and, therefore, the purchasing rizes consumers’ beliefs about product attributes for familiar
behaviour of mainstream New Zealanders to favour New products (Han, 1989; Mahesaran, 1994). Normally, the COO
Zealand made goods over foreign made goods” (Garland, cue is just one of many extrinsic product cues, and significant
Burra, and Newman, 1991, p.6). Initially, the Campaign was interaction with these other cues has been reported
(Johans-intended to protect domestic manufacturers from rapidly in-son, Douglas, and Nonaka, 1989; Thorelli, Lim, and Ye, 1989;
creasing imported goods following extensive deregulation of Ozsomer and Cavusgil, 1991). However, the effect of COO
New Zealand’s trade. The Campaign operates as a separate on consumer evaluations of product quality is greater than
entity within the umbrella of the NZMF. Its primary activities the effect of brand name for consumers in some countries
have involved various major national television advertising with some products, but the opposite is true for consumers
campaigns and promotions (over $NZ4 million by 1991) in other countries when considering the same products (Ahmed
aimed at encouraging consumers and industrial buyers to buy and d’Astous, 1993). The distinctive aspects of some COO
domestically manufactured goods (Buy New Zealand-Made images are generalized across product categories (Cattin,
Joli-Campaign, 1991). bert, and Lohnes, 1982). Closer examination revealed that
An academic investigation of the Campaign’s effect on gro-COO influences evaluations of specific product dimensions
cery shoppers found that 27% of consumers made a conscious rather than overall product ratings (Johansson, Douglas, and
effort to buy N.Z.-made items and carried this out by spending Nonaka, 1985; Strutton, True, and Rody, 1995) and that COO
significantly less on significantly fewer imported grocery items effects vary between dimesions of the same product. The
than other respondents (n 5 96, Garland and Coy, 1993). relative size of the effect of different cues varies between
Note, however, that consumers who reported consciously buy-dimensions of the same product (Ozsomer and Cavusgil, ing N.Z.-made bought fewer grocery items and spent less on
1991). groceries, on average, than did respondents making no such
decisions of most participants (n555) and that the impor- purchasing intentions, and purchasing behavior toward do-mestically produced goods, was generally inconclusive be-tance of “made in the USA” reported in previous studies was
cause of difficulties obtaining sufficiently large sample sizes probably “a consequence of participants wanting to respond
and/or because of problems associated with the extent to in a socially desirable manner” (Ettenson, Wagner, and Gaeth,
which attitudes and intentions translate into behavior. Given 1988). In an experimental approach with special reference to
the limited success of these studies and the intention of most the Buy Australian Campaign, Elliot and Cameron (1994)
buy-national campaigns to assist member firms, a different concluded that, although COO is generally of low importance
approach is taken here. This investigation examines the effect in the purchase decision process, its “effects generally and
of the BNZM Campaign on member firms using a pre–post, ‘Buy Local’ campaigns in particular, are indeed potentially
matched group design spanning prelaunch and the Cam-important influences on consumers’ purchase decision making
paign’s first 5 years. As such, this seems to be the first investiga-behaviour” (Elliot and Cameron, 1994, p. 59). A more recent
tion of the effects of a buy-national campaign on participating study considered consumer perceptions of “made in USA.”
businesses. This COO cue was found to be not important for consumers
The true test of a campaign is whether it imbues its partici-considering either simple, familiar or complex, unfamiliar
pants with a distinct advantage so that their performance products (Maronick, 1995). The study concluded that adding
increases over time relative to the performance of nonpartici-“made in USA” to an advertisement or label does not ensure
pants over the same period. Within a business, the possession more positive beliefs about a product or its quality (Maronick,
of competitive advantage is usually evident in profitability and 1995).
sales, although sales do not necessarily equate to profits. For Thus, the very little empirical evidence available on the
the purposes of this investigation, sales is a better and more effectiveness of buy-national campaigns is quite inconclusive.
immediate measure of the Campaign’s effectiveness than is Research on COO effects offers no clearer answers, suggesting
profitability, because numerous internal, company-specific that the effect of a buy-national campaign is likely to be small,
factors may intervene between sales revenues obtained and at best, and dependent upon the characteristics of the country
profits realized. Thus, sales is the primary dependent variable concerned and the segments targeted. Consequently, the
ex-of interest here and is operationalized as the percentage change pected effect of the BNZM Campaign during the late 1980s
in sales each year relative to the pre-Campaign (1987) sales. to early 1990s is uncertain. At that time, the New Zealand
Changes in employee numbers is a second dependent vari-manufacturing industry was emerging from a period of heavy
able included in this study, primarily because the Campaign government protectionism, which had induced a strong
pro-explicitly sought to influence national levels of unemployment duction focus within most sectors (Crocombe, Enright, and
(Campaign labels during this period read “ ‘BUY N.Z. MADE’ & Porter, 1991). New Zealand-made goods tended to be
rela-Keep Your Country Working”) (Buy New Zealand Made Cam-tively lower in quality than equivalent imported goods, with
paign, 1991) through members’ retention or acquisition of competition primarily on price (Crocombe, Enright, and
Por-staff. This assumes a generally positive relationship between ter, 1991; Wooding, 1993). Foreign-made goods were,
there-sales and employee numbers for firms within a given industry. fore, often preferred by consumers over their domestic
equiv-If successful, the Campaign would be expected to increase alents.
sales for member firms over the period of the Campaign, As a result of the increased availability of superior
foreign-which, in turn, would generate a need for retaining or acquir-made goods at increasingly competitive prices as tariffs were
ing more employees than in equivalent firms that do not progressively withdrawn and a logical consumer preference for
participate in the Campaign. It must be noted, however, that these, many domestic manufacturers faced major difficulties
employee numbers is expected to be a less sensitive and less adjusting to the new international competition within local
reliable indicator of the Campaign’s success because several markets. Many retrenched, and others failed (Hamilton and
internal, firm-specific factors are likely to intervene between Shergill, 1993). These retrenchments and failures within
man-sales and its need for employees. Thus, firms with similar ufacturing, along with major restructuring and a focus on
levels of sales within the same industry could, conceivably, increased efficiencies through the use of more technology and
have different numbers of employees, especially if their manu-increased labor productivity, caused substantial job losses and
facturing technologies differ appreciably. high unemployment (Statistics New Zealand, 1993; Hamilton
and Shergill, 1993; Clark and Williams, 1995) in the period leading up to the BNZM Campaign and during its early years.
Methodology
These problems were exacerbated by the 1987 share market
Table 2. Mean Staff Numbers for Buy NZ-Made Campaign Member
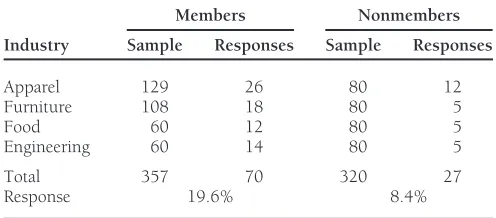
Table 1. Numbers of Buy NZ-Made Campaign Member and
Non-member Firms in Each Industry Sent Questionnaires and Returning and Nonmember Firms During the Study Period (t-values Corrected for Unequal Variances)
Completed Questionnaires
Members Nonmembers 1987 1992
Industry Sample Responses Sample Responses Membership Mean SD n Mean SD n
Members 45.86 99.29 61 41.22 72.39 70
Apparel 129 26 80 12
Furniture 108 18 80 5 Nonmembers 44.26 75.50 26 37.30 69.96 28
t5 2.07, dfs585, t5 2.25, dfs551.39,
Food 60 12 80 5
Engineering 60 14 80 5 p50.942 p50.805
Total 357 70 320 27
Response 19.6% 8.4%
were essentially identical (Chi-square50.005, dfs54,p,
0.99), but both differed significantly from the size frequency design was employed. Four industries with more than 50 firms of BNZM Campaign members overall (Chi-square5132.8– belonging to the Campaign were identified as appropriate for 133.2, dfs54,p,0.001). This difference was attributable examination (Table 1). A census of these firms was attempted to substantial under-representation of small (1–5 staff) firms giving a total treatment sample of 357 independent businesses. among BNZM Campaign members.
A further 320 firms among these four industries were selected
A total of 98 valid responses was received giving a response randomly from the NZMF database and included in the study
rate of 15% overall. However, small firms (1–9 staff) were as nonmember controls.
under-represented among respondents for both nonmembers A one page, self-administered questionnaire comprising
and members of the Campaign, compared with all NZ manu-nine questions was mailed to all firms. The mailing included
facturers (Chi-square5 210.0–223.0, dfs 5 4, p, 0.001) a reply-paid envelope, a nonpersonalized covering letter on
and NZMF members (Chi-square 5 209.9–224.2, Campaign letterhead signed by the Director of the Campaign
dfs54,p,0.001). In addition, although staff size frequency and an entry form for a prize draw offering $200 toward
distributions of all Campaign member firms and responding Campaign membership or merchandise. Concerns over the
member firms did not differ significantly (Chi-square58.61, confidentiality of responses raised during pretesting and
pre-dfs5 4,p5 0.07), there were conspicuously fewer smaller liminary discussions precluded numbering of questionnaires.
firms among respondents relative to the Campaign member-This meant that no follow-up mailings were possible. The
ship overall (30.5% cf. 40.1% of members overall). Thus, questionnaire requested numbers of employees, Campaign
not only were smaller firms under-represented within the membership, domestic sales, and promotional expenditure
Campaign generally, but they were also under-represented for the years 1987 (one year prior to the Campaign’s
com-among responding member (not at a statistically significant mencement) to 1992. To reduce sensitivity and maximize
level) and nonmember firms. response rates, the two potentially sensitive variables, annual
Size frequencies of member and nonmember respondents domestic sales and promotional expenditure, were requested
were equivalent (Chi-square 5 .345, dfs 5 1, p 5 0.56). as percentages of respondent’s 1987 values. Two simple
work-However, the average size of BNZM member respondents sheets, each clearly stating that these were not to be returned
was substantially (but not significantly) smaller than that of with the questionnaire, were included to ensure correct
calcu-nonmembers at both the beginning (t 5 5.97, dfs 5 23.8, lation of these two variables.
p5 0.340) and end (t 5 0.91, dfs5 26.2,p 5 0.371) of Thus, the study’s design enables examination of the effect
the period investigated. Closer examination of the data reveals of the Campaign on member firms by comparing 1987 and
that one large (.1,500 staff) nonmember respondent unduly 1992 figures for two dependent variables: percentage change
in domestic sales and change in numbers of staff. Investigation influenced these figures. Its removal produced essentially of concomitant changes in nonmember firms from the same equivalent mean sizes for responding and nonmember firms industries provide a control for unrelated changes in firms in (Table 2).
these industries over this period of economic change in New Together, these observations show that nonmember and
Zealand. member respondents were equivalent to each other in terms
of size frequencies and mean numbers of staff. They also show that both samples under-represented small firms compared
Results
with their parent populations. This effect may have been
over-Respondent Firms
come by matched elimination, but the consequent gains inrepresentativeness and external validity would not offset con-Staff size frequency distributions of NZMF members and all
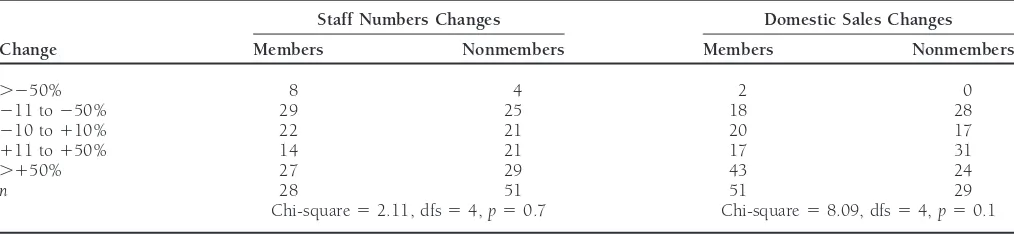
reduc-Table 3. Frequencies (%) of Different Sizes of Staff Changes and Domestic Sales for Campaign Member and Nonmember Firms During the Study Period
Staff Numbers Changes Domestic Sales Changes
Change Members Nonmembers Members Nonmembers
.250% 8 4 2 0
211 to250% 29 25 18 28
210 to110% 22 21 20 17
111 to150% 14 21 17 31
.150% 27 29 43 24
n 28 51 51 29
Chi-square52.11, dfs54,p50.7 Chi-square58.09, dfs54,p50.1
tion in the sample size. The implications of this under sam- Repetition of the above comparisons with outliers excluded results in no appreciable changes. For example, changes in pling of smaller firms are considered below.
staff numbers over the 5 years remained not significant for both members and non-members.
Overall Changes in Staff Number and
Whereas more member firms than nonmembers
experi-Domestic Sales
enced decreases in staff numbers, the trend was reversed for Staff numbers increased and decreased by more than 100%
domestic sales: decreases exceeding 10% were observed in in both representative member and nonmember firms over
more nonmembers (28%) than members (20%) (Table 3). the Campaign’s first 5 years (Table 3). More member firms
Domestic sales decreased by over 10% for relatively more (37%) than nonmember firms (29%) experienced decreases
nonmembers (28%) than members (20%). Similarly, relatively in staff exceeding 10%, and more nonmembers (50%) than
more members (43%) than nonmembers (24%) reported do-members (41%) experienced increases in staff numbers by
mestic sales increases of 50% or more. These differences be-more than 10% (Table 3). However, the frequencies of such
tween members and nonmembers are not statistically signifi-changes were not significantly different between members and
cant and there are no consistent trends. nonmembers over the period.
The most common reasons given for changes in staff num-Staff numbers over this initial period of the Campaign
bers were increases/decreases in sales (including exports), in-increased for 49% of respondent firms, decreased for 39%,
creased imports, the economy, and increased efficiency (Table and remained unchanged for the other 12%. Mean sizes and
4). Marketing, quality/service focus, and product development variation of both groups decreased during the period. The
were the most frequently cited reasons for increased domestic mean size of nonmember firms decreased more dramatically
sales; whereas, the economy and increased imports were most than for member firms (Table 2), but these changes were
commonly perceived as the causes of decreased domestic sales. not significant (members: t 5 0.52, dfs5 60, p 5 0.603;
Notable among these is that the economy was believed respon-nonmembers:t51.13, dfs525,p50.269). These decreases
sible for both increases and decreases in staff numbers and in mean sizes were attributable to reductions in numbers of
sales. Also notable is that reasons given for increases in sales staff and not to any large firms withdrawing from the
Cam-were marketing-related; whereas, those given for decreased paign; the only respondent firms to discontinue membership
sales suggest an inability to adjust to the new marketing envi-were five that each joined for only 1 of the intervening years.
ronment postderegulation. Mean changes convey little, because of the very wide range
of these changes reported: staff number changes, 2100 to
Industry-Specific Changes
1400%; domestics sales,277 to 2900%. Much of this
varia-tion is attributable to just three firms, with variavaria-tion of most Further analysis was confined to correlation analysis andt-tests because of the relatively small sample sizes, the uneven distri-firms within a narrower range. Thus, these three outliers were
removed from subsequent analysis, because their extreme bution of firms among the industry-Campaign membership treatments and the unequal variances of the different groups. growth in staff numbers and domestic sales unduly influenced
the results. These outliers grew from start-up operations com- There were no correlations between the independent variables (except the highly significant correlation between membership prising 1–2 staff in 1987 to firms of 6–16 staff by 1992. Two
of these firms were food manufacturers and the other an and number of years as a member [Chi-square 5 78.62, dfs5 5,p , 0.001]), and neither industry nor Campaign apparel manufacturer. Thus, they differed substantially from
Table 4. Frequencies (%) of Reasons Given for Changes in Staff Numbers and Domestic Sales for Responding Firms
Staff Numbers Domestic Sales
Reason Increases Decreases Increases Decreases
Increased sales 57 Increased exports 20 Firm expansion 14
The economy 12 26 19 48
Increased imports 8 29 48
Vertical integration 6
Decreased sales 24
Increased efficiency 18
Marketing 40
Quality and service focus 21
Product development 18
Buy NZ-Made Campaign 11
Decreased demand 29
Other 61 53 69 39
n 49 38 62 31
lated with each other (r 5 0.495,n5 80, p, 0.001) and bers and nonmembers prior to the Campaign (M13N1); (2) differences between members and nonmembers in 1992 after with change in domestic promotion (sales change: r50.282,
n 5 74, p5 0.015; staff change: r 5 0.518, n 5 68, p, the Campaign had run for 5 years (M23N2).
In all industries, there were appreciable differences in mean 0.001).
The effect of the Campaign on staff numbers for firms in numbers of staff between member and nonmember firms prior to the Campaign’s commencement (Table 5). However, these each industry over its first 5 years was examined by comparing:
(1) changes in staff numbers experienced by members and differences were not significant (t-test corrected for unequal variances as needed,p50.332.72), except for the furniture nonmembers (M25M13N22N1); and (2) changes in mean
sizes within each group (members and nonmembers) over the sector (t5 22.65, dfs516.88,p50.017), largely because of the wide variation within each group (Table 5), despite the time of the Campaign (M13 M2; N13 N2). Two additional
comparisons served as controls: (1) differences between mem- exclusion of three outliers. Similarly, the only sector exhibiting
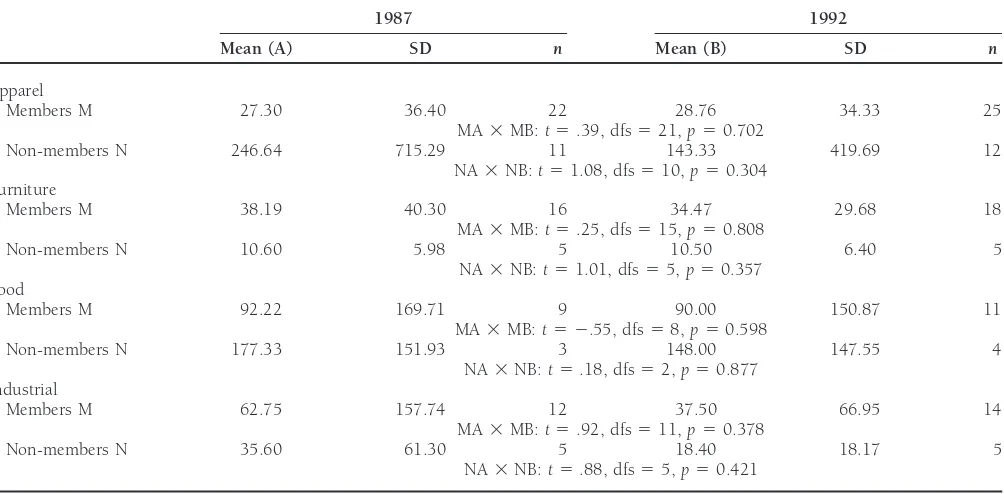
Table 5. Comparisons of Staff Numbers for Members and Nonmembers at the Beginning and End of the Period Investigated
1987 1992
Mean (A) SD n Mean (B) SD n
Apparel
Members M 27.30 36.40 22 28.76 34.33 25
MA3MB:t5.39, dfs521,p50.702
Non-members N 246.64 715.29 11 143.33 419.69 12 NA3NB:t51.08, dfs510,p50.304
Furniture
Members M 38.19 40.30 16 34.47 29.68 18
MA3MB:t5.25, dfs515,p50.808
Non-members N 10.60 5.98 5 10.50 6.40 5
NA3NB:t51.01, dfs55,p50.357 Food
Members M 92.22 169.71 9 90.00 150.87 11
MA3MB:t5 2.55, dfs58,p50.598
Non-members N 177.33 151.93 3 148.00 147.55 4
NA3NB:t5.18, dfs52,p50.877 Industrial
Members M 62.75 157.74 12 37.50 66.95 14
MA3MB:t5.92, dfs511,p50.378
Non-members N 35.60 61.30 5 18.40 18.17 5
NA3NB:t5.88, dfs55,p50.421
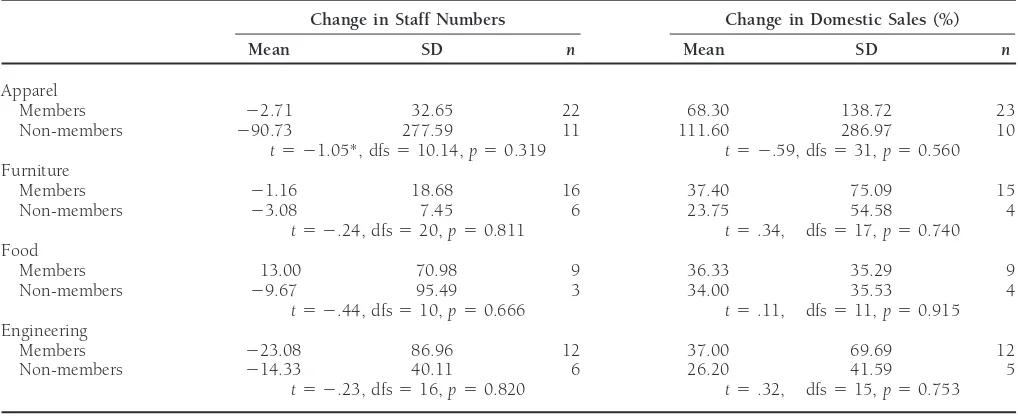
Table 6. Mean Changes in Staff Numbers and Domestic Sales (%) for Member and Nonmember Firms in Each Industry Over the Period 1987–1992
Change in Staff Numbers Change in Domestic Sales (%)
Mean SD n Mean SD n
Apparel
Members 22.71 32.65 22 68.30 138.72 23
Non-members 290.73 277.59 11 111.60 286.97 10
t5 21.05*, dfs510.14,p50.319 t5 2.59, dfs531,p50.560 Furniture
Members 21.16 18.68 16 37.40 75.09 15
Non-members 23.08 7.45 6 23.75 54.58 4
t5 2.24, dfs520,p50.811 t5.34, dfs517,p50.740 Food
Members 13.00 70.98 9 36.33 35.29 9
Non-members 29.67 95.49 3 34.00 35.53 4
t5 2.44, dfs510,p50.666 t5.11, dfs511,p50.915 Engineering
Members 223.08 86.96 12 37.00 69.69 12
Non-members 214.33 40.11 6 26.20 41.59 5
t5 2.23, dfs516,p50.820 t5.32, dfs515,p50.753
* test corrected for unequal variances.
significant differences between members and nonmembers in whether this increased response rate among members was attributable to their membership itself or to the predominance 1992 was furniture (t 5 23.17, dfs 5 20.70,p 5 0.005).
Thus, furniture was the only sector in which staff numbers of larger firms among members relative to nonmembers. Cam-paign members were more likely to respond than nonmembers differed with membership, indicating that any significant effect
of membership observed for firms in this sector could equally because of their direct interest and financial stake in the Cam-paign. Nonmembers had already rejected the Campaign as a be attributable to size differences.
Staff numbers over the period investigated decreased for worthwhile opportunity for their own business and, thus, had no incentive to respond. On the other hand, larger firms, both members and nonmembers of all sectors (except
Cam-paign members within the apparel industry). However, al- which were more frequent among members, probably respond to such surveys more readily than smaller firms, because the though these changes over time were large in many cases, none
was significant. Comparing changes in mean staff numbers for relative effort required to handle these enquires is insignificant for large firms, but more significant for small firms.
members and nonmembers over the period (Table 6) revealed
no significant effect of membership here also. Replication of Overall, these data indicate no significant effect of the Buy these analyses using firms that had belonged to the Campaign New Zealand-Made Campaign on member firms in terms of for 2 or more years only yielded some differences in mean the Campaign’s stated objective of retaining employees in values, but consistently nonsignificantt-values. Thus, mem- manufacturing, nor in terms of increasing domestic sales of bership in the Campaign had no significant effect on staff members relative to those of nonmembers. There is, however, numbers for firms in these sectors of manufacturing over the limited, nonsignificant evidence to suggest that the Campaign first 5 years of the Buy New Zealand-Made Campaign. did have benefits for members that may have been statistically Equivalent tests on changes in domestic sales are not possi- significant with larger samples to overcome the effects of high ble, because this variable was measured as percentage changes variation among responding firms. The overall mean size of only. Differences in mean percentage changes within each member firms decreased (10.1%) substantially less than the sector over the time period were not significant (Table 6). It concomitant decrease in mean size of nonmember firms is, however, notable that, although not significant, all changes (15.7%). More nonmembers (28%) than members (20%) ex-were positive and that these increases ex-were greater for mem- perienced decreases in domestic sales, and more members bers than for nonmembers in three of the four manufacturing (43%) than nonmembers (24%) achieved domestic sales in-sectors (Table 6). creases exceeding 50% of 1987 sales by 1992. Mean decreases in staff numbers were more severe for nonmembers in three sectors and increases in domestic sales were greater for
mem-Discussion
bers in three sectors.The full extent of these and other positive changes conceiv-The 15% response rate to this survey was low, but members
obscured by the undersampling of small firms (1–9 staff), notion that consumers would play an important role in max-imizing employment and enhancing national economic condi-which are often young and growing, for two reasons. First,
small firms’ brands are usually poorly known compared with tions by buying domestically made products and, thus, benefit personally in the medium term.
those of larger firms manufacturing equivalent products,
be-cause of the disparities in firms’ promotional efforts. COO Peterson and Jolibert (1995) concluded from their meta-analysis that the COO effect was “somewhat generalizable,” labeling, therefore, seems likely to have the greatest effect on
unfamiliar brands, simply because it adds a patriotic appeal because the COO cue explains a considerable amount of the variance in perceptions of product quality/reliability (30% on to enhance the brand’s attractiveness (Cordell, 1992). Second,
the small increments in sales or additions of just one or two average) and a lesser amount (19% on average) of the variance in purchase intentions. Drawing on prior consumer behavior staff anticipated by the Campaign (e.g., Buy New
Zealand-Made Campaign, 1991), would add substantially to a small research, they believed that “the impact of an informational cue will be less when the required response implies a greater firm, but little to a larger firm, especially when these absolute
increments are reported as percentages. Consequently, this degree of personal commitment or is somewhat removed from a direct evaluation of the underlying stimulus” (Peterson and study’s undersampling of small firms probably means that
the Campaign’s effectiveness is underestimated, because these Jolibert p. 895). In other words, a quality/reliability judgment implies considerably less commitment than does a purchase smaller firms were probably those most sensitive to the
Cam-paign’s activities. intention so that consumers will be more willing to be positive about quality/reliability than about their intention to purchase Although it is tempting to suggest that such benefits would
be statistically significant given larger samples, it is debatable the product. Also, a purchase intention is likely to involve more intervening variables, so COO cues are likely to be better whether these benefits are attributable to membership per se,
or to some underlying factors that are manifested, in part, at explaining variance in quality/reliability judgments than variance in purchase intentions. Examining the relationship through the act of joining the BNZM Campaign. Indeed, there
is some evidence suggesting that member firms are more between the Campaign and firm performance is, in effect, extending this logic two steps beyond purchase intention. marketing focused and less product/production focused than
nonmember firms: most member firms gave eight marketing Additional intervening variables would be expected when ac-tual purchases are considered as the dependent variable and activity-related reasons for changes in their staff numbers
(74.0%) and domestic sales (77.8%); whereas, fewer nonmem- another set of intervening variables will be important in de-termining the effect that COO cues have on firm performance. bers attributed their changes in these variables to just three
marketing-related factors (43.4% and 47.7% respectively). On this basis then, the COO effect is likely to explain even less of the variance in actual purchases than it does for either Thus, the Campaign may have attracted firms that were better
marketers and would perform better than average for their purchase intentions or quality/reliability evaluations and ex-plain very little of the variance in performance of member industries, regardless of the Campaign.
There is scant information on the effectiveness of buy- firms relative to nonmember firms.
Members included several large national firms and multina-national campaigns. In the most rigorous study, Ettenson,
Wagner, and Gaeth (1988) concluded that the Made in the tional firms (e.g., 12 of the 60 food industry Campaign mem-bers were national firms, including five New Zealand divisions USA Campaign had not resulted in any significant increase
in purchasing of US-made apparel. Thus, they concluded that of multinationals), as well as small, local operators. This diver-sity of firms among members almost certainly masked effects retailers should use patriotic themes in promotion with
cau-tion (Ettenson, Wagner, and Gaeth). Liefeld (1991) reported of the Campaign, because of the interaction between brand reputation and perceived quality/performance risk observed that neither the Made in the USA nor the Buy Canadian
Campaigns had produced any significant increases in sales of by Cordell (1992). Conceivably, Campaign membership did not affect sales or employee numbers for firms with well-domestically manufactured goods. The present study,
there-fore, reiterates Ettenson, Wagner, and Gaeth’s conclusion that established brands, but had a more marked effect for firms with unfamiliar brands (Cordell). Extrapolating Cordell’s find-the benefits of patriotic find-themes in promotion are uncertain.
The lack of any significant effect of Campaign membership ings, the Campaign’s effect on an unfamiliar brand will depend upon the consumer’s perception of New Zealand manufactur-on firm performance can be cmanufactur-onsidered in light of research
on COO effects on consumer behavior. The Campaign sought ers as producers of quality for that product category. That is, if consumers regard New Zealand-made honey, for example, to improve the performance of member firms by means of
changing aspects of consumers’ purchasing behavior. Specifi- as being high quality, then COO labeling should enhance consumers’ perceptions of an unfamiliar brand of New Zealand cally, the Campaign sought to increase awareness of COO
as a purchase decision-making criterion and to increase the honey. On the other hand, COO labeling of an unfamiliar brand may increase its perceived performance risk if New importance of this to consumers personally by establishing a
in all four industries examined here. Because New Zealand’s to the campaign, such campaigns must be viewed more as altruism and not providing any competitive advantage over reputation for products in each sector was not evaluated here,
the effects of the Campaign on unfamiliar and well-known other domestic producers.
In some respects, buy-national campaigns resemble cause-brands probably cancelled each other. Thus, the positive
ef-fects of the Campaign on unfamiliar brands of product catego- related marketing activities (Varadarajan and Menon, 1988), but there are also some important differences. Typically, ries for which New Zealand was known were probably
ob-scured by the negative effects of the Campaign’s COO labeling cause-related marketing campaigns identify a specific, credi-ble cause and specifically designate how the firm will help of brands of products for which New Zealand manufacturers
have a poor reputation. the cause each time the consumer purchases/uses the product/ service. In the case of buy-national campaigns, the cause is Another reason for this study’s failure to find any
statisti-cally significant effect of the BNZM Campaign on member usually clearly identitifed, but the link between the consumer’s actions toward the firm and assisting the cause is less obvious firm performance is the possibility that both member and
nonmember firms benefited similarly. The Campaign may and less convincing. In the BNZM Campaign, the cause is implicit within the slogan (“BUY N. Z. MADE” & Keep Your have been successful in raising consumers’ awareness of the
COO and in increasing the importance of this criterion in Country Working), but may not be obvious to all consumers. Although commercial research reported high acceptance (76– their purchase decision-making. However, the Campaign did
little to benefit members directly, other than licensing them 86%) of the buy-national-unemployment relationship, the ex-tent to which consumers actually believe that their personal to use the BNZM logo in their labeling and promoting the
logo. Individual firms used their discretion in package design contribution is important and, thus, practice selection of do-mestically made products, is markedly lower (e.g., 27% for and in the location of any BNZM logos (minimum size 19-mm
vertical height) included in their labeling. Thus, any benefits groceries [Garland and Coy, 1993]). The link between unem-ployment and increasing imports is not simple. Much of the from the Campaign may have been shared reasonably equally
by members and nonmembers alike. increased unemployment at that time resulted from major restructuring of primary industries as international markets Perhaps more importantly, Garland and Coy’s (1993) study
indicated that the Campaign did not convert the majority of were transformed and as new technologies were introduced. On the other hand, increased imports were attributable to grocery shoppers to focusing on New Zealand made goods,
despite a high awareness (c. 70%) and high correct recall increased demand for luxury items (e.g., cars, televisions, videos) or for components required for manufacturing for (60%) for the Campaign (Garland, Burra, and Newman,
1991). The study found that only 27% of a sample (n596) which there were no domestic manufacturers. In reality, con-sumers may not see the cause in a buy-national campaign of of consumers claimed to buy New Zealand-made groceries
consciously, but that this group bought significantly fewer this type as distinct from the firm; whereas, the firm and the cause are usually very different types of organizations involved imported grocery items than those respondents who claimed
not to consider the COO of groceries (Garland and Coy, in quite different activities in most cause-related marketing campaigns. The Buy Canadian and Buy Australian-Made Cam-1993). If this grocery shopping study indicates the extent to
which consumers buy New Zealand-made products for the paigns were both initiated and funded by their respective governments (Liefeld, 1991; Elliot and Cameron, 1994). The industries considered here, then the lack of any significantly
enhanced performance for member firms is not unexpected. BNZM Campaign differed in that it was run by the NZMF, an entity representing the interests of large and small manufac-Given the likely dilution effects of these four factors, the
better performance of Campaign members observed here takes turers in New Zealand. In this respect, it is similar to the Made in the USA Campaign, which was sponsored by a coalition of on greater importance, although not statistically significant.
Members do seem to perform better than nonmembers in all 245 U.S. textile and apparel suppliers (Ettenson, Wagner, and Gaeth, 1988). Perhaps buy-national campaigns would be more industries except apparel. This previously heavily protected
industry was hit particularly hard by competition from coun- successful if they were modeled on successful cause-related marketing campaigns: the cause itself should be more distinct tries with low labor costs during the period of the study, and
the findings suggest that severe staff cutting was the best route from the contributing firms to minimize the extent to which such campaigns can be perceived as self-serving, rather than to survival. The question over whether the observed effect
was a result of the Campaign or attributable more to the firms truly cause-oriented, and contributions from sponsoring (member) firms should be specified and tied closely to vol-themselves, which, for unknown reasons, were predisposed
to join the Campaign, remains unknown. However, it seems umes purchased by consumers. that any buy-national campaign is unlikely to bestow benefits
specifically on its member firms because nonmember firms
References
seem destined to reap some benefits coincidentally. Unless Ahmed, S. A., and d’Astous, A.: Cross-National Evaluation of Made-in there is some mechanism for members to benefit directly from Concept Using Multiple Cues. European Journal of Marketing
Ahmed, S. A., and d’Astous, A.: Comparison of Country-of-Origin of Country-of-Origin on Product Evaluations: A New Method-ological Perspective.Journal of Marketing Research22 (November Effects on Household and Organizational Buyers’ Product
Per-ceptions.European Journal of Marketing29 (1995): 35–51. 1985): 388–396.
Andaleeb, S. S.: Country-of-Origin Effects: A Country-Category Effect Kaynak, E., and Cavusgil, T.: Consumer Attitudes Toward Products Hypothesis.Journal of International Consumer Marketing7 (1995): of Foreign Origin: Do They Vary across Product Classes?
Interna-29–52. tional Journal of Advertising2 (1983): 147–157.
Bilkey, W. J. and Nes, E.: Country-of-Origin Effects on Product Lawrence, C., Marr, N. E., and Prendergast, G. P.: Country-of-Origin Evaluation.Journal of International Business Studies 13 (Spring/ Stereotyping: A Case Study in the New Zealand Vehicle Industry. Summer 1982): 89–99. European Journal of Marketing26 (1992): 37–51.
Buy New Zealand-Made Campaign:1991 Campaign Information,Buy Lee, H., Kim, C., and Miller J.: The Relative Effects of Price, Warranty, New Zealand-Made Campaign, NZ Manufacturers Federation, and Country-of-Origin on Consumer Product Evaluations.
Jour-Wellington, NZ. 1991. nal of Global Marketing6 (1992): 55–80.
Cattin, P. J., Jolibert, A. J. R., and Lohnes, C.: A Cross-Cultural Study Liefeld, J. P.: Canadian Food Consumption Patterns.Proceedings of
of “Made in” Concepts.Journal of International Business Studies13 the New Zealand Institute of Food Science and Technology Conference
(Winter 1982): 131–141. 1991.1991, pp. 9–33.
Cedrone, L.: Does It Matter if It Matters? Bobbin (August 1991): Lillis, C. M., and Narayama, C. L.: Analysis of “Made in” Product 45–52. Images—An Exploratory Study.Journal of International Business
Studies5 (Spring 1974): 119–127. Chao, P., and Gupta, P. B.: Information Search and Efficiency of
Consumer Choices of New Cars: Country-of-Origin Effects.Inter- Lim, J.-S., Darley, W. K., and Summers, J. O.: An Assessment of
national Marketing Review12 (1995): 47–59. Country-of-Origin Effects Under Alternative Presentation For-mats.Journal of the Academy of Marketing Science 22 (Summer Chao, P., and Rajendran, K. N.: Consumer Profiles and Perceptions:
1994): 274–282. Country-of-Origin Effects. International Marketing Review 10
(1993): 22–39. Mahesaran, D.: Country-of-Origin as a Stereotype: Effects of Con-sumer Expertise and Attribute Strength on Product Evaluations. Clark, M. S., and Williams, A.:New Zealand’s Future in the Global
Journal of Consumer Research21 (September 1994): 354–365.
Environment? A Case Study of a Nation in Transition,New Zealand
Employers’ Federation Inc. in association with GP Publications, Maronick, T. J.: An Empirical Investigation of Consumer Perceptions Wellington, NZ. 1995. of “Made in USA” Claims. International Marketing Review 12
(1995): 15–30. Cordell, V. V.: Effects of Consumer Preferences for Foreign Sourced
Products.Journal of International Business Studies23 (1992): 251– Nagashima, A.: A Comparison of Japanese and U.S. Attitudes toward 269. Foreign Products.Journal of Marketing43 (January 1970): 68–74. Crocombe, G. T., Enright, M. J., and Porter, M. E.:Upgrading New Okechuku, C.: The Importance of Product Country-of-Origin: A
Zealand’s Competitive Advantage,Oxford University Press, Auck- Conjoint Analysis of the United States, Canada, Germany, and land, NZ. 1991. The Netherlands.European Journal of Marketing28 (1994) 5-19. Dickerson, K.: Imported versus U.S.-Produced Apparel: Consumer Ozsomer, A., and Cavusgil, S. T.: Country-of-Origin Effects on
Prod-Views and Buying Patterns.Home Economics Research Journal10 uct Evaluations: A Sequel to Bilkey and Nes Review, in 1991
(March 1982): 241–252. AMA Educators’ Proceedings: Enhancing Knowledge Development in Marketing,M. C. Gilly, et al., eds., American Marketing Associa-Elliott, G. R., and Cameron, R. D.: Consumer Perception of Product
tion, Chicago, IL. 1991, p. 269–277. Quality and the Country-of-Origin Effect.Journal of International
Marketing2 (1994): 49–62. Papadopoulos, N., Heslop, L. A., and Beracs, J.: National Stereotypes and Product Evaluations in a Socialist Country.International
Mar-Eroglu, S. A., and Machleit, K. A.: Effects of Individual and
Product-keting Review7 (1990): 32–47. Specific Variables on Utilizing Country of Origin as a Product
Quality Cue.International Marketing Review6 (1989): 27–41. Peris, S. M., Newman, R., Bigne, E., and Chansarkar, B.: Aspects of Anglo-Spanish Perceptions and Product Preferences Arising from Ettenson, R., Wagner, J., and Gaeth, G.: Evaluating the Effect of
“Country-of-Origin” Image.International Journal of Advertising12 Country of Origin and the “Made in the USA” Campaign: A
(1993): 131–142. Conjoint Approach.Journal of Retailing64 (Spring 1988): 85–100.
Peterson, R. A., and Jolibert, A. J. P.: A Meta-Analysis of Country-of-Gaedeke, R.: Consumer Attitudes Toward Products “Made in”
Devel-Origin Effects.Journal of International Business Studies26 (Fourth oping Countries.Journal of Retailing49 (Summer 1973): 13–24.
Quarter 1995): 883–900. Garland, R., Burra, L., and Newman, E.:New Zealanders’ Attitudes
Reierson, C. C.: Are Foreign Products Seen as National Stereotypes?
to the “Buy New Zealand Made” Campaign.Unpublished report,
Journal of Retailing42 (Fall 1966): 33–40. 1991.
Sheehy, J.: Crafted with Pride: The Message Hits Home.Textile World
Garland, R., and Coy, D.: Buying New Zealand-Made Groceries:
138 (December 1988): 86–88. Does Behavior Match Attitude?New Zealand Journal of Business
15 (1993): 1–18. Showers, V. E., and Showers, L. S.: The Effects of Alternative Measures of Country-of-Origin on Objective Product Quality.International
Hamilton, R. T., and Shergill, G. S.:The Logic of New Zealand Business:
Marketing Review10 (1993): 53–67.
Strategy, Structure, and Performance, Oxford University Press,
Auckland, NZ. 1993. Statistics New Zealand:Household Labour Force Survey, Statistics New Zealand, Wellington, NZ. 1993.
Han, C. M.: Country Image: Halo or Summary Construct?Journal
Country-of-Origin Stereotypes with Implications for Promotions Made versus Imported Products.Journal of the Academy of Market-ing Science14 (Summer 1986): 27–36.
and Positioning.Journal of Marketing Theory and Practice3
(Sum-mer 1995): 76–87. Wall, M., Liefeld, J., and Heslop, L. A.: Impact of Country-of-Origin Thorelli, H. B., Lim, J., and Ye, J.: Relative Importance of Origin, Cues on Consumer Judgments in Multicue Situations: A Covari-Warranty, and Retail Store Image on Product Evaluations.Interna- ance Analysis. Journal of the Academy of Marketing Science 19
tional Marketing Review6 (1989): 35–46. (Spring 1991): 105–113.
Varadarajan, P. R., and Menon, A.: Cause-Related Marketing: A Coa- Wooding, P.: New Zealand in the International Economy, inState lignment of Marketing Strategy and Corporate Philanthropy.Jour- and Economy in New Zealand,Brian Roper and Chris Rudd, eds., nal of Marketing52 (July 1988): 58–74. Oxford Readings in New Zealand Politics: No. 2,Oxford University