OIL SPILL DETECTION AND MONITORING OF ABU DHABI COASTAL ZONE USING
KOMPSAT-5 SAR IMAGERY
Commission VIII, WG VIII/9
KEYWORDS: Remote Sensing, Oil Spill Detection.,KOMPSAT-5, Abu Dhabi
ABSTRACT:
Abu Dhabi Government endorsed vision for itsMaritime Strategy ‘A safe, secure and sustainable maritime domain for Abu Dhabi’. This research study share this vision using the concept of monitoring as tool for marine protection against any possible oil pollution. The best technology to detect and monitor oil pollution and in particularly oil spill is SAR imagery In this case study we chose KOMPSAT-5 SAR.
KOMPSAT-5 carries X-band SAR for earth observation, and is capable of day-and-night imaging under all weather condition. It provides three operation modes: High Resolution Mode to provide 1 m resolution, Standard Mode to provide 3 m resolution and Wide Swath Mode to provide 20 m resolution with 100 km swath at 550 km altitude, with four modes of polarization. KOMPSAT-5 provides products for various applications; security and defense, mapping, and natural resource management, environmental monitoring, disaster monitoring and more. For our case study we chose to work with Wide Swath mode (WS) with Vertical polarization (VV) to cover a wide area of interest located to the north west of Abu Dhabi including some important islands like ”Zirku Island”, and areas with oilproduction activities.
The results of data acquired on 4thMay 2015 show some spot of oil spill with length estimated about 3 KM, and the daily satellite data acquisition over the period July 24 through July 31 shows serious and many oil spill events some are small, but many others are considered to be big with area size around 20 km2.
H. A. Harahsheha
aGlobal Scan Technologies LLC
In the context of oil spill pollution in the seas, we have to consider the development and increase of overseas transportation, which is an important factor for both social and economic sectors. The harmful effects of marine pollution are numerous, from the damage of marine life to the damage of the aquatic ecosystem as whole. As such, the need for oil slick detection is crucial, for the location of polluted areas and to evaluate slick drift to protect the coastline. Satellite-based oil spill monitoring system now can be used to take precautions and even to determine the possible polluter; it has a vital importance on the detection and protection of national and
Figure 1: Study area
1. INTRODUCTION
In the context of oil spill pollution in the seas, we have to consider the development and increase of overseas transportation, which is an important factor for both social and economic sectors. The harmful effects of marine pollution are numerous, from the damage of marine life to the damage of the aquatic ecosystem as whole. As such, the need for oil slick detection is crucial, for the location of polluted areas and to evaluate slick drift to protect the coastline. Satellite-based oil spill monitoring system now can be used to take precautions and even to determine the possible polluter; it has a vital importance on the detection and protection of national and international waters from the possible damages of petroleum hazard.
Although there is an international trend toward decreasing the numabr and amount of oil spill [3], the influx of oil from tankers and offshore oil operations are serious and consitue major causes of pollution in the marine environment. Environmental. The International tanker Owners Pollution Federation (ITOPF) maintains a database of oil spills from tankers, combined carriers and barges. This contains information on accidental spillages since 1970, except those resulting from acts of war. The data held includes the type of oil spilt, the spill amount, the cause and location of the incident and the vessel involved. For historical reasons, spills are generally categorised by size, <7 tonnes, 7-700 tonnes and >700 tonnes. Information is now held on nearly 10,000 incidents, the vast majority of which (81%) fall into the smallest category i.e. <7 tonnes. When looking at the frequency and quantities of oil spilt, it should be noted that a few very large spills are responsible for a high percentage of oil spilt. Over the last two and a half decades, the average number of spills greater than 7 tonnes has progressively reduced by half. In terms of the volume of oil spilt, the figures for a particular year may be severely distorted by a single large incident [10].
The marine environment in the Arabian Gulf region is also under considerable threat from intentional or accidental oil spills, ballast water discharged, dredging and infilling for coastal development, and uncontrolled sewage and industrial wastewater discharges. Oil discharged from ships imposes a much great long-term threat to the marine environment than one big accident. Monitoring illegal oil discharges is thus an important component in ensuring compliance with marine protection legislation and general protection of the coastal environments. There have already been several remarkable accidents involving the loss of large quantities of crude oil from disabled tankers [5].
In the last 20 years, the satellites-borne SAR sensors have been broadly used for oil spill monitoring and have provided excellent data. Their advantages are the capability of wide coverage under any weather conditions all day long, the near real time data delivery and the improved cost-efficiency when compared with airborne SAR surveillance. Some very successful examples of ERS SAR applications in marine oil spill detection have been reported, such as the near-real-time monitoring in Norway [4], monitoring oil spill pollution with ERS SAR in the Mediterranean [20] and the conviction in an oil-spill case in Singapore [13].
The research studies on the use of SAR images on the Arabian Gulf are few, and there is no single study demonstrate the daily capability of monitoring based on high resolution SAR satellite images, this present study consitue the first time of such daily monitoring of oil spill, we should recognize the high
performance of KOMPSAT-5 to achieve such objective. We selected a pilot area, where there is an intensive oil production and related ship movment.
2. STUDY AREA
The study area (Figure 1) lies between longitude 52o20’ E and 54o4’E, and latitudes 24o30’N and 25o36’N, which covers part of the north west zone of Abu Dhabi
Island . The dimension is about 160 km in length and about 120 km in width, it is a shallow sea water from few meters to around 50m. Evaporation and wind are major driving forces of water circulation in the Arabian Gulf.
The Arabian Gulf region is the largest offshore oil development area in the world. Bahrain, Iran, Iraq, Kuwait, Qatar, Saudi Arabia, and the United Arab Emirates(UAE) produced over 27% of the world’s oil in 2000. The area also holds 65% of the world’s oilreserves. The oil sludge, released by tankers cruising in the Arabian Gulf is estimated to be around 8 million metric tons per year, representing 60 % of the total pollution in the area. Oil of about 16 million barrels per day is transported through the strait of Hormuz. Contamination influx is mainly from tankers releasing ballast, tank cleaning leakage from drilling rigs and production platforms, and ship accidents.
3. DATA SET
The best technology to detect and monitor oil pollution and in particularly oil spill is “Syntactic Aperture Radar-SAR”. In this case study we chose KOMPSAT-5 SAR images (KOrea Multi-Purpose SATellite). KOMPSAT-5 mission objectives are the provision of SAR images for GIS applications to support the Korean national environment and disaster monitoring System. KOMPSAT-5 SAR carries X-band synthetic aperture radar (SAR) for earth observation, and is capable of day-and-night imaging under all weather condition. All data are provided and supported by the Korea Aerospace Research Institude and its services organ the SI Imaging services co. ltd. Kompsat 5 provides three operation modes[11]:
1. High Resolution Mode (spotlight mode) to provide 1 m resolution with 5 km by 5 km swath,
2. Standard Mode (strip mode) to provide 3 m resolution with 30 km swath and
3. Wide Swath Mode (ScanSAR mode) to provide 20 m resolution with 100 km swath at 550 km altitude, KOMPSAT-5 provides products for various applications such as security and defense, image interpretation, mapping, land and natural resource management, environmental monitoring, disaster monitoring and more.
better image uniformity, in our case study the range resolution is about 7.5 m.
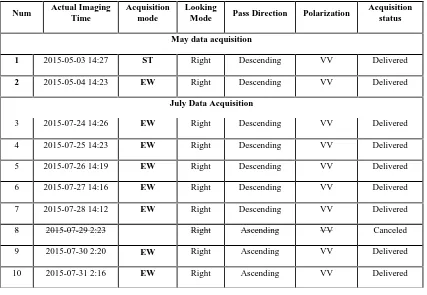
The first set of data acquired on 3rd and 4th May 2015, on standard swath mode and Enhanced wide swath mode and with 1m and 7.5m resolution respectively. The second set of data acquired on the period of July 24th through July 31 in daily basis, except imaging scheduled in 29this canceled due to orbit maintenance, these data all acquired on wide swath mode and delivered with 7.5m resolution. The table 1 shows the list of these data.
The weather conditions on May 3rd are not favorable to recognize well the oil spill. The wind speed is about 2m/s and this will show the calm water as dark surface, so we decided not to continue the analysis of this data set on May 3rd.
4. IMAGES PREPROCESSING AND PRODUCT
LEVEL
SAR Standard product consists of SAR signal data or SAR image (originated by standard processing of the signal data) distributed on magnetic, optical or electronic media. The standard processing of the KOMPSAT-5 SAR data has been thought to be as much as possible aligned with the definition deriving from literature. The KOMPSAT-5 SAR processors implement four levels of standard processing (from 0 up to level 1D), which a specific output product corresponds to [11].
For the purposes of this study, level 1C were applied to the acquired data, which is detected, geolocated on the reference ellipsoid and represented in cartographic projection (UTM), this product so called GEC_B. The basic processing features characterizing the GEC_B product are[11]:
• the processing applied for the generation the lower product levels including radiometric equalization with the usage of the ellipsoid for the estimation of antenna pattern and incidence angle)
• multilooking and detection
• for Wide Swath mode only, subswath mosaicking and calibration constant equalization
• the map projection on the ellipsoid • The data is aligned with the north direction. Num Actual Imaging
Time
Acquisition mode
Looking
Mode Pass Direction Polarization
Acquisition status
May data acquisition
1 2015-05-03 14:27 ST Right Descending VV Delivered
2 2015-05-04 14:23 EW Right Descending VV Delivered
July Data Acquisition
3 2015-07-24 14:26 EW Right Descending VV Delivered
4 2015-07-25 14:23 EW Right Descending VV Delivered
5 2015-07-26 14:19 EW Right Descending VV Delivered
6 2015-07-27 14:16 EW Right Descending VV Delivered
7 2015-07-28 14:12 EW Right Descending VV Delivered
8 2015-07-29 2:23 Right Ascending VV Canceled
9 2015-07-30 2:20 EW Right Ascending VV Delivered
10 2015-07-31 2:16 EW Right Ascending VV Delivered
5. COMPETENCE OF SAR IMA SPILL DETECTI
The problem of pollution of the oceanic wat oil materials is presently considered as one As first step for solution of the oil spill re using airborne and spaceborne remote se surveillance of the sea surface. Such system all-weather observation, be independent fro conditions and cloud cover, define the volume of oil spill and work in real scale of aperture radar (SAR) is independent of illumination conditions and allow to acquire and night under cloud cover that is an ad remote sensing sensors.
SAR is an active remote sensing tool in wh satellite transmits microwave signals tow surface, SAR signal after interaction with the to the antenna [22]. The interaction between microwaves is very sensitive to variatio roughness. Rough surfaces scatter large amo to the antenna and have bright signatures wh reflect the energy away from the anten signatures. It is well-known, that crude substances form films of various thicknesses Oil films locally damp sea surface roughn signatures, so-called slicks, on the SAR im look on the SAR images as dark patch surrounding surface.
During the lifetime of oil spill in the sea it number of processes, which dramatically chemical properties. Called by term weatheri are as follows: spreading, drift, evapo emulsification, bacterial degradation and ph With time the physical-chemical propertie changed due to effect of these processes. Th important role in oil spill detection by using but relative importance of each process is n It is also reported that the thick part of oil only 10% of spill area, while remaining oil c an area as blue shine [22].
The detectability of oil slicks/spills in SA depends on the wind speed at the sea surfac speeds, typically between 0 and 2-3 m/s, th dark on SAR images. In this case the wind-g not already developed and oil films look background, - detection in this case is impo between 3 and 6 m/s is ideal for oil slick surface roughness is developed and oil sli patches on a bright background. However, reaches 10-12 m/s, detectability is im obstructed due to the redistribution of oil surface waves and wind-induced mixing i layer [23]. as a result slick disappears from SAR imagery.
Other detection problem is discrimination and natural organic oil slicks [8]. Natural very small thickness resulting from life-cyc other marine organisms can form surface surface and, in turn, produce similar dark sig images [7]. Experiments conducted with mu
polarization SIR-C/X aboard the space shu F
AGERY FOR OIL TION
aters by crude oil and ne of the most sharp. advantage over other
which an antenna on a toward to the ocean the sea surface returns en the sea surface and tions in sea surface mount of energy back while smooth surfaces tenna and have dark de oil and other oil ses on the sea surface. ghness and give dark R images [9];[8], they tches among brighter
it will be expose to a ly influence physical-ering, these processes
SAR images strongly rface. Under low wind , the sea surface looks d-generated waves are ooks dark on a dark possible. Wind speed ick detection, the sea slicks appear as dark er, when wind speed impossible again or il spills/slicks by the g in the upper ocean m the sea surface and
n between man-made ral biogenic films of a
expected could provide more relia discrimination.
6. METHO
In this study, both visual and techniques were applied. The me the following sections.
Step 1: Oil spill areas identificati
We applied several image enhance and others, this step allowed us to i are potential oil spills, followed identified 14 areas, where each ha step helped us to focus our followi the identified areas without the scenes.
Step 2: Image Filtering
Several filtering methods are used t areas representing possible oil spill Lee (7x7), Gamma (7x7), Frost (7x used in different oil spill discrimina [19]). It is also observed that these information boundaries of high and testing many of these filters, we cho to all sub-images obtained from th Step 3: Visual analysis and oil spi
In order to analyze and interpret spread of oil spill, it is very understand some phenomena and fe spill process. Oil spill in th immediately start to spread, dispers processes that are collectively calle progress, duration and result of depend on the amount, composition oil. Illegal oil slicks from tankers a size and they are therefore easier d comparison with hazardous acciden As well, we need to consider the en as mixing, currents, temperature an for the weathering of spilled oil [1 impact on the spill during the first f very important to detect the first crucial to have a continuous, hou Large amounts of oil will result to short time after dumping. On the volatile and dissoluble in seawater spills, in comparison to those w spilled in the same amounts [22]
Also in our interpretation we consider the look-alike phenomena that appear under sea-air boundary layer conditions, which may be classified as oil spill in radar images. These may include,
Figure 2: Oil Spill Map from July 24 KompSAR- 5 reliable information for oil slick
ETHODOLOGY
and digital image processing methodology used is shown in
ation
ncement such as linear contract to identify the areas where there d this interpretation we could has at least one oil spill. This wing image processing only on e need to process the whole
d to discriminate high contrast ills in the images. In general (7x7) and pass (3x3) filters are
ination studies (([1], [17], se filters minimize the loss of
nd low contrasted areas. After choose to apply Gamma(7x7)
the first interpretation step. spill digitization
ret correctly the existence and y important to consider and d features happing during the oil the marine environment will ersed or degenerated by natural alled weathering over time. The of the weathering processes tion and properties of the spilled s are relatively thin and small in r degenerated by weathering in dental oil spill.
Figure 3: location map of oil spill region in the study area
Figure 5: reprojection of AIS Information on the
Figure 6: Analysis and comparison of three successive data contained oil spill
the bottom topography in shallow waters, fresh water slicks, plums of municipal sewage, wave shadows behind land or structures [19].
In each oil spill area identified, there are several oil spills, we could map and digitize each one, then this followed by calculation of the area size, and create oil spill map (Figure 2), We used several remote sensing“image processing”software in particularly Geomatica 15 and ENVI 5.1, as well we found Google Earth is a user friendly tool to visualize the results and analyze it through the acquisition period.
7. ANALYSIS AND RESULTS
Analytical efforts were focused on overall assessments of image quality and suitability for slick detection, identification of possible oil slicks in the area, and comparison of slick patterns between the different dates of imagery. The interpretation results indicate that certain coastal areas of the UAE face frequent oil spills.
The daily acquisition of KOMPSAT 5 SAR images over the study area allowed us to identify three areas with frequent oil spill incidents, and two areas with less frequency. From our analyzing of these areas of oil spill we could see the evolution and the progress of
oil spill. General:
In total and through the 8 dates of data acquisition and oil spill monitoring we could identify 73 oil spills distributed through 14 areas of oil spill. These are concentrated mainly in three regions, and there
are two others with less frequency, and they are located with Qatar marine area (Figure 3).
The total areas calculation is about 91.6 km2, but we
need to
consider only the average per aquistion or per day. as
well we Assume oil density 870 kg/m3, and assuming there are in average 3500 litre/km2 ( 3.1 metric ton/km2) of oil spill, we conclude that the total oil spill 32.55 km2 will spread 101 tons, and in this case we have the following estimation per area (Table 2 and Figure 4):
Table 2: Area size with estimated metric ton Area
nbr
Size in km2 Estimated metric ton(ton)
1 1.85 5.7
2 20 62
3 8 24.8
4 1.7 5.3
5 1 3.1
total 32.55 101
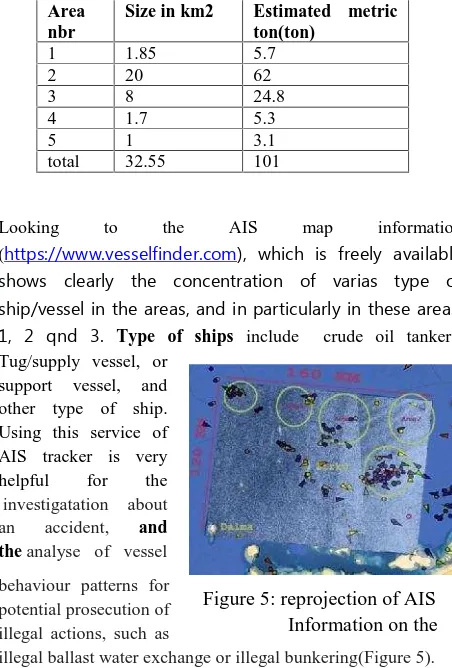
Looking to the AIS map information
(https://www.vesselfinder.com), which is freely available
shows clearly the concentration of varias type of ship/vessel in the areas, and in particularly in these areas; 1, 2 qnd 3. Type of ships include crude oil tankers, Tug/supply vessel, or
support vessel, and other type of ship. Using this service of AIS tracker is very helpful for the investigatation about an accident, and theanalyse of vessel
behaviour patterns for potential prosecution of illegal actions, such as
illegal ballast water exchange or illegal bunkering(Figure 5).
In the area 1 we have 9 data acquisition, two in May and 7 in July, we have identified oil spills in all of these data sets, exepct the data of May 3rd for the weather reasons mentioned previously, and on July 28, although the data is very good and the weather condition are favorable for oil spill detection, where the wind speed around 6m/s and the wave hieght 3 feets, nevertheless we didn't identified any major or recongizable oil spill. It could reflect less activtie of ship movment, or a firm coast guard patrol activities in that day, we think this needs more invistigation!
Considering the behavior of the varias oil spill identified through the observation, we can say the life cycle of an oil spill vary from few hours to few days, and this depend on the type of oil and the size or quanity as well the weather conditions such as current and wind speed and their directions. In the region we identified
mostly small oil spills, about 30 oil spill (out from a total 73 spill identified), and as most of these are Figure 4: Main area of oil spill from
Figure 8: A
Figure 9: D Figure 7: Important oil spill
identified on July
small and most propably are very light crud products (e.g., gasoline and diesel) will quick
thin film which definitively affect and damage the ma that the length of such spill reach thousa hundreds of width Figure 6
Although most of the spills in this area are s some with important size like the one iden on July 31, 2015. It is about 2.32 km2, wh more than 7 tons of oil!(Figure 7).
In the area 2 we identified a big oil spill and similar to the spill
identified in the area 1. It is very clear this is a serious oil spill that spreaded over 14 km2, and most propabley it was released on July 25th, seeing the rapid progress and development of the spill through the follwing days. From the dark color of the spill on 25thand 26th, it
is like a fresh oil spill, and within few days 31), the spill started to disappear in the wa damage to the marine life. we can expect th big oil spill would go from July 24/25th to means about days! we didn't notify any anno incident from any media in the Gulf, we ha far from the coast of Abu DHabi, it is about from Sir Bu Nair Island, it is close by abo serious distance (Figure 8)
The movement of the this spill and its direction are controled by local climate condition in particularly the wind and current, but we observed, it didn't travel much and it developped almost in the
same region (Figure 9).Finding such as thi considering all its environmental and necessitate a continous monitoring o environment.
: A serious oil spill covering an area films when spilled nce aerial-obervation). zing the successive days on the area r one, we see how fast persion of the oil spill, is means almost every ere are several of oil lease in the water, and disappear deep in the lf marine water, marine life. We nofity usands of meters and
re small, still there are entified in this region which could released
and other smaller ones
ays (the image of July water causing a lot of t the life cycle of this to August 5th, which nnouncment about this have have to say it is out 85 km, but not far bout 20 km, this is a
this big oil spill, and d economic damage of this sensitive
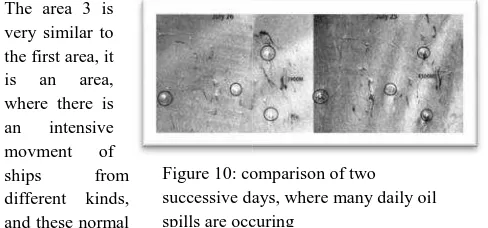
The area 3 is
seeing the number of oil productio size of oil spills are important in s lenth about 5 Km. although th important, where we observed aro life cycle of these spills are from total size of oil spills in this area is
8. CONC
We conclude that remote sensing of SAR imagery is very crucial fo monitoring of oil spill. The importa large coverage, the high frequency demonstated a daily coverage and with the help of more than one s proved its capability to detect clearl helped us to identify even the ver and the high frequency of data aq with daily coverage, helped us addition it is now very easy to aqui spill report in less than one hour, a AIS, which give information abou can claim a near real time oil spill m The big number of oil spills, whe spills events, is a clear evidence o we linked this as well to the intens particularly for the supply and production platforms. This indicat oil spill are the illegal actions, in pa of ballast water and the bunkering a We notified the rapid disappear o only few hours, but the bigger on days, all depend on the size and th be crude oil or ligh diesel.
Finally, and as we suggested recommend to the national autho near-real time oil spill monitori satellite imagery, with the support navigation radars.
9. Ackno
The author express his gratitud Research Institude and its servic services co for providing the SAR great technical support. The autho
comparison of two days, where many daily oil
ccuring
tion platforms in this area. The n size, we can see oil spill with the number and spread are around 20 spills, we noted the rom few hours to two days. the
is about 8 km2 (Figure 10). NCLUSION
g technology including the use l for an effective detection and rtance of satellite imagery in its ncy of acquisition, as we have and it could be less than daily e satellite. KOMPSAT 5 SAR early oil spill, its high resolution very small oil spill (0.06 km2), aquistion, where it provided us s to achieve these results. In quire the data and deliver the oil r, and adding the information of bout the potential polluters, we ill monitoring system.
here we found daily small oil e of the problem in this region, nsive movment of ships, and in d support vessels for the oil cate as well the main causes of particularly from the discharge g activities.
r of the small oil spill, may be r ones could stay more than ten the typ of materials, this could
official distributor of Geomatica software, for the support of using the latest version of PCI. Also, we would thank the “National Center of Meteorology & Seismology” for providing climate data reports.
10. References
1. Akkartal A., F. Sunar,. The usage of radar images in oil spill detection, The International Archives of the Photogrammetry, Remote Sensing and Spatial Information Sciences. Vol. XXXVII. Part B8. Beijing 2008, pp. 271-276(2008)
2. Alpers, W., and H. Huhnerfuss.. Radar signatures of oil films floating on the sea surface and the Marangoni effect.J.Geophys. Res., 93, 3642-3648(1988).
3. Etkin, D.S., Analysis of oil spill trends in the US and worldwide 2001. Proceedings of the 2001 International Oil Spill Conference, pp. 1,291-1,300 (2001).
4. Espedal, H.A., O.M. Johannessen, J.A. Johannessen, et al. COSWATCH’95 ERS 1/2 SAR detection of natural film on the ocean surface. J. Geophys. Res., 92, 24969-24982, 1998.
5. Essa. s. m., Harahsheh. h., Shiobara. m., and Nishidai. t, Operational Remote sensing for the Detection and Monitoring of oil Pollution in the Arabian Gulf: case studies from the united Arab Emirates. Oil Pollution and its Environmental Impact in the Arabian Gulf region. M. AlAzab, W. Elshrbajy and S. AL-Ghais, (editors). ELSEVIER. Development in Earth & Environmental Science 3, pp: 31–48(2005).
6. Gade, M., W. Alpers, H. Huhnerfuss, et al. Imaging of biogenic and anthropogenic ocean surface films by the multifrequency/multipolarization SIR-C/X-SAR. J. Geophys.Res., 103, 18851-18866(1998)
7. Gade, M., and S. Ufermann. Using ERS-2 SAR images for routine observation of marine pollution in European coastal waters. Proc. of IGARSS’98, Seattle, USA, July 6-10(1998).
8. Huhnerfuss, H., Alpers W., Fast O., et al. 1986. On the discrimination between crude oil spills and monomolecular sea slicks by airborne remote sensors - today©s possibilities and limitations. Proc. Of IGARSS©86, Zurich,1359-1364(1986)
9. Huhnerfuss, H., W. Alpers, W.L. Jones, et al. The damping of ocean surface waves by a monomolecular film measured by the wave staffs and microwave radars. J. Geophys.Res., 86, 429-438(1981)
10. ITOPF,http://www.itopf.com/fileadmin/data/Docume nts/Company_Lit/Oil_Spill_Stats_2014FINALlowres. pdf)(2015).
11. Korea Aerospace Research Institude(KARI), SI Imaging services co., ltd, kompsat-5 product specifications/ standard products specifications, version 1.2, july, 2015.
12. Kotova, L., H.A. Espedal, and O.M Johannessen. Oil Spill Detection Using Spaceborne SAR: a Brief Review. Proc. 27 th Int. Symposium on Remote Sensing Environmental, 8-12 June 1998, Tromso, Norway, 791-794(1998).
13. Lu J., H. Lim, M. Bao, S.C. Liew, L.K. Kwoh, 1999. Mapping ocean oil pollution with ERS SAR imagery, Proc. 20th. Asian Conf. Rem. Sens., 22-25 November, Hong Kong, China.
http://www.aars- acrs.org/acrs/proceeding/ACRS1999/Papers/OCN99-4.htm(1999).
14. LU, J , Marine oil spill detection, statistics and mapping with ERS SAR imagery in south-east Asia, International Journal of remote Sensing, 24,15, 3013-3032 (2003).
15. Maar M., Burchard H. & Bolding, K. “Simulating the fate of illegal oil discharges in the marine envronment, deliverable report #7” (2003), http://pta.jrc.cec.eu.int/
16. Masuko, H., T. Kobayashi, K. Okamoto, and W. Alpers. Observation of artificial slicks with SIR-C/X-SAR around Japan. Proc. IGARSS©95, Florence, Italy, 14-18 July 1995, P.227-229(1995)
17. Marghany , RADARSAT Automatic Algorithms for Detecting Coastal Oil Spill Pollution, International Journal of Applied Earth Observation and Geoinformation, Vol. 3, Sayi 2, pp. 191-196 (2001) 18. National Center of Meteorology & Seismology,
climate data report by personal request, p4(2015) 19. Özkan C., F. Sunar, Comparisons of Different
SemiAutomated Techniquesfor Oil-SpillDetection:A Case Study in Lebanon, 27th EARSel Symposium,
4-7 June, Bolzano, Italya (2007).
http://www.researchgate.net.
20. PAVLAKIS, P., SIEBER, A., AND ALEXANDRY, S., Monitoring OilSpill Pollution in the Mediterranean with ERS SAR. Earth Observation, Quarterly, 52, 8-11(1996).
21. Pavlakis, P., Tarchi, D., Sieber, A.J., 2001, On the Monitoring of Illict Vessel Discharges, A Reconnaissance Study in the Mediterranean Sea, EC DG Joint Research Center, Institute for the Protection and Security of the Citizen Humanitarian Security
Unit (2001).
http://ec.europa.eu/echo/files/civil_protection/civil/ma rin/reports_publications- /jrc_illicit_study.pdf 22. Sabins, F., Remote sensing - Principles and
Interpretation. W.H. Freeman & Co, N.Y. 494 p, 1997.
23. Scott, J.C. 1986. Surface films in oceanography. ONRL Workshop Rep. C-11-86. Office of Nav. Res., London, 19-34(1986)