The extent of resource use inefficiencies in cotton production in
Pakistan’s Punjab: an application of Data Envelopment Analysis
Muhammad Shafiq, Tahir Rehman
∗Department of Agriculture, The University of Reading, Earley Gate, P.O. Box 236, Reading RG6 6AT, UK
Received 11 November 1999; received in revised form 22 December 1999; accepted 29 December 1999
Abstract
This paper attempts to identify sources of resource use inefficiency for cotton production in Pakistan’s Punjab. The use of a non-parametric method, Data Envelopment Analysis (DEA), is developed to study the relative technical and allocative efficiencies of individual farms which use similar inputs, produce the same product and operate under comparable circum-stances. In the ‘cotton–wheat’ system of Pakistan, there are a considerable number of farms that are both technically and allocatively inefficient. The use of DEA shows that the technique provides a clear identification of both the extent and the sources of technical and allocative inefficiencies in cotton production. However, both the interpretation of the farm level results generated and the projection of these results to a higher level require care, given the technical nature of the agricultural production processes. © 2000 Elsevier Science B.V. All rights reserved.
Keywords:Data Envelopment Analysis; Technical efficiency; Allocative efficiency; Cotton
1. Introduction
Several recent studies on the technical and eco-nomic efficiencies of crop production in Pakistan, particularly for wheat and rice, have pointed out the existence of a ‘yield gap’. This ‘gap’ refers to the difference in productivity on ‘best practice’ and on other farms operating with comparable resource en-dowments under similar circumstances (Akhtar et al., 1986; Ali and Flinn, 1987; Hussain et al., 1991; Khan et al., 1994). Surprisingly, these studies have ignored cotton, despite it being the major export from Pakistan.
The existing studies on technical and economic ef-ficiencies have used the traditional parametric
meth-∗Corresponding author. Tel.:+44-118-931-8480; fax:+44-118-931-6747.
E-mail address:[email protected] (T. Rehman)
ods to estimate ‘average’ efficiencies only (Khan and Maki, 1979; Ali and Flinn, 1987; Ali and Chaudhry, 1990; Ali et al., 1993; Battese et al., 1993; Parikh and Shah, 1994; Parikh et al., 1995). The estimation of such ‘average’ efficiencies appears to ignore the argu-ment that the study of the individual farm is more im-portant to measure the resource use efficiency, and that the parametric methodology provides insufficient in-formation for policy analysis (Kalirajan, 1984; Kalira-jan and Shand, 1986). The research reported here sup-ports the importance of studying the individual farm efficiency, and it is the first study of its kind to have used the non-parametric method of Data Envelopment Analysis (DEA) for analysing the efficiency of indi-vidual farms in Pakistan.
The paper begins with a brief introduction of effi-ciency measurement and of the development of DEA. The description of data sources precedes the explana-tion of the DEA model in general and the specificaexplana-tion
of this model for cotton production. Next, the use of a Cobb–Douglas type of production function for identi-fying the important inputs in the production process is discussed before presenting the results of the techni-cal and allocative efficiency analyses. Finally, the use-fulness of the DEA model for examining the resource use inefficiency of cotton production in Pakistan is assessed.
2. Measurement of efficiency
The efficiency of production units is measured ei-ther by parametric or by non-parametric methods. The first approach estimates the parameters of the produc-tion or cost funcproduc-tions statistically. The second one, in contrast, builds a linear piece-wise function from empirical observations of inputs and outputs, with-out assuming any a priori functional relationship be-tween the inputs and the outputs. The non-parametric or ‘frontier’ method of measuring efficiency was first introduced by Farrell (1957) and since then several improvements and extensions have taken place (see Battese (1992) and Coelli (1995)).
Building on Farrell’s work, Charnes et al. (1978) have developed the fractional linear programming method of DEA, which compares inefficient firms with the ‘best practice’ ones within the same group. It has been used widely for efficiency studies for both public and private organizations (see Seiford and Thrall (1990)). In the agricultural economics litera-ture, however, only a few examples of the application of DEA could be found (Haag et al., 1992; Shimizu, 1992; Cloutier and Rowely, 1993).
2.1. DEA
The DEA technique has come to be named after its originators and is referred to as the CCR model. It involves optimizing a scoring function defined as the ratio of weighted sum of outputs of a particular production unit and the weighted sum of its inputs, that is efficiency. This function is optimized subject to the condition that with any of the production units included in the analysis, the value of the objective function achieved cannot be more than 1, implying that the efficient units will have a score of 1.
The DEA method is regarded as one of the most suc-cessful techniques of analysis proposed by researchers in Management Science and Operations Research, as is evident by the profligacy of its applications (see Coelli (1995)). However, the original version of the CCR model is not very convenient for a linear pro-gramme as it has more restraints than variables, mak-ing it difficult to solve. Hence, the ‘dual’ version of the CCR model is more popular as the DEA model. The technical details can be found in Charnes et al. (1978), Norman and Stoker (1991), Charnes et al. (1995), and Coelli et al. (1998).
3. The sample of cotton producers
The data were collected from a randomly drawn sample consisting of 120 farms from the cotton–wheat area of the southern part of Pakistan’s Punjab. The sample farms can be treated as a homogenous group for several reasons. First, all of the farms are in an area where technical and agronomic practice recom-mendation domains are the same. Second, they are in reasonable proximity to each other. Third, all of them face uniform natural and market conditions and the same infrastructure. Finally, all the farms have broadly similar types of soils.
3.1. Characteristics of farmers and farms
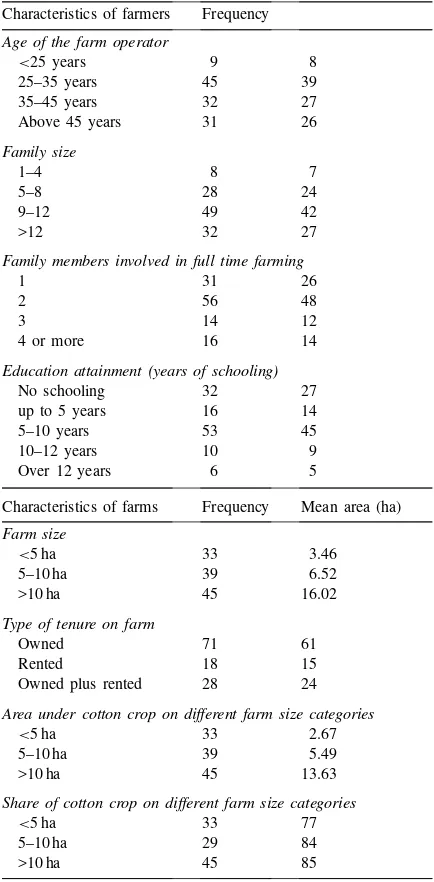
Information such as the farm operator’s age, his educational attainment, the size of the farm family and the number of family members involved in farming is given in Table 1. Most of the farmers are over 25 years old, with the age ranging from 20 to 60 years. The family size is large and three-fourths of the farms had more than nine members per household, and on nearly half of the farms, at least two of the family members were working as full time farm workers on farm.
Table 1
Characteristics of farms and farmers included in the sample Characteristics of farmers Frequency
Age of the farm operator
<25 years 9 8
25–35 years 45 39
35–45 years 32 27
Above 45 years 31 26
Family size
1–4 8 7
5–8 28 24
9–12 49 42
>12 32 27
Family members involved in full time farming
1 31 26
2 56 48
3 14 12
4 or more 16 14
Education attainment (years of schooling)
No schooling 32 27
up to 5 years 16 14
5–10 years 53 45
10–12 years 10 9
Over 12 years 6 5
Characteristics of farms Frequency Mean area (ha) Farm size
<5 ha 33 3.46
5–10 ha 39 6.52
>10 ha 45 16.02
Type of tenure on farm
Owned 71 61
Rented 18 15
Owned plus rented 28 24
Area under cotton crop on different farm size categories
<5 ha 33 2.67
5–10 ha 39 5.49
>10 ha 45 13.63
Share of cotton crop on different farm size categories
<5 ha 33 77
5–10 ha 29 84
>10 ha 45 85
for fodder production, thus the area available to them for cotton production is reduced.
4. The DEA model for cotton production
The model developed to study the efficiency of cot-ton production is the input minimization version (dual)
of the CCR model as specified below.
MinZo (1)
Making Units (DMUs) in the sample,m=1 represents
cotton in the cotton–wheat system,i=1,. . ., 6 is the
number of inputs included in the analysis, Zo is the
relative efficiency score of the DMU, ‘o’, under study,
λj are lambda values that are the weights to be used
as multipliers for the input levels of a referent farm to indicate the input levels that an inefficient farm should
aim at to achieve efficiency,Xij is the level of use for
theith input on thejth farm,Ymj is the level of themth
output on thejth farm,Yois the level of the output on
unit ‘o’, and Xo is the vector of the levels of inputs
being used by the DMU ‘o’.
The minimum value ofZo(≤1) for the unit ‘o’ is
found by ‘combining’ the performance of all units be-ing analyzed. This is done in such a way that, for each input, the combination of inputs does not exceed the
inputs of unit ‘o’ and for each output and the
combi-nation of outputs is at least as great as that of unit ‘o’.
On solving the model separately for each DMU in the
sample, the efficiency scores (<1 for the inefficient
units and 1 for the efficient ones) are established. A score less than 1 means that a linear combination of other units from the sample could produce the same vector of outputs using lower levels of inputs. The problem of returns to scale can be dealt with by using the Banker et al. (1984) extension to the CCR model as: (a) for constant returns to scale (CRS), the
condi-tionPλi ≥ 1 is added; and (b) for variable returns
to scale (VRS), the restraintPλi =1 is imposed.
To obtain the efficiency scores, a linear program-ming matrix was constructed which included input and output data for each of the farms in the sample. It was then used to evaluate the efficiency of an in-dividual farm by substituting its inputs and outputs
This ‘iteration’ or substitution was repeated 117 times (three outlier farms were dropped from further analy-sis) to obtain efficiency scores for all the sample farms. For a firm to be efficient, two conditions must hold:
(a) that the calculated value ofZothat isZ∗must equal
1; and (b) all the slack variables in the LP solution must be 0 (Charnes et al., 1978).
5. Role of various inputs in crop productivity
It is quite usual to integrate some form of functional analysis with the DEA model, mostly regression mod-els, to identify those inputs that play a prominent role in determining productivity. Subsequently, the rela-tive efficiency of a production unit can be measured (Charnes et al., 1978; Bowlin et al., 1985; Dyson et al., 1990; Roll and Cook, 1993; Thanassoulis, 1993). Thus, a Cobb–Douglas type of production function was fitted to the data collected from the survey and the results are discussed below.
5.1. Explanation of the variables
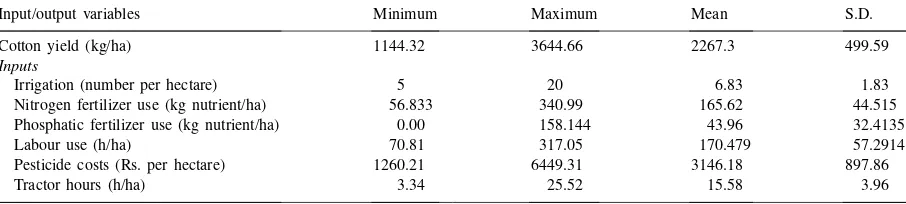
The major inputs that are assumed to determine the cotton crop output (kg/ha) include irrigation wa-ter (number per hectare), nitrogen (kg nutrients/ha), phosphate (kg nutrients/ha), labour (h/ha), pesticide costs (Rs. per hectare) and tractor hours required per hectare for levelling, ploughing, planking and plant-ing. The basic statistics related to these variables are presented in Table 2. It is clear that there is a wide vari-ation in both the input use and the cotton output. The
Table 2
Basic statistics of cotton output and major inputs useda
Input/output variables Minimum Maximum Mean S.D.
Cotton yield (kg/ha) 1144.32 3644.66 2267.3 499.59
Inputs
Irrigation (number per hectare) 5 20 6.83 1.83
Nitrogen fertilizer use (kg nutrient/ha) 56.833 340.99 165.62 44.515
Phosphatic fertilizer use (kg nutrient/ha) 0.00 158.144 43.96 32.4135
Labour use (h/ha) 70.81 317.05 170.479 57.2914
Pesticide costs (Rs. per hectare) 1260.21 6449.31 3146.18 897.86
Tractor hours (h/ha) 3.34 25.52 15.58 3.96
aNote: large variation in labour hours used per hectare is because some farmers undertake manual hoeing and thinning of cotton twice.
output obtained by some of the farmers in the sample was three times as high as that achieved by others; and there were wide variations in the levels at which inputs were being used. There were large differences in the use of nitrogenous fertilizer as some farmers were using six times more fertilizer as compared to others and some farmers did not use any phosphatic fertilizer. In preparing their fields for cotton planting, some farmers use as few ploughings as two, whilst some plough the fields 13 times before planting. Such a variation in the levels of inputs being used suggests that possibly these levels represent a mismanagement of resource use.
6. Results of the statistically estimated function
In Table 3, a very low value of the adjusted R2
Table 3
Production coefficients estimated from the Cobb–Douglas cotton production function
Variables Coefficient Standard error Significance
Constant 5.5845 1.118 0.000
Nitrogen fertilizer use (kg nutrient/ha) 0.0008 0.0812 0.992
Phosphatic fertilizer use (kg nutrient/ha) −0.0003 0.0027 0.905
Irrigation (number per hectare) 0.1507 0.1004 0.136
Labour use (h/ha) −0.123 0.0588 0.039
Pesticide costs (Rs. per hectare) 0.0174 0.0799 0.828
Tractor hours (h/ha) −0.0518 0.072 0.474
Rsquare 0.101
AdjustedR2 0.044
F-Statistics 1.772 0.10
Durbin–Watson statistics 1.513
and the output produced as shown in Table 2, the efficiency analysis of individual farms assumes much greater relevance.
7. Technical efficiency analysis
The use of the basic DEA model started with the single input–single output situation. More inputs were introduced into the analysis, one at a time, to evaluate the relative efficiency of individual farms. This pro-cedure also shows how the increase in the number of inputs affects the efficiency rating of individual farms. As the basis for comparison among them is broadened, the ranking of individual producers improves. In the initial run, the single input is nitrogen. The second run involved two inputs, nitrogen and pesticide expendi-ture; and for the third run, multiple inputs as defined for the cotton production function were used. In all the runs, seed cotton is the output. The efficiency scores of the individual farms were calculated separately for both CRS and VRS assumptions.
The basic DEA model for the ‘DMU-1’ assuming CRS is stated below:
MinZ1
s.t.
Cotton yield
1445.54λ1+1455λ2+ · · · +1581λ120≥1445.54 Phosphorus
28.42λ1+0λ2+ · · · +28.42λ120−28.42Z1≤0
Nitrogen
198.92λ1+56.83λ2+ · · ·
+198.9λ120−198.95Z1≤0
Irrigation
8λ1+8λ2+ · · · +6λ120−8Z1≤0
Labour
224.42λ1+151.9λ2+ · · ·
+258.8λ120−224.42Z1≤0
Pesticide
2816.94λ1+3553λ2+ · · ·
+5752λ120−2816.94Z1≤0
Tractor
10.28λ1+18.53λ2+ · · · +12.65λ120−1028Z1≤0
λ1+λ2+ · · · +λ120≥1
In the above equations, the subscript ‘120’ refers to the identity of the last farm.
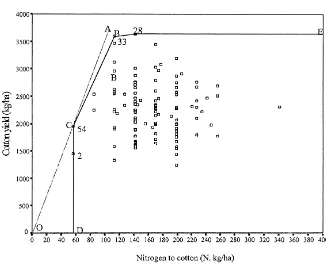
Fig. 1. Graphical presentation of the single input–single output DEA model.
of fertilizer to achieve their current levels of output when compared to farm 54. Given a high variation in nitrogen use, the pertinent question is, do higher levels of nitrogen application contribute to an increase in the crop yield? The results show that this is not the case, suggesting that an excessive use of nitrogen on these farms takes them below the efficient frontier.
The points depicted in Fig. 1 are scattered, and therefore, the CRS assumption would seem not to ap-ply. Assuming that VRS do exist and as this assump-tion is not so demanding, more farms are likely to be located on the efficient frontier. There are four farms (DMUs 2, 54, 28 and 33) with efficiency scores of 1 lying on the frontier, and they form the envelope
DCBErepresenting the frontier to be used as referent
for other farms. The use of nitrogen on the efficient farms shows that the output increases with increase in the level of input use.
The inefficient farms in the sample were using in-puts at levels greater than required relative to the
out-put levels being obtained by other farms in the sam-ple. A summary of the efficiency scores for all farms is presented in Table 4. It is interesting to note that, when VRS are assumed, only one farm has an effi-ciency score of less than 60%. Whereas, when CRS
Table 4
Results of the DEA models — technical efficiency scores Ranges Number of DMUs falling in ranges The CRS case The VRS case All inputs All inputs
Equal to 100% 10 30
>90<100% 9 18
80–<90% 9 38
70–<80% 21 20
60–<70% 23 10
50–<60% 25 1
40–<50% 16 –
are assumed, 38% of the farms have efficiency scores of less than 60%.
7.1. Use of DEA results to study inefficiency on an individual farm
By using the results of the DEA model, it is possi-ble to work out what is required by inefficient farms to become efficient. Take the farm DMU-70, with ef-ficiency scores of 57.97 and 58.78 under the CRS and VRS assumptions, respectively. For this farm, the farms 40 (0.287), 54 (0.309) and 86 (0.382) are its ref-erent units when CRS are assumed, while the DMUs 6 (0.043), 40 (0.246), 54 (0.316) and 86 (0.395) are the referents when VRS are assumed.
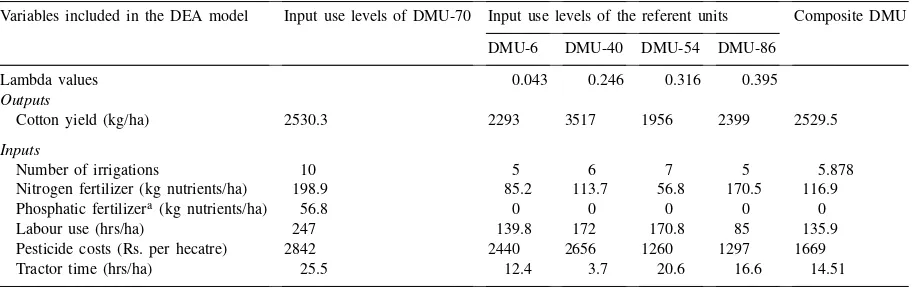
The production practices of the DMU-70 and its ref-erents are compared in Table 5, and clearly, the use of inputs by the DMU-70 is ‘excessive’. The ‘excessive’ nature of the input use by DMU-70 is borne out when the recommendations by the Central Cotton Research Institute (CCRI, 1994) are considered. According to CCRI in this area, nitrogen plays the dominant role in determining cotton yield and phosphorus contributes little, and to obtain optimal yield, there is no need to plough the land more than four or five times. As is obvious, this farm is not following the recommended practices. However, this particular farm has a greater number of land parcels (three) as compared to its peers (DMUs 6, 46, 54, and 86) which are contiguous
Table 5
Input use levels of the DMU-70 and its referent DMUs — the VRS case
Variables included in the DEA model Input use levels of DMU-70 Input use levels of the referent units Composite DMU DMU-6 DMU-40 DMU-54 DMU-86
Lambda values 0.043 0.246 0.316 0.395
Outputs
Cotton yield (kg/ha) 2530.3 2293 3517 1956 2399 2529.5
Inputs
Number of irrigations 10 5 6 7 5 5.878
Nitrogen fertilizer (kg nutrients/ha) 198.9 85.2 113.7 56.8 170.5 116.9
Phosphatic fertilizera (kg nutrients/ha) 56.8 0 0 0 0 0
Labour use (hrs/ha) 247 139.8 172 170.8 85 135.9
Pesticide costs (Rs. per hecatre) 2842 2440 2656 1260 1297 1669
Tractor time (hrs/ha) 25.5 12.4 3.7 20.6 16.6 14.51
aZero values in the ‘phosphatic fertilizer’ show that the efficient farmers were not using this input as it is not necessarily required for
cotton production.
farm holdings. This situation may have jeopardized the chances of this farm becoming efficient.
The above comparison would suggest strategies for the DMU-70 to rationalize the use of its inputs. The lambda values obtained from the DEA solution for this farm provide a composite DMU which would produce the equivalent level of output, but by using lesser lev-els of inputs as shown in Table 5. This information as generated by the DEA modelling approach is intrin-sically interesting and the DEA model can be run to examine allocative or economic efficiency of resource use on individual farms, as illustrated in Section 8.
8. Results of allocative efficiency analysis
Table 6
Allocative efficiency scores of the cotton producers Ranges Number of DMUs falling in a range
The CRS case The VRS case
Equal to 100% 14 34
Greater than 90% 8 19
but<100%
80–<90% 9 25
70–<80% 21 23
60–<70% 22 15
50–<60% 23 1
40–<50% 13 –
Less than 40% 7 –
more subtle as the allocative efficiency is the propor-tion by which the costs of the levels of inputs on a farm can be reduced without any loss in output. Thus, an efficiency score of 0.8 implies that the DMU con-cerned could reduce its costs by 20% by choosing a more cost-efficient input mix.
In measuring allocative efficiency of cotton produc-tion, the costs of individual inputs used have been esti-mated by using the actual prices paid by farmers. The variables belonging to the same category were pooled together to reduce the number of cost variables in or-der to facilitate analysis. The variables defined were expenditure (in Rs. per hectare) on (i) land cultiva-tion; (ii) cotton seed; (iii) thinning; (iv) inter-cultural operations; (v) fertilizer; (vi) irrigation; and (vii) pes-ticide usage. The results as given in Table 6 show that, assuming VRS, nearly 30% of the DMUs have an ef-ficiency score of 1.
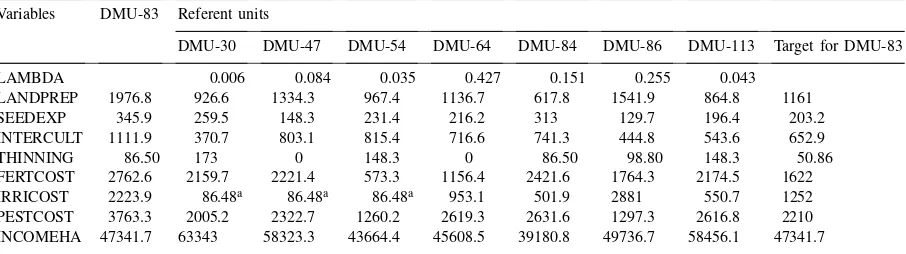
Table 7
Sensitivity analysis for allocative efficiency of cotton production on the DMU-83 Variables DMU-83 Referent units
DMU-30 DMU-47 DMU-54 DMU-64 DMU-84 DMU-86 DMU-113 Target for DMU-83
LAMBDA 0.006 0.084 0.035 0.427 0.151 0.255 0.043
LANDPREP 1976.8 926.6 1334.3 967.4 1136.7 617.8 1541.9 864.8 1161
SEEDEXP 345.9 259.5 148.3 231.4 216.2 313 129.7 196.4 203.2
INTERCULT 1111.9 370.7 803.1 815.4 716.6 741.3 444.8 543.6 652.9
THINNING 86.50 173 0 148.3 0 86.50 98.80 148.3 50.86
FERTCOST 2762.6 2159.7 2221.4 573.3 1156.4 2421.6 1764.3 2174.5 1622 IRRICOST 2223.9 86.48a 86.48a 86.48a 953.1 501.9 2881 550.7 1252 PESTCOST 3763.3 2005.2 2322.7 1260.2 2619.3 2631.6 1297.3 2616.8 2210 INCOMEHA 47341.7 63343 58323.3 43664.4 45608.5 39180.8 49736.7 58456.1 47341.7
aLower cost of irrigation on these farms shows that canal water was the only source of irrigation at a fixed charge of Rs. 86 per
hectare for the season.
Results of the estimation of both technical and allocative efficiency show that technically efficient farms were also allocatively efficient. However, some units such as the DMU-101 and the DMU-111 were technically efficient but were not so allocatively.
8.1. Sensitivity analysis for an individual DMU’s allocative efficiency
The DMU-83 has the lowest allocative efficiency score of 56.67 (assuming VRS) and it can be used to illustrate the use of sensitivity analysis for exploring the avenues for improving the allocative efficiency. The lambda values associated with the solution for this farm show that the DMUs 30, 47, 54, 64, 84, 86 and 113 were its referent units (see Table 7). For most of the inputs, the referent DMUs were spending con-siderably less than the DMU-83 particularly on pest control, fertilizer, and cultivation. Using lambda val-ues of the referent DMUs, the targets which DMU-83 can aim at become allocatively efficient and are pre-sented in the last column of Table 7. This farm needs to decrease its expenditure on pesticide, irrigation and land preparation operations.
9. Concluding remarks
quanti-ties of inputs used were unjustifiably higher than what would be required to achieve their present levels of crop output. By using the DEA modelling approach for efficiency analysis, it is possible to achieve two types of results. First, it is possible to identify the ad-justments that can be made in the use of inputs on inefficient farms by comparing them with their ‘peer’ farms. Second, the factors that can be manipulated to minimize the excessive use of inputs and hence reduce the costs of production can be established. However, for a meaningful interpretation of the DEA results, it is necessary to consider the totality of recommenda-tion domains for various producrecommenda-tion practices in spe-cific areas, as without the inclusion of all the relevant and important factors in the analysis, one cannot be assertive about the sources of inefficiencies. Nonethe-less, the DEA approach has an undoubted edge over the standard production function analysis for identify-ing the sources of inefficiencies on individual farms. The DEA results are much easier to interpret and to utilize for investigating avenues for improvements in technology and resource use efficiency on farms.
This exercise in using the DEA modelling approach for measuring efficiency has demonstrated that there was a high degree of allocative inefficiency, as regards costs of production, on cotton-producing farms in Pak-istan. However, the efficiency scores for both technical and allocative efficiencies increase with increase in the number of input variables included in the DEA model. The real advantage of DEA modelling is that it allows the specification of a multi-product, multi-input firm (Byrnes et al., 1987). The construction of the ‘efficient frontier’ for measuring the efficiency is achieved with-out having to make any pre-supposition regarding the underlying functional form and the statistical errors associated with the specification of such a function are also avoided.
Acknowledgements
This article has been derived from the thesis sub-mitted by M. Shafiq to The University of Reading for the award of a Ph.D. degree. He is grateful to the Pakistan Agricultural Research Council for sponsor-ing his studies and the stay in England and both the authors appreciate the co-operation of cotton produc-ers in Pakistan in providing the data.
References
Akhtar, M.R., Byerlee, D., Qayyum, A., Majid, A., Hobbs, P.R., 1986. Wheat in the Cotton−Wheat Farming Systems of the Punjab: Implications for Research and Extension, 86-8, PARC/CIMMYT Collaborative Program, Islamabad, Pakistan. Ali, M., Flinn, J.C., 1987. Profit efficiency among Basmati rice
producers in Pakistan’s Punjab. Am. J. Agric. Econ. 71, 302– 310.
Ali, M., Chaudhry, M.A., 1990. Inter-regional farm efficiency in the Pakistan’s Punjab: a frontier production function study. J. Agric. Econ. 41, 62–74.
Ali, F., Bailey, D., Parikh, A., 1993. Price distortion and resource use efficiency in a Pakistani province. Rev. Agric. Econ. 20, 35–47.
Banker, R.D., Charnes, A., Cooper, W.W., 1984. Some models for estimating technical and scale inefficiencies in data envelopment analysis. Manage. Sci. 30, 1078–1092.
Battese, G.E., 1992. Frontier production functions and technical efficiency: a survey of empirical applications in agricultural economics. Agric. Econ. 7, 185–208.
Battese, G.E., Malik, S.J., Broca, S., 1993. Production functions for wheat farmers in selected districts of Pakistan: an application of a stochastic frontier production function with time-varying inefficiency effects. Pakistan Develop. Rev. 32, 233–268. Bowlin, W.F., Charnes, A., Cooper, W.W., Sherman, H.D.,
1985. Data envelopment analysis and regression approaches to efficiency estimation and evaluation. Ann. Operations Res. 2, 113–138.
Byrnes, P., Fare, R., Grosskopf, S., Kraft, S., 1987. Technical efficiency and size: the case of Illinois grain farms. Eur. Rev. Agric. Econ. 14, 367–381.
Central Cotton Research Institute (CCRI), 1994. Agronomic Research Review of Agronomy Section, Annual Report of Central Cotton Research Institute, Multan, Pakistan.
Charnes, A., Cooper, W.W., Rhodes, E., 1978. Measuring the efficiency of decision making units. Eur. J. Operational Res. 2, 429–444.
Charnes, A., Cooper, W.W., Lewin, A.Y., Seiford, L.M., 1995. Data Envelopment Analysis: Theory, Methodology and Applications. Kluwer Academic Publishers, Boston.
Cloutier, M.L., Rowely, R., 1993. Relative technical efficiency: data envelopment analysis and Quebec’s dairy farms. Can. J. Agric. Econ. 41, 69–176.
Coelli, T.J., 1995. Recent developments in frontier modelling and efficiency measurement. Aust. J. Agric. Econ. 39, 219–245. Coelli, T.J., Rao, D.S.P., Battese, G.E., 1998. An Introduction
to Efficiency and Productivity Analysis. Kluwer Academic Publishers, Boston.
Dyson, R.G., Thanassoulis, E., Boussofiane, A., 1990. Data envelopment analysis. In: Hendey, L.C., Eglese, R. (Eds.), Operational Research Tutorial Papers. The Operational Research Society, UK.
Farrell, M.J., 1957. The measurement of productive efficiency. J. R. Statistical Soc. Ser. ‘A’ 120, 253–281.
Hussain, S.S., Longmire, J., Ali, M.M., Traxler, G., 1991. The yield gap for wheat in Pakistan. In: Haider, A.S., Hussain, Z., McConnen, R., Malik, S.J. (Eds.), Agricultural Strategies in the 1990’s: Issues and Policies. Pakistan Association of Agricultural Social Scientists, Islamabad, Pakistan.
Kalirajan, K.P., 1984. Farm-specific technical efficiencies and development policies. J. Econ. Stud. 11, 3–13.
Kalirajan, K.P., Shand, R.T., 1986. A Measurement of Farm-Specific Absolute Technical Efficiency for Multiple Output Farms. Rural Development Working Paper 86/6. National Centre for Development Studies, The Australian National University, Canberra.
Khan, M.H., Maki, D.R., 1979. Effect of farm size on economic efficiency: the case of Pakistan. Am. J. Agric. Econ. 61, 64–69. Khan, M.A., Sheikh, A.D., Zubair, M., 1994. A Baseline Study of Rice Management Practises and Productivity Issues at the Rice Maximization Project Location in the Pakistan’s Punjab, 94-1. AERU, National Agricultural Research Institute, Islamabad.
Kopp, R.J., Diewert, W.E., 1982. The decomposition of frontier cost function deviation into measures of technical and allocative efficiency. J. Econometrics 19, 319–331.
Lau, L.J., Yotopoulos, P.A., 1971. A test for relative efficiency and application to Indian agriculture. Am. Econ. Rev. 61, 94–109.
Norman, M., Stoker, B., 1991. Data Envelopment analysis: The Assessment of Performance. Wiley, London.
Parikh, A., Shah, K., 1994. Measurement of technical efficiency in the North-West Frontier Province of Pakistan. J. Agric. Econ. 45, 132–138.
Parikh, A., Ali, F., Shah, M.K., 1995. Measurement of economic efficiency in Pakistani agriculture. Am. J. Agric. Econ. 77, 675–685.
Roll, Y., Cook, W.D., 1993. Partial efficiency in Data Envelopment Analysis. Socio-Economic Planning Sciences 27, 171–179. Schmidt, P., Lovell, C.A.K., 1979. Estimating technical and
allocative inefficiency relative to stochastic production and cost frontiers. J. Econometrics 9, 343–366.
Seiford, M.L., Thrall, R.M., 1990. Recent developments in DEA, the mathematical programming approach to frontier analysis. J. Econometrics 46, 7–38.
Shimizu, T., 1992. Technical efficiency of melon farms under the marketing strategy of agricultural co-operatives. In: Bellamy, M., Greensshields, B. (Eds.), Issues in Agricultural Development-Sustainability and Co-operation. Dartmouth Publishing Company, Aldershot.