Changes in HDL-cholesterol and lipoprotein Lp(a) after 6-month
treatment with finasteride in males affected by benign prostatic
hyperplasia (BPH)
Licia Denti
a,*, Giuseppe Pasolini
a, Piero Cortellini
b, Laura Sanfelici
a,
Raffaella Benedetti
a, Alessandra Cecchetti
a, Stefania Ferretti
b, Lorenza Bruschieri
a,
Fabrizio Ablondi
a, Giorgio Valenti
aaDepartment of Geriatrics,Cattedra di Gerontologia e Geriatria,Uni6ersita` di Parma,Via Don Bosco 2,43100 Parma, Italy bDi6isione di Urologia,Azieuda Ospedaliera di Parma,Via Gramsci 14,43100 Parma, Italy
Received 11 January 1999; received in revised form 7 October 1999; accepted 25 October 1999
Abstract
Androgen effects on lipoproteins, mainly high density lipoprotein (HDL), could be exerted by a direct interaction of testosterone (T) or dihydrotestosterone (DHT) with liver androgen receptors. To assess if T needs to be converted into DHT to affect lipid metabolism, 13 patients were studied, affected with benign prostatic hyperplasia (BPH) and treated with an inhibitor of 5 alpha-reductase (finasteride). They were compared with 15 untreated controls. At baseline and after 3 and 6 months of therapy, each patient was evaluated as for lipoprotein and hormone concentrations, as well as for nutritional status. Body composition was assessed by anthropometry and bio-impedance analysis (BIA). Treatment was associated with a significant increase of HDL-cholesterol (HDL-C), mainly HDL3 subclass, and lipoprotein(a) (Lp(a)), as well as a decline of DHT, whereas no significant changes were apparent for T, estradiol (E2), sex hormone binding hormone (SHBG) and body composition indexes. However, no significant associations between DHT and lipid relative changes were apparent at bivariate correlation analysis. This finding was confirmed by comparing patient subsets identified by cluster analysis, according to HDL subclass individual responses. Rather, a slight association with E2 for HDL2 (positive) and HDL3 (negative) was found. In conclusion, finasteride can modify HDL and Lp(a) concentrations. However, by the data, these effects cannot be definitively attributed to the changes in DHT synthesis induced by finasteride, since a direct and non-specific interference of the drug on liver metabolism cannot be excluded. © 2000 Elsevier Science Ireland Ltd. All rights reserved.
Keywords:Finasteride; Dihydrotestosterone (DHT); High density lipoprotein (HDL); Lipoprotein(a) (Lp(a); Body composition
www.elsevier.com/locate/atherosclerosis
1. Introduction
A large body of epidemiological data supports a role for male sex as an independent risk factor for cardio-vascular disease [1]. Factors accounting for the gender-related differences in cardiovascular risk have not yet been completely elucidated; however, both a protective effect of female sex hormones and an atherosclerosis promoting effect of male sex hormones have been suggested.
Sex steroids could influence atherogenesis by affect-ing lipoprotein metabolism, as the gender-related differ-ences in lipid profile clearly suggest [2]. As for androgens, administration of testosterone or similar compounds [3 – 9] can differently affect lipoproteins, depending on dosages and route of administration. However, a decrease of high density lipoprotein-choles-terol (HDL-C), due to increase in hepatic lipase (HL) activity [3,4,8], has been generally found in response to treatment with androgen substances, with variable ef-fects on low density lipoprotein (LDL) and very low density lipoprotein (VLDL). Furthermore, exogenous androgens, administered by oral route, can also de-crease the concentrations of lipoprotein (a) (Lp(a))
* Corresponding author. Tel.: +39-521-236-422; fax: + 39-521-237-761.
[10 – 12], a lipoprotein newly recognised as indepen-dently associated with the development of atherosclero-sis both at coronary and cerebrovascular levels [13 – 15]. Nevertheless, the established effects of exogenous androgens on HDL and Lp(a), have not been defini-tively confirmed for endogenous sex steroids. Indeed, although an increase of HDL-C and ApoAI has been shown in response to androgen suppression induced by both orchidectomy or chemical castration [16 – 20], male hypogonadism is not associated with low HDL-C levels [21]. Also, studies on the correlations between androgen and lipoprotein blood concentrations gave rather confl-icting results. Indeed, HDL-C has been reported as positively related to testosterone (T) and dihydrotestos-terone (DHT) serum concentrations in man by several studies [22 – 25], although others [26,27] have found no significant associations. Similarly, no significant associ-ations have been reported between Lp(a) and androgen concentrations [28,29], with the exception of a positive
correlation to dehydroepiandrosterone-sulfate [29].
Therefore, in spite of the abundance of data for the importance of endogenous testosterone in normal HDL metabolism, its precise role has not yet been clarified. Besides, it is not clear whether in humans androgen action on lipids is exerted by testosterone itself or, as it occurs at the level of other androgen targets, by some specific end-products or intermediates in the pathway of testosterone liver metabolism, such as DHT or estra-diol [30].
The aim of this study was to assess whether in males the inhibition of liver 5 alpha-reductase and, as a consequence, the decrease in DHT can modify lipo-protein circulating concentrations.
To this purpose, the effects on lipids of finasteride, a 5 alpha-reductase inhibitor, recently introduced as treatment of benign prostatic hyperplasia (BPH) were studied [31].
2. Materials and methods
Twenty eight patients, aged 64.496.3 (M9S.D.)
(range: 55 – 74), consecutively referred to the outpatient care centre of the department of Urology of the Univer-sity of Parma (Italy) for BPH, were studied. They all gave informed written consent before participating in the study. The study protocol was approved by the ethical committee of the University of Parma.
BPH was diagnosed on the presence of symptoms of lower urinary tract obstruction and of enlarged prostates, documented by digital rectal examination and transrectal ultrasonography. However, because of the need for an untreated control group, only patients in an early phase of the disease and with symptoms of mild obstruction were enrolled into the study. A com-plete clinical and laboratory evaluation was performed
before randomisation, to exclude the presence of dia-betes mellitus, thyroid disease, severe renal or liver failure; among blood tests, also Protein C assay was performed, to exclude any possible intercurrent inflam-mation that could per se induce changes in lipoproteins, namely Lp(a) concentrations. No one of the patients enrolled was taking medications known to influence lipoprotein metabolism or alcohol in excessive daily intake.
They were randomly allocated to one of two groups: finasteride group (13 patients treated with Finasteride at the dosage of 5 mg o.i.d. (PROSCAR, Merck Sharp and Dome) for 6 months) and control group (15 un-treated patients). All patients were asked not to change their diet habits and their physical activity throughout the experimental period.
Before starting therapy and after 3 and 6 months, blood samples were collected to assay DHT, Estradiol (E2), free testosterone (fT), as well as to assess lipid profile. Blood samples were drawn at 08:00 – 09:00 h, after an overnight fast; they were centrifuged at 3000
rpm for 10 min and serum was stored at −80°C until
assay. Each series of assays was performed in a single batch.
Total cholesterol (TC) and triglycerides, (TG) were assayed by an enzymatic-colorimetric reaction, employ-ing reagents from Boerhemploy-inger (Mannheim, FRG). HDL-C was assayed by the same procedure as TC, after precipitation of VLDL and LDL by phospho-tungstic acid and magnesium ions. HDL3-C was as-sessed on supernatant, after precipitation of LDL, VLDL and HDL2 with polyethylene glycol (PEG) at
concentration of 7 mmol/l (Immuno AG, Vienna, AU).
HDL2-C was obtained by calculating the difference between total HDL-C and the HDL3-C subclass. LDL-C was estimated by Friedewald formula [32].
Lp(a) was assayed by one step ELISA, employing reagents purchased from Immuno A.G. (Vienna, Aus-tria). Monospecific, polyclonal anti-apo (a) antibodies in solid phase were the capture antibodies, whereas the detection antibody was a monospecific and monovalent anti-apo (a) coupled with peroxidase. Reference materi-als were a mixture of 4 – 6 Lp(a) isoforms. Values have been expressed in terms of total lipoprotein mass, with
a minimum detection limit of approximately 10 mg/l.
Inter- and intra-assay coefficients of variation for three
concentrations of Lp(a) (110 mg/dl, 250 and 420 mg/l)
were respectively: 7.6, 6.9, 5.3 and 5.2, 5.5, 4.2%. FT, E2 and SHBG were assayed by a radioimmuno-logical procedure (RIA), employing reagents from Di-agnostic Products Corporation (Los Angeles, CA).
Minimum detection limits were: 0.52 nmol/l for fT,
29.36 pmol/l for E2 and 0.04 nmol/l for SHBG.
Inter-assay and intra-Inter-assay coefficients of variation for three
concentrations were: for fT (16, 67, 140 pmol/l), 5.5,
pmol/l) 14.0, 7.5, 9.0%; and 12.0, 5.2, 7.5%; for SHBG
(10.8, 64, 116 nmol/l), 3.1, 5.3, 6.9%; and 2.8, 3.0, 3.6%.
DHT also was determined by RIA, after extraction
of samples with a mixture ofn-exane and ethanol (98%
exane; 2% ethanol), employing a commercial kit from Diagnostic Products Corporation (Los Angeles, CA).
Minimum detection limit was 0.01 nmol/l. Inter-assay
and intra-assay coefficients of variation for three
con-centrations (0.33, 1.00, 2.36 nmol/l) were respectively:
8.5, 2.3, 8.4 and 6.2, 4.5, 3.1%.
On the same occasion of blood sample collection, a standardised interview was performed to exclude any possible substantial modification of lifestyle, in particu-lar smoking habits and exercise, and dietary habits, assessed by self-reported alcohol intake and 24-h recall. Nutrient intake was estimated by 24-h recall, using computerised food tables (Dieta 2000, Computek s.r.l. Verona, Italy).
In addition, an assessment of body composition was performed by both anthropometry and bio-impedance analysis (BIA). The following anthropometric measure-ments were taken: weight and height; skinfold thick-ness, measured in triplicate to the nearest 1 mm at triceps, biceps, subscapular and suprailiac sites with a Harpender skinfold caliper; circumferences, measured at waist, hip and thigh. From anthropometry the fol-lowing indexes were calculated: body mass index (BMI,
kg/m2) as the ratio between weight and height; fat mass
percent (FM%SKF), from four skinfold thickness, by Durnin and Womersley [33] and Siri equations [34]; the ratio of waist to hip circumferences (WHR). In addi-tion, whole body bioelectric resistance (R) was
mea-sured at 800mA and 50 kHz with a portable impedance
analyser (type BIA, Akern, Firenze, Italy). Resistance
(R), reactance (X) and the angular transformation of
the ratio of R to X, the phase angle (PA) were
regis-tered. From bioelectric parameters, fat mass percent was estimated by the equations developed by Segal et al. [35] or Deurenberg et al. [36], according to age under or over 62 years (FM%BIA).
Statistical analysis was performed by a computer employing the SPSS-X program (Statistical Package for the Social Sciences, University of Pittsburgh).
For each parameter, the normality of distribution by Lilliefors test was assessed, which showed a normal distribution for all variables with the exception of TG and Lp(a). For these variables, statistical analysis was performed by both non-parametric tests and parametric tests on log-transformed values. So, the differences from baseline during treatment were tested for signifi-cance by ANOVA for repeated measures, as well as Friedman test when appropriate. However, results were represented by non-transformed values.
Bivariate correlation analysis and stepwise multiple regression analysis were used to study the association among the absolute changes in lipid, hormone and body composition.
Finally, agglomerative hierarchical cluster analysis was employed to identify patient subsets according to their different responses in HDL subclasses. Also, the distance between cases was measured as the squared Euclidean distances and clusters were combined by the average linkage method.
3. Results
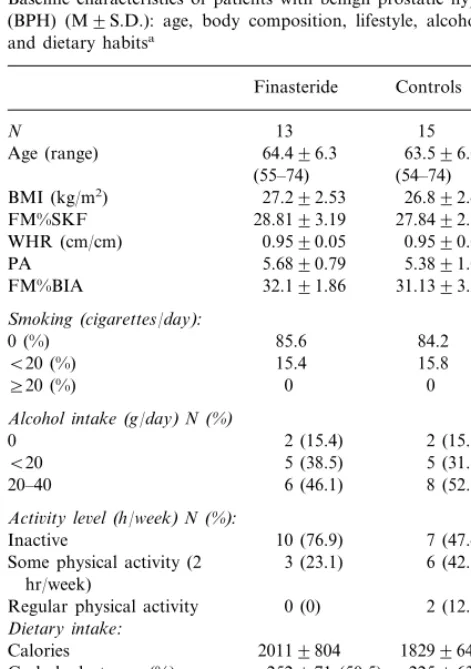
Table 1 shows baseline characteristics of patients with BPH, such as age, body composition parameters, lifestyle (self-reported smoking habits and exercise) and dietary habits (self-reported alcohol and nutrient in-take, estimated by 24-h recall). Some differences in dietary habits, especially in lipid intake, and activity
Table 1
Baseline characteristics of patients with benign prostatic hyperplasia (BPH) (M9S.D.): age, body composition, lifestyle, alcohol intake and dietary habitsa
Finasteride Controls
N 13 15
64.496.3 63.596.0 Age (range)
5.6890.79 5.3891.04 PA
32.191.86 31.1393.23 FM%BIA
Smoking(cigarettes/day):
0 (%) 85.6 84.2 Some physical activity (2 3 (23.1)
hr/week)
0 (0) 2 (12.3) Regular physical activity
Dietary intake:
Calories 20119804 18299640
252971 (50.5)
Carbohydrates gr (%) 225963 (49.2) 53921 (10)
Proteins gr (%) 74926 (16.2)
Fats gr (%) 74929 (33) 56917 (28.5) Alcohol gr (%) 19910.4 (6.5) 1699.2 (6.1)
0.490.1 0.690.1
P/S ratio
191967
Cholesterol (mg) 157963
aComparison between treated and control patients were made by
Mann–WhitneyUtest and thex2test, when appropriate. BMI, body
Table 2
Hormone levels (M9S.D.) at baseline and after 3 and 6 months of treatment with finasteride
3 months 6 months Baseline
DHT(nmol/l)
0.7690.32* 0.6390.19* Finasteride 1.5290.65
1.5290.65
1.5490.70 1.5590.32
Controls
fT(pmol/l)
Finasteride 58.4913.0 61.1910.5 56.6913.4 56.6914.8
Controls 58.8912.5 57.6912.0
E2 (pmol/l)
Finasteride 96.3931.7 103950.0 96.32945.9 94.5917.6
91.4920.9 95.3911.3
Controls
SHBG(nmol/l)
52.39920.2
Finasteride 53.00917.4 52.98924.8 69.02930.2 68.9933.4 68.5933.9
Controls
*PB0.01 vs. baseline.
for unpaired data andx2 test, as appropriate) excluded
that these differences were significant. As for lipo-proteins, baseline concentrations in treated and un-treated patients are represented in Table 3. No significant differences were apparent between treated and control subsets, although control patients showed slightly higher total and LDL-C levels. As expected, distribution of Lp(a) serum concentrations was typi-cally skewed toward the lower values. Overall, there were no differences between patients with BPH and free living control subjects of similar age (data not shown). After 3 and 6 months of treatment with finasteride, a significant decrease of DHT concentration was ob-served, respectively of 52 and 56%. On the contrary, no significant changes in fT, E2 and SHBG concentrations were found (Table 2).
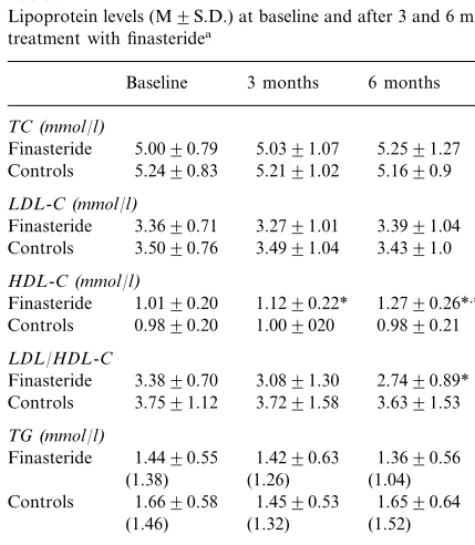
Therapy was associated with consistent changes in lipoproteins (Table 3), with a significant HDL-C in-crease of 9.6% at 3 months and of 24% at 6 months (vs.
no changes in control group). As a consequence, LDL/
HDL-C ratio significantly decreased by 19%. Also Lp(a) concentrations were significantly increased by 27% after 6-month therapy with finasteride.
No significant changes were apparent in most body composition parameters, especially in BMI and FM%, assessed by both anthropometry and BIA (Table 4) in both treated and control patients. Accordingly, no sig-nificant changes in smoking habits, activity level and dietary habits were detected (data not shown). How-ever, a slight but significant decrease of the bioelectric index PA became apparent after 6-month treatment with finasteride.
With the aim of further characterising the increase in HDL-C found after Finasteride, HDL2 and HDL3
Table 3
Lipoprotein levels (M9S.D.) at baseline and after 3 and 6 months of treatment with finasteridea
Baseline 3 months 6 months
TC(mmol/l)
5.0391.07 5.0090.79
Finasteride 5.2591.27
Controls 5.2490.83 5.2191.02 5.1690.9
LDL-C(mmol/l)
1.0190.20 1.1290.22* 1.2790.26*,***
Finasteride Controls 1.6690.58 1.4590.53 1.6590.64
(1.52)
Controls 1309148 1199125 1109104 (63.7) (65.8)
(64.3)
aFor triglyceride (TG) and lipoprotein (a) (Lp(a)) also median
values are represented (in brackets) *PB0.01 vs. baseline.
**PB0.05 vs. baseline. ***PB0.01 vs. 3 months. ****PB0.05 vs. 3 months.
Table 4
Body composition indexes at baseline and after 3 and 6 months of treatment with finasteride
6 months Baseline 3 months
BMI(kg/m2)
Finasteride 27.291.6 27.291.6 27.191.5
25.891.4 25.791.4
Placebo 25.891.3
FM%SKF
Finasteride 28.8193.19 28.3892.79 27.9992.70 Placebo 27.8492.56 27.2891.71 27.1891.58
WHR(cm/cm)
0.9690.05 0.9590.05
Finasteride 0.9790.05
0.96900.4
Placebo 0.9590.05 0.9790.03
PA
5.6890.89
Finasteride 5.6890.79 5.3090.73* Placebo 5.4891.04 5.4690.77 5.5290.55
FM%BIA
Finasteride 32.1091.86 32.391.56 32.3191.90
31.1393.23 30.4894.1
Placebo 30.693.6
*PB0.05 vs. baseline.
level, were apparent at baseline between treated and control groups, suggesting that they were not well
Fig. 1. High density lipoprotein-cholesterol (HDL-C) subclasses (M9S.E.) after 3 and 6 months of finasteride treatment.
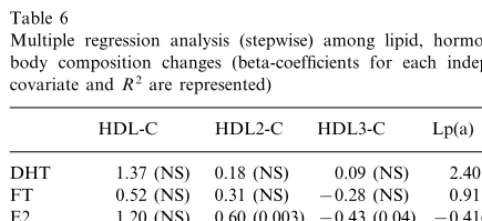
changes, documented both at 3 and 6 months were entered into the analysis. Also some body composition indexes were entered into analysis, as independent co-variates; as for FM%, estimates from BIA were used instead of FM%SKF, since BIA is generally considered as more accurate than anthropometry to estimate fat mass in aged people [37]. The analysis did not show any association of total HDL-C and Lp(a) increases to hormones or nutritional status (Table 5). However, an association of HDL subfractions with fT and E2 changes, positive for HDL2-C and negative for HDL3-C, was found. Multiple regression analysis (stepwise) confirmed the lack of any associations between lipo-protein increase and DHT declines, as well as the slight but significant contribution of E2 to HDL2 and HDL3 changes (respectively of 36 and 19%). On the contrary, the association of HDL subfractions with fT apparent at bivariate correlation analysis was no more significant (Table 6).
However, considering individual responses to ther-apy, some variability was found in HDL subclass
re-sponses to finasteride. Therefore, agglomerative
hierarchical cluster analysis was performed. Two differ-ent classes of patidiffer-ents were iddiffer-entified: seven patidiffer-ents (cluster I) showed a prevalent increase in HDL2-C, while in the others (cluster II), an increase of HDL3-C associated with a decrease in HDL2-C was apparent. Relative changes in DHT were not different between the two clusters (Table 7), but some differences in E2 and fT were found: in patients showing an increase of HDL2-C (Cluster I), an increase of fT and E2 was apparent, while the preferential increase of HDL3-C, with its accompanying decline in HDL2-C (Cluster II), was associated with a decrease of both fT and E2.
4. Discussion
In the present study, the inhibition of T conversion to DHT induced by finasteride in elderly men with BPH, was associated with significant changes in lipo-protein profile, mainly an increase in HDL-C and Lp(a). These results are in agreement with previous reports showing that androgen administration can re-duce Lp(a) [10 – 12] and HDL-C concentrations [3 – 9] (likely via stimulation of the enzyme HL, devoted to HDL catabolism in liver). Studies on castration, both surgical and chemical, demonstrated that these effect on lipid metabolism are also exerted by endogenous androgens, since androgen deprivation is generally as-sociated with increase of HDL-C, ApoAI [16 – 20] and Lp(a) [20,38]. However, these studies did not clarify
how endogenous testosterone can affect lipid
metabolism. Indeed, it has not yet been assessed whether it needs to be converted to DHT, as it occurs at the level of other androgen targets. A proper
experi-Table 5
Bivariate correlation analysis on the absolute changes of lipoproteins, hormones, sex hormone binding hormone (SHBG) and body compo-sition indexes
Lp(a) HDL3-C
HDL2-C HDL-C
0.28 (NS)
DHT −0.11 (NS) 0.20 (NS) 0.02 (NS) 0.13 (NS) 0.65 (0.001) −0.43 (0.03) 0.33 (NS) FT
0.07 (NS) 0.59 (0.003)
E2 −0.53 (0.007) −0.12 (NS)
0.16 (NS) −0.10 (NS) 0.41 (NS)
SHBG −0.10 (NS)
0.45 (NS) −0.40 (NS)
BMI −0.01 (NS) 0.11 (NS)
0.20 (NS)
FM%BIA 0.20 (NS) −0.09 (NS) 0.22 (NS)
−0.08 (NS)
WHR 0.45 (0.03) −0.38 (NS) 0.13 (NS)
Table 6
Multiple regression analysis (stepwise) among lipid, hormone and body composition changes (beta-coefficients for each independent covariate andR2are represented)
HDL-C HDL2-C HDL3-C Lp(a)
0.09 (NS)
0.18 (NS) 2.40 (NS)
1.37 (NS) DHT
0.52 (NS) 0.31 (NS)
FT −0.28 (NS) 0.91 (NS)
0.60 (0.003)
E2 1.20 (NS) −0.43 (0.04) −0.41(NS) 0.27 (NS) 0.09 (NS)
SHBG −0.10 (NS) 0.01 (NS)
BMI −0.541 (NS) 0.12 (NS) −0.25 (NS) −0.29 (NS)
−0.11 (NS) 0.20 (NS)
0.25 (NS)
FM%BIA 0.14 (NS)
1.02 (NS) 0.33 (NS) −0.46 (NS) 1.90 (NS) WHR
– 0.36
R2 0.19 –
were assayed in treated patients. As shown in Fig. 1, mean HDL-C increase turned out to be mostly due to increase of the HDL3 subfraction, while HDL2-C levels did not change significantly.
mental model to address this issue is represented by therapy with an inhibitor of liver 5 alpha-reductase, such as finasteride. In this view, the results of this study, in addition to confirming the influence of en-dogenous testosterone on HDL and Lp(a), could repre-sent the first evidence in vivo that it is exerted not by testosterone itself, but by DHT.
However, these results cannot be considered as con-clusive. First of all, in the study, lipoprotein and DHT changes were not related. Actually, peripheral DHT concentrations could not be a reliable index of the actual extent of intrahepatic alpha-reductase inhibition induced by finasteride, so that the lack of any statistical association between lipid and DHT changes does not necessarily mean the lack of any relation between them. Furthermore, the small number of patients [13] could obscure associations between DHT and lipoproteins, that would be significant with a larger sample size. However, a direct effect of finasteride on liver, indepen-dent of hormone changes, cannot be excluded.
Secondly, the analysis of HDL subfractions showed two different patterns of HDL increase. A prevalent increase of HDL2 that is generally considered as an index of HL inhibition [39] was found in seven patients. On the contrary, the remaining six patients showed a prevalent increase of HDL3-C, inversely related to HDL2-C that might be due to some other mechanisms than HL inhibition. These differences in the responses of HDL subclasses further support the possibility that lipoprotein changes after finasteride therapy could be viewed not only as the results of hormonal changes, but also of some other direct effects on liver. However, a preferential decrease of HDL3 subfraction, without any significant changes in HDL-2, has been recently re-ported after T supplementation in hypogonadal men [9]. Furthermore, in the present study, HDL subclass changes turned out to be related to estrogens, with HDL2-C positively and HDL3-C negatively correlated to E2. This finding suggests that in man, as in woman,
endogenous estrogens play some role in HDL
metabolism and that even slight changes in E2 concen-tration can be associated with changes in HDL metabolism. However, in this study, regression analysis showed that E2 accounted for the variability of changes in HDL subclasses to a little extent (36% for HDL2-C
and 18% for HDL3-C).
Finally, these results are in contrast with previous studies on the metabolic effects of finasteride in short-term [40] and long-short-term administration [41], showing no significant effects on lipoproteins. Actually, a com-plete assessment of lipoprotein profile, comprehensive of cholesterol subfractions, has been performed only in one study [40] and after short-term treatment (11 days). It is likely that more prolonged treatments are needed for lipoprotein changes to become apparent and that these occur not for total cholesterol, but for HDL-C only.
Furthermore, interpretation of these results must take into account some methodological limitations of
the study. Indeed, hormone and/or drug effects on
lipids can be interfered by other factors able to inde-pendently influence lipoprotein metabolism, mainly HDL metabolism.
The lack of any concomitant changes in body com-position, suggests the independence of lipid changes from nutritional status. Similarly, the results of multiple regression analysis, exclude any contribution of nutri-tional status on HDL-C and Lp(a) absolute changes. As for other factors, such as smoking habits, activity level and diet, one tried to reduce their potential inter-ference by simply asking all patients not to change their lifestyle throughout the experimental period. Their ad-herence to this specific aspect of the study protocol was assessed by a standardised interview and a 24-h recall, performed at baseline and repeated at 3 month interval, on each occasion of blood sample collection. Indeed, by these methods, patients turned out to have fulfilled the specific request of maintaining their habits throughout the study period, since no consistent changes were apparent. In view of this, physical activity and dietary intake have not been entered into the subsequent
analy-sis (correlation, multiple regression and cluster
analysis).
However, it cannot be excluded that more accurate and sensitive methods to represent activity level and dietary habits, such as a more detailed questionnaire on activity or multiple-day recall of diet, would have re-vealed subtle changes able to contribute to lipid modifi-cations. Indeed, intra-individual (day-to-day and other time-related) variation in diet makes a single 24-h recall
Table 7
Cluster analysis according to high density lipoprotein (HDL) subclass responses to finasteride: mean9S.D. relative changes of lipid, hormone and sex hormone binding hormone (SHBG) levels in the two patient subsets identified
HDL2% HDL3%
HDL2% HDL3% HDL% DHT% FT% E2%
(6 months) (6 months) (6 months)
(3 months) (6 months) (3 months) (6 months) (6 months)
93919 115920 127918 44.7915.3 109925 123930 149945
129930 Cluster I (7)
171918
Cluster II (5) 78917 70912 175922 114910 42.798.5 87920 81921
NS NS
NS NS
0.0002
0.06 0.000
inappropriate for estimation of an individual custom-ary intake [42].
Furthermore, some differences in dietary habits, es-pecially in lipid intake and activity level, although not significant, were apparent at baseline between treated and control groups, suggesting that they were not well matched. In this case also, more accurate meth-ods could have been useful to better assess if control and treated patients were actually well matched for lifestyle.
Finally, the effects of treatment on body composi-tion deserve some further consideracomposi-tion. Body
compo-sition was considered not only to verify the
independence of changes in lipoproteins induced by therapy, but also as one of the possible targets of androgens. Indeed, in experimental animals also, an-drogen receptors have been identified in adipose and muscle tissues, and testosterone has been shown to directly interact with them [30].
Several reports are available showing that BIA can
detect changes in body composition due to diet and/
or exercise, even in the short term [43,44]. So, BIA has been employed to assess the effects on nutritional status of hormone treatments, such as growth hor-mone replacement [45] or androgen supplementation [46]. In the present study, no significant changes were found in body compartments, except for a decrease in the bioelectric phase angle (PA), an index of the ratio between intra- and extracellular fluids, and, hence, positively related to intracellular water content [47]. Since muscle tissue gives the major quantitative con-tribution to intracellular water content, PA decrease in response to DHT decline could indicate a decrease of muscle cellular mass, although FFM as a whole did not change. However, it is possible that employ-ing techniques more accurate than anthropometry and BIA to assess body composition, such as Dual X-ray absorbiometry (DEXA), could have led to different conclusions. Furthermore, it is likely that more con-sistent changes in body compartments could become apparent after more prolonged treatment.
In conclusion, this study demonstrates that 5 alpha-reductase inhibition by finasteride can be associated with significant changes in lipoproteins. These modifi-cations are mostly beneficial, leading to an
improve-ment of the LDL/HDL-C ratio, although a
concomitant slight increase of Lp(a) does occur. These findings suggest that the effects of endogenous androgens on HDL and Lp(a) are exerted after T conversion to DHT. However, by the data, these ef-fects cannot be definitively attributed to the changes in DHT synthesis induced by finasteride, since a di-rect and non-specific interference of the drug on liver metabolism cannot be excluded.
References
[1] Dawber TR. The Framingham Study: The Epidemiology of Atherosclerotic Disease. Cambridge, MA: Harvard University, 1980:59 – 75.
[2] Heiss G, Tamir I, Davis CE, Tyroler HA, Rifkind BM, Schon-feld G, Jacobs D, Frantz ID Jr. Lipoprotein-cholesterol distribu-tions in selected North American population: The Lipid Research Clinics Program Prevalence Study. Circulation 1980;61:302 – 15.
[3] Sorva R, Kussi T, Taskinen MR, Perheentupa J, Nikkila EA. Testosterone substitution increases the activity of lipoprotein lipase and hepatic lipase in hypogonadal males. Atherosclerosis 1988;69:191 – 7.
[4] Thompson PD, Cullinane EM, Sady SP, Chenevert C, Saritelli AL, Sady MA, Herbert PN. Contrasting effects of testosterone and stanazolol on serum lipoproteins levels. J Am Med Assoc 1989;261:1165 – 8.
[5] Asscheman H, Gorren LJ, Megens JA, Nauta J, Kloosterboer HJ, Eikelboom F. Serum testosterone level is the major determi-nant of the male-female differences in serum levels of high density lipoprotein (HDL) cholesterol and HDL2 cholesterol. Metabolism 1994;43:935 – 9.
[6] Meriggiola MC, Marcovina S, Paulsen CA, Bremner WJ. Testosterone enanthate at a dose of 200 mg/week decreases HDL-cholesterol levels in healthy men. Int J Androl 1995;18:237 – 42.
[7] Anderson RA, Wallace EM, Wu FC. Effect of testosterone enanthate on serum lipoproteins in man. Contraception 1995;52:115 – 9.
[8] Tan KCB, Shiu SWM, Pang RWC, Kung AWC. Effects of testosterone replacement on HDL subfractions and apoliprotein AI containing lipoproteins. Clin Endocrinol 1988;48:187 – 94. [9] Jockenhovel F, Bullmann C, Schubert M, Vogel E, Reinhardt
W, Reinwein D, Muller-Wieland D, Krone W. Influence of various modes of androgen substitution on serum lipids and liporpoteins in hypogonadal men. Metabolism 1999;48:590 – 6. [10] Farish E, Rolton HA, Barnes JF, Hart DM. Lipoprotein (a)
concentrations in postmenopausal women taking norethisterone. Br Med J 1991;303:694.
[11] Albers JJ, Taggart HM, Applebaum-Bowden D, Haffner S, Chesnut CH, Hazzard WR. Reduction of the lecithin-cholesterol acyltransferase apolipoprotein D and Lp(a) with the anabolic steroid stanazolol. Biochem Biophys Acta 1984;795:293 – 6. [12] Crook D, Sidhui M, Seed M, O’Donnel M, Stevenson JC.
Lipoprotein Lp(a) levels are reduced by danazol an anabolic steroid. Atherosclerosis 1992;92:41 – 7.
[13] Berg K. A new serum type system in man — the Lp(a) system. Acta Pathol Microbiol Scand 1963;59:369 – 82.
[14] Morrisett JD, Guyton JR, Gaubatz JW, Gotto AM Jr. Lipo-protein Lp(a): structure metabolism and epidemiology. In: Gotto AM Jr, editor. Plasma Lipoproteins. Amsterdam: Elsevier, 1987:129 – 52.
[15] Utermann G. The mysteries of lipoprotein (a). Science 1989;246:904 – 10.
[16] Goldberg RB, Rabin D, Alexander AN, Doelle GC, Gets GS. Suppression of plasma testosterone leads to an increase in serum total and high density lipoprotein cholesterol and apoproteins A-I and B. J Clin Endocrinol Metab 1981;60:203 – 7.
[17] Wallentin L, Varenhorst E. Plasma lipoproteins during antian-drogen treatment by estrogens or orchidectomy in men with prostatic carcinoma. Horm Metab Res 1981;13:293 – 7. [18] Moorjani S, Dupont A, Labrie F, Lupien PJ, Cagne´ C, Brun D,
combination treatment with luteinizing hormone-realising hor-mone agonist and flutamide. J Clin Endocrinol Metab 1988;66:314 – 21.
[19] Bagatell CJ, Knippo RH, Vale WW, Rivier JE, Bremner WJ. Physiologic testosterone levels in normal men suppress high density lipoprotein levels. Ann Intern Med 1992;116:967 – 73. [20] Denti L, Pasolini G, Cortellini P, Ferretti S, Sanfelici L, Ablondi
F, Valenti G. Effects of androgen suppression by gonadotropin-releasing hormone agonist and flutamide on lipid metabolism in men with prostate cancer: focus on lipoprotein (a). Clin Chem 1996;42:1176 – 81.
[21] Oppenheim DS, Greenspan SL, Zervas NT, Schoenfeld DA, Klibanski A. Elevated serum lipids in hypogonadal men with and without hyperprolactinemia. Ann Intern Med 1989;111:288 – 92.
[22] Lichtenstein MJ, Yarnell JW, Elwood PC, Beswick AD, Sweet-nam PM, Marks V, Teale D, Riad-Fahmy D. Sex hormones, insulin, lipids, and prevalent ischemic heart disease. Am J Epi-demiol 1987;126:647 – 57.
[23] Barrett-Connor E. Lower endogenous androgen levels and dys-lipidemia in men with non-insulin-dependent diabetes mellitus. Ann Intern Med 1992;117:807 – 11.
[24] Haffner SM, Mykkanen L, Valdez RA, Katz MS. Relationship of sex hormones to lipids and lipoproteins in nondiabetic men. J Clin Endocrinol Metab 1993;77:1610 – 5.
[25] Phillips GP, Pinkernell BH, Jing TY. The association of hy-potestosteronemia with coronary disease in men. Arterioscler Thromb 1994;14:701 – 6.
[26] Semmens J, Rouse I, Beilin LJ, Masarei JR. Relationship of plasma HDL cholesterol to testosterone, estradiol, and sex hor-mone globulin levels in men and women. Metabolism 1983;32:428 – 32.
[27] Stefanick ML, Williams PT, Krauss RM, Terry RB, Vranizan KM, Wood PD. Relationship of plasma estradiol, testosterone, and sex hormone binding globulin with lipoproteins, apolipo-proteins, and high density lipoprotein subfractions in men. J Clin Endocrinol Metab 1987;64:723 – 9.
[28] Haffner SM, Mykkanen L, Gruber KK, Rainwater DL, Laakso M. Lack of association between sex hormones and Lp(a) concen-trations in American and Finnish men. Arterioscler Thromb 1994;14:19 – 24.
[29] Denti L, Pasolini G, Ablondi F, Valenti G. Correlation between plasma lipoprotein Lp(a) and sex hormone concentrations: a cross sectional study in healthy males. Horm Metab Res 1994;26:602 – 8.
[30] Mooradian AD, Morley JE, Korenman SG. Biological actions of androgens. Endocr Rev 1987;8:1 – 28.
[31] Gormley GJ, Stoner E, Bruskewitz RC, Imperato-McGinley J, Walsh PC, McConnell JD, Andriole GL, Geller J, Bracken BR, Tenover JS. The effects of finasteride in men with benign pro-static hyperplasia. The Finasteride Study Group. N Engl J Med 1992;327:1185 – 91.
[32] Friedwald WT, Levy RI, Fredrickson DS. Estimation of the concentration of low-density lipoprotein cholesterol in plasma
without use of the preparative ultracentrifuge. Clin Chem 1972;18:499 – 502.
[33] Durnin J, Womersley J. Body fat assessed from total body density and its estimation from skinfold thicknesses: measure-ments on 481 men and women aged 16 to 72 years. Br J Nutr 1974;32:77 – 97.
[34] Siri WB. Gross composition of the body. In: Tobias CA, Lau-rence JH, editors. Advances in Biological and Medical Physics, vol. 4. New York: Academic Press, 1956:239 – 80.
[35] Segal KR, Van Loan MD, Fitzgerald PI, Hogdon JA, Van Itallie TB. Lean body mass estimation by bioelectrical impedance anal-ysis: a four site cross-validation study. Am J Clin Nutr 1988;47:7 – 14.
[36] Deurenberg P, Van der Kooij K, Evers P, Hulshof T. Assess-ment of body composition by bioelectric impedance in a popula-tion aged\60 years. Am J Clin Nutr 1990;51:3 – 6.
[37] Chumlea WC, Guo SS, Kuczmarski RJ, et al. Biolectric and anthropometric assessment and reference data in the elderly. J Nutr 1993;123:449 – 53.
[38] Henriksson P, Angelin B, Berglund L. Hormonal regulation of serum Lp(a) levels opposite effects after estrogen treatment and orchidectomy in males with prostatic carcinoma. J Clin Invest 1992;89:1166 – 71.
[39] Kuusi T, Saarinen P, Nikkila EA. Evidence for the role of hepatic endothelial lipase in the metabolism of plasma high density lipoproteins in man. Atherosclerosis 1980;36:589 – 93. [40] Gormley GJ, Stoner E, Rittmaster RS, Gregg H, Thompson DL,
Lasseter KC, Vlasses PH, Stein EA. Effects of finasteride (MK-906), a 5 alpha-reductase inhibitor, on circulating androgens in male volunteers. J Clin Endocrinol Metab 1990;70:1136 – 41. [41] Stoner E. The clinical effects of a 5 alpha-reductase inhibitor,
finasteride, on benign prostatic hyperplasia: the Finasteride Study Group. J Urol 1992;147:1298 – 302.
[42] Reuben DB, Greendale GA, Harrison GG. Nutrition screening in older persons. J Am Geriatr Assoc 1995;43:415 – 25. [43] Evans EM, Saunders MJ, Spano MA, Arngrimsson SA, Lewis
RD, Cureton KJ. Body composition changes with diet and exercise in obese women: a comparison of estimates from clinical methods and a 4-component model. Am J Clin Nutr 1999;70:5 – 12.
[44] Utter AC, Nieman DC, Ward AN, Butterworth DE. Use of leg-to-leg bioelectrical impedance method in assessing body com-position change in obese women. Am J Clin Nutr 1999;69:603 – 7.
[45] Valk NK, v d Lely AJ, de Herder WW, Lindemans J, Lamberts SW. The effects of human growth hormone (GH) administration in GH-deficient adults: a 20-day metabolic ward study. J En-docrinol Metab 1994;79:1070 – 6.
[46] Sih R, Morley JE, Kaiser FE, et al. Testosterone replacement in older hypogonadal men: a 12-month randomized controlled trial. J Clin Endocrinol Metab 1997;82:1661 – 7.
[47] Baumgartner RN, Chumlea WC, Roche AF. Bioelectric impedance phase angle and body composition. Am J Clin Nutr 1988;48:16 – 23.