CHAPTER IV
RESEARCH FINDING AND DISCUSSION
This chapter presents the research finding and the discussion that include the description of the data, the hypothesis testing and discussion.
A. The Description of Data
In this section, the writer presented the students’ achievement taught by
using authentic material and taught without using authentic material. The researcher presented and analyzed the data through two kinds of tests, they were pre-test and post test. Those tests were conducted to the experimental group and control group. The experimental group, which was treated by using authentic material, was class C. Meanwhile, the control group was class D that was taught without using authentic material. The collected data were described in form of table. It included the table of the pre-test and post -test score both experimental and control group.
1. Pre-Test and Post Test Score of Students in Experimental Group Here is the description of the data that were gotten from the score of the students who got the treatment using authentic material. They were in
experimental group. The data showed in form of tables to ease to analyse.
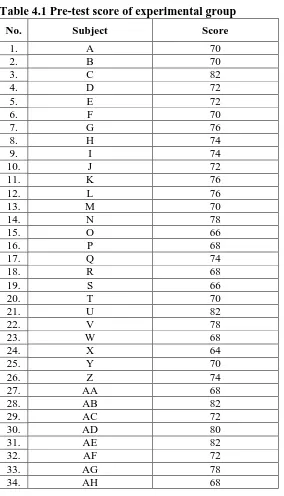
Table 4.1 Pre-test score of experimental group
No. Subject Score
1. A 70
2. B 70
3. C 82
4. D 72
5. E 72
6. F 70
7. G 76
8. H 74
9. I 74
10. J 72
11. K 76
12. L 76
13. M 70
14. N 78
15. O 66
16. P 68
17. Q 74
18. R 68
19. S 66
20. T 70
21. U 82
22. V 78
23. W 68
24. X 64
25. Y 70
26. Z 74
27. AA 68
28. AB 82
29. AC 72
30. AD 80
31. AE 82
32. AF 72
33. AG 78
34. AH 68
35. AI 66
36. AJ 70
37. AK 70
Total score 2688
The table above showed the students’ score in reading comprehension
before taught using authentic material. The next table contained the students’ score after being taught by using authentic material.
Table4.2 Post-Test Score of Experimental Group
No. Subject Post-test score
1. A 68
2. B 80
3. C 84
4. D 80
5. E 74
6. F 84
7. G 72
8. H 66
9. I 76
10. J 74
11. K 84
12. L 82
13. M 76
14. N 74
15. O 84
16. P 88
17. Q 78
18. R 88
19. S 84
20. T 68
21. U 80
22. V 74
23. W 72
24. X 82
25. Y 86
26. Z 76
27. AA 78
28. AB 80
29. AC 84
30. AD 74
31. AE 82
32. AF 76
33. AG 76
34. AH 82
35. AI 70
36. AJ 84
37. AK 84
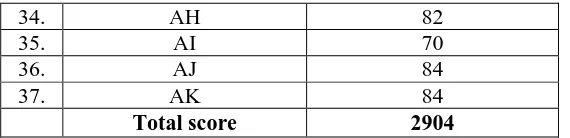
Total score 2904
The tables above showed the pre test score and post-test score of experimental group. The total score of the pre-test of experimental group were 2688, while the total score of post-test were 2904. The above result showed that there was different score between pre-test and post-test sore of experimental group about 216.
2. Pre-Test and Post Test Score of Students in Control group
The tables below described the data of students’ score in reading comprehension in control group. The students in this group did not get treatment using authentic material.
Table 4.3 Pre-Test Score of Control Group
No. Subject Score
1. A 76
2. B 62
3. C 60
4. D 72
5. E 80
6. F 68
7. G 82
8. H 60
9. I 86
10. J 74
11. K 70
12 L 62
13. M 82
14. N 68
15. O 66
16. P 78
17. Q 80
18. R 68
19. S 74
20. T 72
21 U 60
22. V 78
23. W 72
24. X 64
25. Y 60
26. Z 78
27. AA 82
28. AB 88
29. AC 76
30. AD 78
31. AE 60
32. AF 66
33. AG 76
34. AH 72
35. AI 82
36. AJ 80
37. AK 66
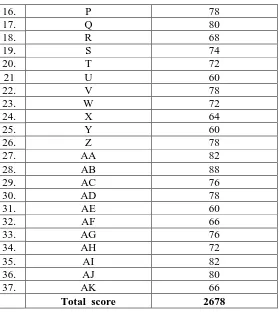
Total score 2678
The table above showed the students’ score in reading comprehension
before taught without using authentic material. While the next table was the student’s score after taught without using authentic material.
Table 4.4 Post–test Score of Control Group
No. Subject Score
1. A 84
2. B 72
3. C 84
4. D 84
5. E 84
6. F 8 0
7. G 80
8. H 84
9. I 86
10. J 88
11. K 80
12 L 82
Continuation
13. M 72
14. N 82
15. O 80
16. P 72
17. Q 86
18. R 80
19. S 86
20. T 74
21 U 80
22. V 82
23. W 68
24. X 82
25. Y 78
26. Z 78
27. AA 72
28. AB 86
29. AC 82
30. AD 70
31. AE 84
32. AF 88
33. AG 76
34. AH 70
35. AI 78
36. AJ 78
37. AK 86
Total Score 2958
The tables above showed the pre-test and post-test result of control group. The total score of the pre-test were 2678. Meanwhile the total score in post-test were 2958. From the result, it showed that there was different score between pre-test and post-pre-test of control group about 280.
The next step for this study was analyzing the different score of the students taught by using authentic and taught without using authentic material.
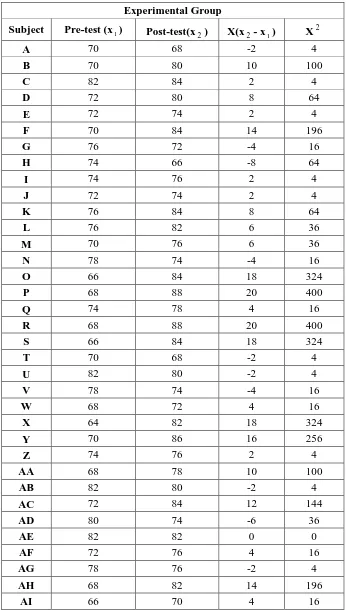
Table 4.5 The Result of Experimental Group
Experimental Group
Subject Pre-test (x1) Post-test(x2) X(x2- x
1) X 2
A 70 68 -2 4
B 70 80 10 100
C 82 84 2 4
D 72 80 8 64
E 72 74 2 4
F 70 84 14 196
G 76 72 -4 16
H 74 66 -8 64
I 74 76 2 4
J 72 74 2 4
K 76 84 8 64
L 76 82 6 36
M 70 76 6 36
N 78 74 -4 16
O 66 84 18 324
P 68 88 20 400
Q 74 78 4 16
R 68 88 20 400
S 66 84 18 324
T 70 68 -2 4
U 82 80 -2 4
V 78 74 -4 16
W 68 72 4 16
X 64 82 18 324
Y 70 86 16 256
Z 74 76 2 4
AA 68 78 10 100
AB 82 80 -2 4
AC 72 84 12 144
AD 80 74 -6 36
AE 82 82 0 0
AF 72 76 4 16
AG 78 76 -2 4
AH 68 82 14 196
AI 66 70 4 16
AJ 70 84 14 196
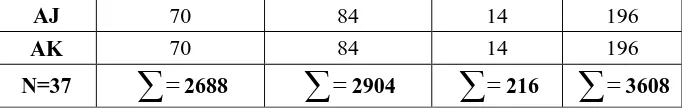
AK 70 84 14 196
N=37
2688
2904
216
3608Table 4.6 The Result of Control Group
Control Group
Subject Pre-test(y1) Post-test (y2) Y(y2- y1) Y2
A 76 84 8 64
B 62 72 10 100
C 60 84 24 576
D 72 84 12 144
E 80 84 4 16
F 68 80 12 144
G 82 80 -2 4
H 60 84 24 576
I 86 86 0 0
J 74 88 14 196
K 70 80 10 100
L 62 82 20 400
M 82 72 -10 100
N 68 82 14 196
O 66 80 14 196
P 78 72 -6 36
Q 80 86 6 36
R 68 80 12 144
S 74 86 12 144
T 72 74 2 4
U 60 80 20 400
V 78 82 4 16
W 72 68 -4 16
X 64 82 18 324
Y 60 78 18 324
Z 78 78 0 0
AA 82 72 -10 100
AB 88 86 -2 4
AC 76 82 6 36
AD 78 70 -8 64
1. Mean of pre-test score of experimental group
2
2. Mean of post-test of experimental group
2
3. Mean of pre-test of control group
1
5. The mean of experimental group
=
85,723
0,054
73 , 1
=
629 , 4
73 , 1
=
-151 , 2
73 , 1
= - 0,804
The minus mark here is not an algebra mark. Therefore, with t= -0,804, it could be read as there is difference 0,804.
To know the degree of freedom, we can find the result from the formula below:
Df = (Nx + Ny - 2) = (37+ 37 – 2) = 72
The t table can be found from the table of “t” score. Because it cannot be found the df 72, the df score that nearest with 72, that is 70 should be used. With df 70, it was gained the t table score in significance level 5%; t table =2, 00.
B. Hypothesis testing
From the data analysis, it could be identified that:
1. When the value of t count > t table, the significant level was 5 %, it meant that Ho was rejected. In the other hand, Ha was accepted.
2. When the value of t count < t table, the significant level was 5%, it meant H
0
Based on the statistical analysis using t-test formula, it showed that t count score was 0,804 while the t-table’s score with the degree of freedom 70 was 2, 00 for significant level 5%.
Because the t count that had been gained 0,804, while the t table=2, 00 so, the t count is less than t table, in significance level 5 %. Therefore, the null hypothesis that states there is no significant difference score between the students taught by using authentic material and taught without using authentic material was accepted. On the other hand, the Ha was rejected. It could be concluded that there was no significant effect of using authentic material to improve reading comprehension achievement of the third grade students of SMPN 3 Tasikmadu.
C. Discussion
The use of t-test formula was to check the significant difference of scores achieved by the experimental group and the control group. The statistical analysis showed difference between those taught using authentic material and taught without authentic material.
The above tables showed that the mean of pre-test and post-test result of experimental group were72.648 and 78.486. Hence, the difference of both scores was 5,838. Meanwhile, the pre-test and post test score of control group were 72,378 and 79, 94 with the difference 7,562.
more than the control group. Meanwhile the mean of post-test score of experimental group were 78,486 and the mean of post-test for the control group were 79, 94. It meant that the control group achieved the higher score with the difference about 1,454. Therefore, the overall mean for the control group were 7,567 and the mean for the experimental group were 5,837. The score difference of both groups were 1, 73. In addition, the higher mean score was gained by the control group, which did not get treatment using authentic material.
Based on the result of the statistical analysis using t test, the result of t count or the different mean between control group and experimental group is 0,804. If the value was compared with the t table with degree of freedom 72 as stated in hypothesis testing, the t count 0,804 was less than the t table 2, 00. Therefore, based on the hypothesis testing, the Ho was accepted and the Ha was rejected. It meant the use of authentic material in improving student’s reading
achievement was not effective.
The result of the study was not in line with the theory that stated by Nuttal in Cahyono (2010:57), “Authentic texts can be motivating because they are proof that the language is used for real life purposes by real people.” According to
Gerhard, (1996) authentic materials and media can reinforce students toward the direct relation between the language classroom and the outside world. In addition, authentic materials and media offer a way to contextualize language learning.
direct the language in the classroom and the outside world. Therefore, it was assumed that if the students were motivated by the use of authentic materials, their achievement would be improved.
However, the authentic material also had disadvantages that possibly could not give the positive effect in using it. According to Gerhard (1996), one disadvantage is that it takes time an effort to locate authentic materials. Next disadvantage is that it is sometimes difficult to make authentic materials and media comprehensible to the students. Other disadvantage is that some students will not accept authentic materials and media as being learning source.