Soil carbon stocks and forest biomass following conversion of pasture to
broadleaf and conifer plantations in southeastern Brazil
Rachel L. Cook
a,⇑, Dan Binkley
b, João Carlos T. Mendes
c, Jose Luiz Stape
a,c aDepartment of Forestry and Environmental Resources, North Carolina State University, Raleigh, NC 27695, United States bDepartment of Ecosystem Science and Sustainability, Colorado State University, Fort Collins, CO 80523, United States cDepartment of Forest Sciences, University of Sao Paulo, Piracicaba, Sao Paulo 13419, Brazila r t i c l e
i n f o
Article history: Received 7 January 2014
Received in revised form 10 March 2014 Accepted 11 March 2014
Keywords: Soil carbon Biomass
Tropical plantations Brazil
a b s t r a c t
Increased soil carbon sequestration can potentially mitigate CO2emission and can indicate sustainable forest management. This study aims to determine the relative influence of commercial plantation tree species on soil carbon following establishment on former tropical pastures. Soil carbon (organic horizon plus mineral soil from 0 to 45 cm) and stemwood productivity were quantified from 6 to 34 year-old conifer and broadleaf plantations in a sandy Oxisol (Typic Hapludox) in southeastern Brazil. Study plots consisted of ten pastures paired with broadleaf plantations and ten additional broadleaf plantations paired with conifer plantations. Pastures primarily consisted ofBrachiaria decumbensStapf., while broad-leaf plantations were primarilyEucalyptus, but also included one plot each of three other broadleaf species. Conifer stands were made up ofPinusspecies. Average stemwood productivity (± standard error) was 9.7 (±1.0) Mg C ha 1yr 1for broadleaf and 5.7 (±0.5) Mg C ha 1yr 1for conifer plantations, but did not correlate to soil C. The soil C in the paired Pasture–Broadleaf plots averaged 36.0 ± 1.7 Mg C ha 1in pastures and 36.8 ± 1.9 Mg C ha 1 in broadleaf plantations. The Broadleaf–Conifer plots averaged 38.3 ± 1.9 Mg C ha1for broadleaf plantations and 36.0 ± 1.6 Mg C ha 1for conifers. Our results show little difference in soil C across vegetation types, providing evidence that conifer and broadleaf planta-tions overall maintain similar levels of soil carbon to pasture land-use up to 34 years following land conversion. Soil C differences between Pasture–Broadleaf pairs indicated a small decline in soil C accretion early after plantation establishment, followed by recovery to slightly higher accretion rates.
Ó2014 Elsevier B.V. All rights reserved.
1. Introduction
Soils store more carbon than the atmosphere and plant biomass combined (Jobbágy and Jackson, 2000). Increasing soil organic carbon can improve soil quality, thereby acting as an indicator for sustainable land use practices, and can potentially contribute to mitigating climate change (Schoenholtz et al., 2000; Pan et al., 2011). When conditions allow for the accumulation of carbon in soils from roots and plant litter, soil quality improves with increased cation exchange capacity (CEC), aggregation, water-holding capacity, infiltration, microbial diversity, and pH-buffering capacity (Lal, 2004). Enhancing soil carbon accumulation is partic-ularly important in soils where inherent fertility has been depleted
through natural weathering processes or erosion, as is often the case in the tropics and subtropics (Batjes and Sombroek, 1997; Maquere et al., 2008; Zinn et al., 2002).
Conversion of forests to agricultural land depletes soil carbon concentrations by 20–50% on average (Post and Mann, 1990; Guo and Gifford, 2002; Laganiére et al., 2010). Forest establishment on agricultural land may increase soil carbon sequestration (Lal, 2005) but interactions of many factors lead to high variation among case studies and limited ability to predict responses.
Trends from meta-analyses indicate that establishment of Euca-lyptusandPinusplantations increases soil carbon stocks by about 12% over former agricultural land, defined as land used for the production of food or fiber, permanent pastures, and mixed crop and pasture (Laganiére et al., 2010), but may range from 35% to 282% relative soil C change from grassland to secondary forest (Don et al., 2011). In Brazil, forest plantation establishment has shown variable results. Soil carbon was found to remain constant after native savannah was replaced with Eucalyptusplantations on loamy and clay soils in central Brazil (Neufeldt et al., 2002;
http://dx.doi.org/10.1016/j.foreco.2014.03.019 0378-1127/Ó2014 Elsevier B.V. All rights reserved.
⇑ Corresponding author. Present address: Department of Plant, Soil, and Agricul-tural Systems, Southern Illinois University, 1205 Lincoln Drive, Mailcode 4415, Carbondale, IL 62901, United States. Tel.: +1 618 453 1795.
E-mail addresses:[email protected] (R.L. Cook), [email protected] (D. Binkley), [email protected] (J.C.T. Mendes), [email protected] (J.L. Stape).
Contents lists available atScienceDirect
Forest Ecology and Management
Zinn et al., 2002; Zinn et al., 2007), whileLima et al. (2006)found an increase in soil carbon followingEucalyptusestablishment on former pasture. One challenge in comparing soil carbon studies is due to the fact that often studies provide incomplete accounting of soil carbon by omitting the organic (O) horizon of soils under trees (Guo and Gifford, 2002; Paul et al., 2002; Berthrong et al., 2009). Maquere et al. (2008)found increased soil carbon stocks by 35–53% inEucalyptusplantations established on former pasture, when including the O horizon.
Tree species vary in their inputs into soil, both in terms of bio-mass production and nutrient content, and resultant C storage (Zinn et al., 2002; Russell et al., 2004; Laganiére et al., 2010;
Pérez-Cruzado et al., 2012). Commercial plantation tree species are of particular importance due to their increasing area of production. Broadleaf plantations of Eucalyptus currently cover over 20 million hectares (ha) worldwide (Iglesias-Trabado and Wilstermann, 2009). Brazil is the largest producer ofEucalyptus, with these plantations extending across 4.75 million ha, and also has extensive commercial pine plantations covering 1.8 million ha (ABRAF, 2011).
Many plantation forests in Brazil have been established on pas-tures (primarilyBrachiariaspecies) that were formerly used for cat-tle production for decades. Most pastures were established following brief row cropping after initial deforestation. A greater capability to predict how land-use change affects soil carbon could improve management decisions and climate change mitigation policy. A recent meta-analysis has shown that afforestation tends to have the same effect in both subtropical and tropical environ-ments (Laganiére et al., 2010), which makes up most of Brazil (Alvares et al., 2013). However, major challenges remain for assess-ing the effects of land-use change due to the inherent variability in soils, interactions among soil properties, climate, and vegetation as well as the long time scale required to detect small changes.
In this study we ask these four questions: (1) Does soil carbon differ beneath pasture and broadleaf trees? (2) Does soil carbon differ beneath broadleaf trees and coniferous trees? (3) Does the effect of tree type increase over time? (4) Does soil carbon relate to aboveground biomass and/or forest productivity? To answer these questions, we examined soils in pastures and plantations of broadleaf and conifer trees in southeastern Brazil. This study expands on previously published work evaluating the isotopic sig-natures of pasture- and forest-derived carbon in only the mineral soil (Cook et al., 2014).
2. Materials and methods
2.1. Site description
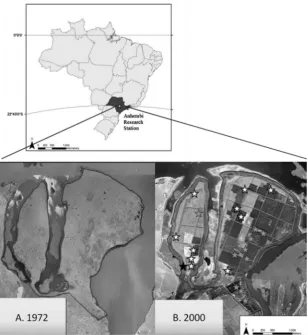
Soil samples for this project were collected at the Anhembi Experimental Research Station, which lies in the center of the state of Sao Paulo, Brazil, and has been owned by the University of Sao Paulo (USP) since 1972 (Fig. 1). Native seasonal semi-deciduous Atlantic Forest was cleared between 1950 and 1955, most likely burned and planted for several years in cotton agriculture before being replaced withBrachiaria decumbensStapf. and managed for cattle pasture. The 660 ha field site has been mostly converted from pasture to broadleaf and conifer forest plantations consisting primarily ofEucalyptusandPinusstands, but with some remaining areas of pasture and one remaining hectare of native, broadleaf, ‘‘reference’’ forest. Many of the remaining pastures, or ‘‘Areas of Permanent Preservation,’’ were preserved as a result of the riparian buffer required by Brazilian law and cannot be disturbed for forest plantations or crops (Sparovek et al., 2010). Pastures ranged in age from 25 to 53 years prior to plantation forest establishment, and pasture sites sampled in this study were 54–59 years old. Forest stands sampled in this study were on average 2.3 hectares and
range from 0.2 to 5.5 ha in size. The native tree species in this eco-system and the remaining ‘‘reference’’ forest on the experimental site included:Aspidospermaspp. (Apocynaceae), Hymenaeacourba-ril(Fabaceae), Astronium graveolens(Anacardiaceae), Ocotea spp. (Lauraceae), andCarinianaspp. (Lecythidaceae) (Assumpção et al., 1982). A private forest reserve, Barreiro Rico, located 6 km away on similar soils and landform provides an example of undisturbed mature Atlantic Forest and a comparison with the reference native forest on site (Ferez, 2010; Assumpção et al., 1982; Oliveira et al., 1999).
The Research Station is located at latitude 22°400S and longi-tude 48°100W about 230 km northwest of Sao Paulo city at an ele-vation of 455 m. The topography is flat, and the climate is humid subtropical (Cwa) in the Köppen system, with hot, rainy summers and slightly cooler, dry winters (Alvares et al., 2013). The mean annual temperature is 21.0°C, with the coldest month having an
average of 17.1°C and the hottest month averaging 23.7°C. Annual
mean rainfall averages 1350 mm, with a dry season between the months of April and September (Hijmans et al., 2005; Campoe et al., 2010).
Soils are deep sandy Oxisols (Typic Hapludox) in the U.S. taxo-nomic system, or Typic Dystrophic Red–yellow Latosols according to the Brazilian taxonomic system (Andrade et al., 2010; Campoe et al., 2010). The texture is mostly sandy loam in the A horizon (0–10 cm) followed by sandy clay loam texture in the AB (10–35 cm), BA (35–80 cm), Bw (80–175 cm), and C (>175 cm) horizons with sand content between 61% and 76%. These soils have low water-holding capacity, good drainage, and are resistant to compaction. Cation exchange capacity is typically <17 cmolckg 1. The pH (in CaCl2) is low, usually <4.3 (Andrade et al., 2010).
2.2. Forest plantation establishment
Forest plantation establishment has followed a standard protocol consisting of:
(i) Initial leaf-cutting ant control.
(ii) One harrowing and two orthogonal disking operations after burning the pasture (up until 1989) or over the grass (after 1989).
(iii) Marking the planting rows with a ripper to assure three meter distance between rows.
(iv) Manual planting of the seedlings at two meter spacing and watering in periods of low rainfall.
(v) Fertilization with 20 kg ha 1nitrogen, 40 kg ha 1 phospho-rus and 17 kg ha 1potassium at planting, plus 200 kg ha 1 of NPK 10:20:10 applied two months later.
(vi) Control of competing vegetation with manual weeding in the row and mechanized chopping between rows until can-opy closure at around year two; and
(vii) Annual leaf-cutting ant control during the dry season (April to September).
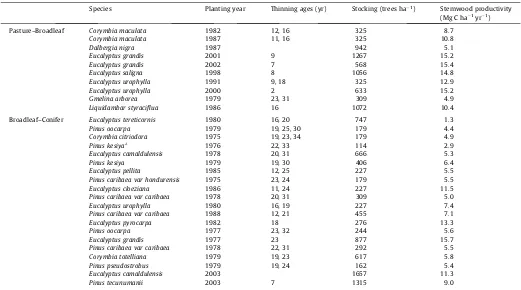
Most of the Anhembi forest stands consist of trees grown for seed production and are managed for long rotations. Thinning of about 40% of the trees occurs near year 16, and is repeated again near year 25.Table 1details stand species, spacing, year of plant-ing, and age of thinning.
2.3. Experimental design
and broadleaf tree plantations following conversion from pasture. The location of conifer plots in the landscape precluded the pairing of conifer plantations with pastures. We used a chronosequence design, with forest plots ranging in age from 6 to 34 years since establishment. The broadleaf plantations consisted of seven
Eucalyptusstands, oneLiquidambar styracifluaL. stand, oneGmelina arboreaRoxb. stand, and one stand of Dalbergia nigraAllem. ex Benth. (a native leguminous tree species). The original, pre-deforestation state of the soil was estimated by comparing an on-site residual native forest plot, we call a ‘‘Reference Forest,’’ paired with an adjacent pasture. We estimated the effect of planta-tion age on soil carbon based on the pattern among stands of increasing age and also examined the differences between paired plots over time.
2.4. Soil sample collection
We collected O horizon and mineral soil samples between April and July 2009. Soil samples were collected along three transects in each block bisecting the two vegetation types. Transects were located 14 m apart and were sampled every 7 m along their length. This created a total of nine sampling locations within each vegeta-tion plot for a sampling plot area of 0.1 ha within each stand (18 samples total per block). The whole O horizon, including all litter material of <5 mm diameter down to the mineral soil, was collected within a 2525 cm wooden frame with five combined samples for each point (5625 cm2) to create nine O horizon sam-ples per plot. One O-horizon sample from each plot was oven-dried
offsite for correction of water loss and then combusted in a muffle furnace for loss on ignition to determine correction factors for ash content. Mineral soils were collected with a hand auger at depths from 0 to 15 cm, 15 to 30 cm, and 30 to 45 cm. At each of the sam-pling points, five subsamples were composited and homogenized in the field. A total of 27 mineral soil samples were collected per vegetation plot for dry combustion analysis (9 points3 depths). Bulk density of mineral soils was determined on a separate set of samples collected at the center of each plot at each sampling depth with a volumetric ring measuring 5 cm in diameter and height (98 cm3volume). The lower sampling intensity was deemed appropriate due to the lack of variability across bulk density samples. Whole soil samples were oven dried and weighed at the Luiz de Queiroz College of Agriculture – University of Sao Paulo (ESALQ-USP) in Piracicaba, Brazil.
2.5. Soil processing and analysis
All soil samples were air dried and ground to pass through a 2 mm sieve. Any material that did not pass through, such as coarse roots, was excluded. A composite of nine subsamples was analyzed for texture by hydrometer at the Laboratory of Applied Ecology at ESALQ-USP, Piracicaba, Brazil. All mineral soil samples were archived at North Carolina State University Forest Productivity Laboratory.
For total carbon dry combustion analysis, sub-samples of soil were homogenized in a roller-mill, with approximately 2.5 g of each soil sample placed inside a two-ounce square glass bottle Fig. 1.Anhembi Research Station, located in Sao Paulo state in southeastern Brazil (above). Aerial photos (below) shows predominance of pasture in (A) 1972, followed by (B) plantation forest establishment on the majority of the field site as of 2000. The native, residual ‘‘reference’’ is marked with a black star, Pasture–Broadleaf pairs are marked with white stars, and Broadleaf–Conifer paired plots are marked with gray stars.
along with six 304-stainless steel rods (10 mm diameter, 45 mm length) and securely placed inside of a standard, rubber-lined rock tumbler to rotate for 24 h (Arnold and Schepers, 2004). This gener-ally produced a fine powder able to pass through a #60 mesh (0.250 mm) sieve, though some samples required additional pul-verizing by mortar and pestle for remaining particles. This method produced a homogenous final product with low coefficient of var-iation (<5%) in duplicate samples.
Total soil carbon was determined from the pulverized sub-samples by dry combustion and infrared detection using a NC2100 elemental analyzer (CE Elantech, Inc., Lakewood, New Jer-sey). For quality assurance, NIST (National Institute of Standards and Technology) certified reference material, well characterized in-house soil standards, and sample duplicates (5% of analyzed samples) were monitored for precision and accuracy. Acid fumiga-tion was used to test for the presence of carbonates (Harris and van Kessel, 2001), but no traces were found in these acidic soils.
Concentrations of soil carbon determined for each sample were extrapolated to a volume basis based on soil depth and the bulk density of the mineral soils from 0 to 15 cm, 15 to 30 cm, and 30 to 45 cm depth. Mineral soil carbon and carbon in the O horizon were summed to determine soil carbon stocks to a 45 cm depth.
2.6. Forest plantation inventory
Aboveground stemwood biomass and stemwood productivity were quantified for each sampled plot. A circular inventory plot of 616 m2 was established in each tree plot in January of 2012, except for two plots that were inventoried in July 2009 and 2010 immediately prior to harvesting. Trees were measured for diame-ter at breast height (DBH, 1.30 m above ground level), and heights were measured for 20% of the trees. A plot-level hypsometric equa-tion was developed to estimate the height of the remaining trees.
The bole biomass of eachEucalyptustree was calculated according to the equation developed byDoi et al. (2010)in this region. For pine, the biomass equation was developed byBizon (2005)at sites 200 km south of Anhembi. TheEucalyptusequation was used for the other hardwood plots since their DBH, height, and wood den-sity were comparable to the Eucalyptus species. This approach may introduce some small error into the estimation of biomass for these broadleaved species. Wood density for a 7-year-old Euca-lyptusmay range from 0.48 to 0.60 whileL. styracifluawould be 0.52,G. arboreais 0.50, andD. nigra0.55 (Tomazello, 1987). Bio-mass removed from thinnings was estimated based on the domi-nance curve developed by Doi et al. (2010) and added to the estimate of total aboveground stemwood yield for each stand in Mg ha 1. Stemwood biomass was used to estimate coarse root car-bon. Coarse root carbon was estimated for conifers by multiplying stemwood biomass by 0.27 (Bizon, 2005), and for broadleaf species by multiplying stemwood by 0.20 (Stape et al., 2004). Biomass esti-mates were multiplied by 0.5 to covert dry matter to carbon, and then divided by the age of the stand to obtain the annual stem-wood productivity (Mg C ha 1yr 1) for each forest stand associ-ated with the soil samples. Branch biomass was not included as it usually represents a very small fraction of the woody biomass (<5%).
2.7. Statistics
Soil carbon was compared between 10 paired plots of broadleaf plantations adjacent to pastures and 10 paired plots of broadleaf plantations adjacent to conifer plantations. The original layout of the plantations was random in the sense of lacking a scheme that might intentionally bias our tests. The development of the planta-tions was not based on a single, original design of an experiment, but aimed to ensure randomness across the entire site. The Table 1
Details for Pasture–Broadleaf plots and Broadleaf–Conifer plantations plots.
Species Planting year Thinning ages (yr) Stocking (trees ha1) Stemwood productivity
(Mg C ha 1yr 1)
Pasture–Broadleaf Corymbia maculata 1982 12, 16 325 8.7
Corymbia maculata 1987 11, 16 325 10.8
Dalbergia nigra 1987 942 5.1
Eucalyptus grandis 2001 9 1267 15.2
Eucalyptus grandis 2002 7 568 15.4
Eucalyptus saligna 1998 8 1056 14.8
Eucalyptus urophylla 1991 9, 18 325 12.9
Eucalyptus urophylla 2000 2 633 15.2
Gmelina arborea 1979 23, 31 309 4.9
Liquidambar styraciflua 1986 16 1072 10.4
Broadleaf–Conifer Eucalyptus tereticornis 1980 16, 20 747 1.3
Pinus oocarpa 1979 19, 25, 30 179 4.4
Corymbia citriodora 1975 19, 23, 34 179 4.9
Pinus kesiyaa 1976 22, 33 114 2.9
Eucalyptus camaldulensis 1978 20, 31 666 5.3
Pinus kesiya 1979 19, 30 406 6.4
Eucalyptus pellita 1985 12, 25 227 5.5
Pinus caribaea var hondurensis 1975 23, 24 179 5.5
Eucalyptus cloeziana 1986 11, 24 227 11.5
Pinus caribaea var caribaea 1978 20, 31 309 5.0
Eucalyptus urophylla 1980 16, 19 227 7.4
Pinus caribaea var caribaea 1988 12, 21 455 7.1
Eucalyptus pyrocarpa 1982 18 276 13.3
Pinus oocarpa 1977 23, 32 244 5.6
Eucalyptus grandis 1977 23 877 15.7
Pinus caribaea var caribaea 1978 22, 31 292 5.5
Corymbia totelliana 1979 19, 23 617 5.8
Pinus pseudostrobus 1979 19, 24 162 5.4
Eucalyptus camaldulensis 2003 1657 11.3
Pinus tecunumanii 2003 7 1315 9.0
aAll plots planted on 3
question of how the trees might affect change in soil carbon over time was tested by examining whether total soil carbon related to time based on age of plantations since establishment from pasture. Separate analysis of covariance (ANCOVAs) were run with a general linear model for each of the Pasture–Broadleaf and Broad-leaf–Conifer set of paired plots. We modeled total soil carbon (O horizon plus 0–45 cm mineral soil) as well as the difference in total soil carbon between vegetation pairs as a dependent variables in separate analyses. The model results for the whole soil profile model are reported below, except where additional information was gained by analyzing on a per depth basis.
For the dependent variable of total soil carbon stock within each set of pairs (Broadleaf–Pasture and Broadleaf–Conifer), the inde-pendent class variable ‘‘vegetation’’ was the main treatment, and paired plots were considered the ‘‘block’’ class variable to take into account site variability and make the test of the treatment (vegeta-tion type) more powerful in the ANCOVA. Comparisons for differ-ences between vegetation treatments in ANCOVA were analyzed using pair-wise comparisons protected Least Significant Difference (LSD) with a significance level of P< 0.05. Clay content was included in the ANCOVA as a continuous independent covariate. Forest stand age could not be included as a covariate in the ANCOVA models of Broadleaf–Pasture because identical pasture age (54 years) would skew the model.
For the dependent variable of the difference in soil C between vegetation types in the paired plots, clay content and age were the independent continuous variables. This approach allowed for pair-wise comparison of adjacent pastures with broadleaf planta-tions, and adjacent broadleaf with conifer plantations.
In a separate bivariate model, we examined the overall effect of time since plantation forest establishment regardless of species, with forest soil C stocks as the dependent variable and stand age as the independent variable on a layer-by-layer and whole soil basis (soil C stock chronosequence effect). We also created a bivariate model for the differences between vegetation classes in paired plot soil C as the dependent variable and forest stand age as the inde-pendent variable (paired plot chronosequence effect). All statistics were calculated using the statistical packages SAS v 9.2 and JMP v 9.0 (SAS Institute, Cary, NC).
3. Results
3.1. Tree biomass carbon
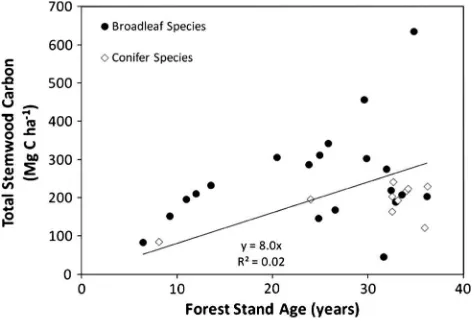
Aboveground carbon in stemwood biomass of forest stands ranged from 84 to 230 Mg C ha 1 (Fig. 2), and annual stemwood production ranged from 1.3 to 15.7 Mg C ha 1yr 1 (Table 1).
Stemwood C sequestration rate did not differ significantly between broadleaved species and conifers. Broadleaved species sequestered C in stemwood biomass at a rate of 9.7 Mg C ha 1yr 1while coni-fers sequestered C in stemwood at 5.7 Mg C ha 1yr 1. Total soil carbon was small in comparison to the C contained in the stem-wood, equaling just 13% of broadleaf stemwood C and 16% of coni-fer stemwood C on average. Soil C became a decreasing proportion of the total above and belowground biomass and soil C budget with increasing age since conversion to forest plantation (Fig. 3). Neither annual stemwood production nor aboveground biomass of stem-wood were significantly correlated with soil carbon (data not shown).
3.2. Native Reference Forest
Carbon stocks in the native Reference Forest soil were similar to other nearby mature forest study sites. Our Reference Forest soil contained 1.9 Mg C ha 1 in the O horizon and 42.7 Mg C ha 1 in the 0–30 cm mineral soil (sampling depth of nearby mature forest). The seasonal semi-deciduous forest located 6 km from our field site that was found to have 4.0 ± 1.4 Mg C ha 1in the O horizon and 35.5 ± 10.9 Mg C ha 1 in the 0–30 cm mineral soil (Ferez, 2010).Bernoux et al. (2002)estimated 41.7 Mg C ha 1in the same type of mature forest in the 0–30 cm mineral soil. While we cannot compare these values statistically, they provide some indication that the native Reference Forest may be a close approximation of a native, undisturbed, semi-deciduous Atlantic forest.
3.3. Soil carbon
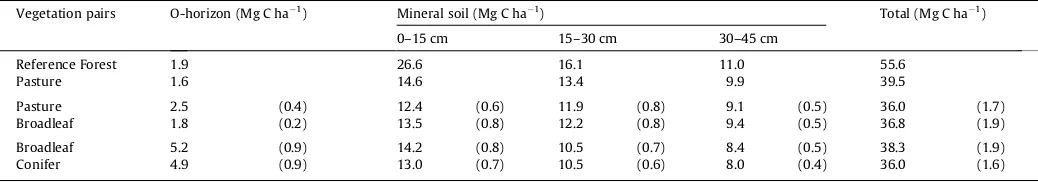
Soil C results and soil physical properties of bulk density and per-cent clay content are given inTable 2. The Reference Forest had soil carbon (O horizon +0–45 cm) of 55.6 Mg C ha 1 compared with 39.5 Mg C ha 1for the adjacent pasture, indicating that deforesta-tion led to a loss of about one-third of the original soil C. The Pasture–Broadleaf plots (n= 10) averaged 36.8 ± 1.9 Mg C ha 1 in forested plots and 36.0 ± 1.7 Mg C ha 1for the paired pasture plots. Though they could not be analyzed statistically separately, plots that were grouped into the ‘‘Broadleaf plantation’’ category but were notEucalyptusspecies had soil C stocks of 47.1 Mg C ha 1in theL. styracifluastand, 43.9 Mg C ha 1in theG. arboreastand, and 36.7 Mg C ha 1for the
D. nigra(the native leguminous tree species) stand. In the Broadleaf–Conifer paired plots, the Broadleaf plots show a statistically significant increase of 6% more soil C (38.3 ± 1.9 Mg C ha 1) than conifer plantations (36.0 ± 1.6 Mg C ha 1, Table 2). The O horizons in all of the sites stored a relatively small fraction of soil carbon, averaging <5 Mg C ha 1 (Table 3). Clay content was not a significant factor in the model, confirming expec-tations based on the homogenous site conditions and soil descrip-tions (seeTable 4).
Based on a bivariate model of the soil C stock against site age across the sampled chronosequence, whole-profile (O horizon +0–45 cm) soil carbon stocks across all forest species did not change with time since forest establishment (Fig. 4). On a layer-by-layer basis, regressions of soil C in the O horizon and the 0–15 cm had no significant relationship over time. However, a slight decrease in mineral soil carbon stocks was noted in the pooled broadleaf and conifer plantations results in both the 15–30 cm ( 0.12 Mg C ha 1yr 1) and in the 30–45 cm layer ( 0.08 Mg C ha 1yr 1).
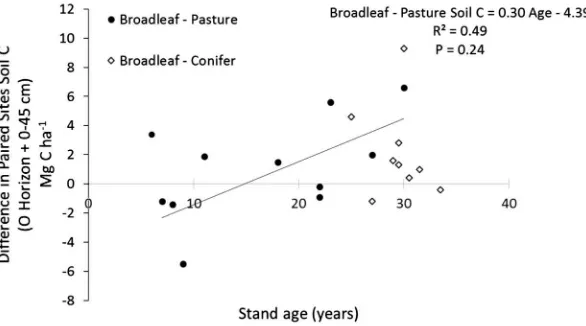
Analysis of the within-pairs differences in carbon stocks indi-cated a significant positive relationship to time since forest estab-lishment in Pasture–Broadleaf paired sites (O horizon +0–45 cm). This method of analysis showed that early in the rotation broadleaf plantations tended to hold less soil carbon than pastures early after plantation establishment, but later showed a positive increase over Fig. 2.Relationship between forest stand age (years) and total stemwood carbon
including thinning removals (Mg C ha 1).
pasture (Fig. 5). In contrast, there was no significant trend in the difference between within-pairs plots in soil C between the broad-leaf and conifer plantations.
The average age of broadleaf stands that were paired with pas-tures was 18 years, whereas in the Broadleaf–Conifer blocks the average age of broadleaf stands was 27 years and 28 years for conifer stands. For broadleaf stands paired with adjacent pastures, the 95% confidence interval for annual soil C accretion rates was 0.20 to +0.16 Mg C ha 1yr 1, representing the relative C accretion rate for conversion from pasture to broadleaf plantations. For the Broad-leaf–Conifer blocks, we used the mean pasture soil C values as a baseline since no adjacent pastures were available next to these stands. Using this baseline, the 95% confidence interval for conversion from pasture to conifer plantation was 0.26 to +0.50 Mg C ha 1yr 1, and was 0.24 to +0.74 Mg C ha 1yr 1 for Broadleaf stands within the Broadleaf–Conifer blocks. All confidence intervals therefore included zero for relative change in C accretion rates at 18, 27, and 28 years after plantation establishment.
The C:N ratios in the mineral soil to a 45 cm depth were not sig-nificantly different between vegetation types in either set of vege-tation pairs. For Pasture–Broadleaf blocks, C:N ratios averaged 14.8 ± 0.1 for broadleaf plantations and 14.6 ± 0.1 for pasture. In Broadleaf–Conifer blocks, C:N ratios were 13.4 ± 0.1 for broadleaf and 13.7 ± 0.1 for conifer plantations. There was a significant depth-dependent relationship in the Broadleaf–Conifer plots, with C:N ratios decreasing with depth from 14.7, to 13.2, to 12.8 from 0 to 15 cm, 15 to 30 cm, and 30 to 45 cm, respectively. However, there was no depth-dependent relationship in the Pasture–Broad-leaf plots with C:N ratios of 14.8, 14.7, and 14.8 from 0 to 15 cm, 15 to 30 cm, and 30 to 45 cm, respectively.
4. Discussion
This study involved a chronosequence of 20 paired plots in a 660 ha field site with very homogenous soil conditions and past Fig. 3.The proportion of soil carbon as a percent of aboveground stemwood carbon (branches and leaves not included), coarse roots (estimated from stemwood), and soil carbon (O horizon and 0–45 cm mineral soil). The regression line includes both broadleaf and conifer species since they did not differ significantly from each other in above and belowground C.
Table 2
Soil bulk density (kg m 3) and clay content (%) for each plot.
Vegetation pairs Soil bulk density (kg m 3) Clay content (%)
0–15 cm 15–30 cm 30–45 cm 0–15 cm 15–30 cm 30–45 cm
Reference Forest 1.45 1.31 1.26 18 20 18
Pasture 1.22 1.45 1.26 18 20 18
Pasture 1.2 (0.04) 1.41 (0.03) 1.32 (0.03) 22 (1.2) 23 (1.4) 22 (1.2)
Broadleaf 1.24 (0.03) 1.38 (0.03) 1.31 (0.02) 22 (0.7) 24 (1.0) 22 (0.7)
Broadleaf 1.27 (0.03) 1.41 (0.03) 1.35 (0.02) 18 (0.9) 20 (1.0) 18 (0.9)
Conifer 1.32 (0.04) 1.5 (0.03) 1.39 (0.04) 18 (0.9) 21 (1.0) 18 (0.9)
Table 3
Mean soil organic carbon stocks (± standard error) for each pair of vegetation plots at each sampling depth. Pasture–Broadleaf pairs (n= 10) and Broadleaf–Conifer pairs (n= 10). Reference Forest and Pasture pair does not have standard error (n= 1).
Vegetation pairs O-horizon (Mg C ha 1) Mineral soil (Mg C ha 1) Total (Mg C ha1)
0–15 cm 15–30 cm 30–45 cm
Reference Forest 1.9 26.6 16.1 11.0 55.6
Pasture 1.6 14.6 13.4 9.9 39.5
Pasture 2.5 (0.4) 12.4 (0.6) 11.9 (0.8) 9.1 (0.5) 36.0 (1.7)
Broadleaf 1.8 (0.2) 13.5 (0.8) 12.2 (0.8) 9.4 (0.5) 36.8 (1.9)
Broadleaf 5.2 (0.9) 14.2 (0.8) 10.5 (0.7) 8.4 (0.5) 38.3 (1.9)
land-use history. Within these plots we examined both the above and belowground biomass and the total soil carbon stocks (O horizon +0–45 cm mineral soil) for differences in vegetation type (pasture vs broadleaf trees and broadleaf vs conifer trees) and for patterns of change over time.
Total aboveground stemwood biomass indicated the amount of carbon flux from the atmosphere to each forest stand. Variation in annual stemwood production and stemwood biomass was most likely due to inherent genetic differences among species, and had no statistically significant correlation with soil carbon. Our esti-mates of soil carbon (O horizon + mineral soil) as a proportion of biomass and soil C fell within previously measured ranges for Euca-lyptus-andPinus-dominated stands of 8–18% (Pérez-Cruzado et al., 2012). As time under plantation increased, soil carbon became a smaller percentage of the above and belowground C as rate of bio-mass production exceeded soil C accretion.
Broadleaf forest plantations were shown in this study to main-tain soil organic carbon stocks similar to cattle pasture to a 45 cm depth in the Pasture–Broadleaf paired plots. While these deep soils still contain substantial soil carbon reserves below 45 cm, it is unli-kely that different trends would be discovered below our sampling depth. Our results are in accord with a recent meta-analysis showing change in soil carbon following reforestation of pastures was not significantly different from zero (Laganiére et al., 2010). In contrast toResh et al. (2002), the single plot of nitrogen-fixing Table 4
Results of ANCOVA for Pasture/Broadleaf and Broadleaf/Conifer paired plots show non-significant effects of vegetation or clay content on soil C stocks. Site age was not used in the Pasture/Broadleaf soil C stock model since all pastures are the same age and were not converted to forests. Only the blocking factor is significant. Difference in soil C between adjacent paired plots models were not significant.
Model Factor df F-value P-value R2
Soil C stocks
Pasture/Broadleaf soil C stocks Veg 1 0.0060 0.9400 Block 9 8.7673 0.0028⁄
Clay 1 1.5570 0.2474
Model 19 8.4053 0.0028⁄ 0.92
Broadleaf/Conifer soil C stocks Veg 1 0.0422 0.5895 Block 9 8.8406 0.0006⁄
Clay 1 0.3708 0.4790
Age 1 0.6028 0.5618
Model 19 9.581 0.0031⁄ 0.94
Soil C difference
Factor df tRatio P-value R2
Broadleaf soil C–Pasture soil C Clay 1 0.04 0.6192
Age 1 2.43 0.0451
Model 9 3.6485 0.0821 0.06
Broadleaf soil C–Conifer soil C Clay 1 0.47 0.6538
Age 1 0.65 0.5351
Model 9 0.2392 0.7934 0.51
* Significant at theP< 0.01 level.
Fig. 4.The chronosequence of all broadleaf and conifer stands shows no significant relationship between age and soil carbon (O horizon +0–45 cm). Shaded curves represent the 95% confidence interval.
Fig. 5.Differences in soil C (O horizon +0–45 cm) between paired Broadleaf and Pasture plots show that broadleaf plantations trend towards having more soil C than pastures as time increases. There is no significant regression in the difference between paired broadleaf and conifer plantations.
broadleaf species measured in our study (D. nigra) did not indicate a greater ability to sequester soil C than non-leguminous broadleaf trees. However, we could not statistically test the difference due to limited representation ofD. nigrastands at our study site. In abso-lute termsL. styracifluaandG. arboreaindicated an advantage in soil carbon sequestration. Slightly greater soil carbon sequestration in broadleaf plantations compared to conifers in the Broadleaf– Conifer paired plots would be expected based on earlier observa-tions that conifer plantaobserva-tions can sometimes reduce soil carbon in the mineral fraction following reforestation of pastures (Guo and Gifford, 2002).
The lack of change in soil C levels following forest establishment has been shown previously in the tropics, even after 80 years of secondary succession due to complimentary tree-derived carbon gains offset by losses of grass-derived carbon down to a one meter depth (Marin-Spiotta et al., 2009). Neumann-Cosel et al. (2011)
similarly found little difference in soil carbon after reforestation of pastures in Panama up to 20 years following stand establish-ment, and suggested that it may take a century after reforestation to build soil carbon to levels approaching mature forests.
We found no difference in carbon stocks of the O horizon between vegetation types, either in Pasture–Broadleaf or Broadleaf–Conifer paired plots. In fact, the C accumulation in the O horizons equaled about one year’s input of C in litterfall (Ryan et al., 2010), indicating rapid decomposition or incorporation into the A horizon. There was no change in O horizon carbon sequestra-tion with stand age in either the broadleaf or the conifer stands. In a similar study,Zinn et al. (2002)also found no difference between
Eucalyptusandcerrado(native grassland) litter on a sandy Entisol. Complete accounting of soil C with inclusion of O horizons leads to more accurate estimates of soil C change with forest establishment than accounting for only mineral horizons (Paul et al., 2002; Laganiére et al., 2010). The O horizons in the forested and pastured plots were too small in our study location to have a strong influ-ence on the overall C budget.
The age of tree plantations has been thought to be an important factor in soil carbon stocks following forest establishment (Paul et al., 2002). The stands in this study did not demonstrate a change in soil carbon with age based on the chronosequence of broadleaf and conifer plantations. This lack of change has been shown to be the case following examples of conversion of other pastures to sec-ondary forests (Schedlbauer and Kavanagh, 2008; Marin-Spiotta et al., 2009; Neumann-Cosel et al., 2011; Wellock et al., 2011). Pre-vious work at this site showed a slight decrease in pasture-derived soil carbon over time in the two lower layers (15–30 cm and the 30–45 cm) that was not made up for by an equivalent increase in tree-derived soil carbon (Cook et al., 2014). This decrease may have been due to an increase in longer-lived roots of tree species com-pared to pastures with higher rates of fine root turnover (Canadell et al., 1996; Jackson et al., 1996; Guo et al., 2007).
There was a positive trend in the difference in soil carbon between Broadleaf plantations and pastures when examined on a paired plot basis, potentially by accounting more effectively for site variability. This trend may indicate that when broadleaf planta-tions are established, there may be a decrease in the rate in soil carbon accumulation compared to pastures that is balanced out over time by a slight increase in C accretion rate. An initial loss of soil carbon following plantation establishment has been previ-ously documented in other sites, followed by gains beginning after 25 years (Pérez-Cruzado et al., 2012). These results may indicate that longer rotations may lead to soil carbon gains in a humid tem-perate climate, though this is not the usual management practice in Brazil.
The lack of difference in C:N ratios between vegetation types is unexpected in that plantations are often thought to contain lower quality (higher C:N ratio) litter than pastures and therefore show
an increase the C:N ratio in the soil (Berthrong et al., 2009). How-ever, we saw no significant difference in C:N ratios between pas-ture and broadleaf plantations or between conifer and broadleaf plantations, though the difference between vegetation types in the Broadleaf–Conifer pairs was almost significant (P= 0.0505). The depth-dependent relationship present in the Broadleaf– Conifer plots but not in the Pasture–Broadleaf plots, while unusual, may have to do with the fact that on average the forest stands in Broadleaf–Conifer plots were older (mean Broadleaf age = 27 years, mean Conifer age = 28 years), whereas the mean age of Broadleaf stands in the Pasture–Broadleaf plantations was 18 years. We speculate that the greater stratification of carbon and nitrogen may be due to processes operating over the greater length of time since forest establishment.
The balance of gains and losses of soil carbon following conver-sion from pasture to forest are thought to be driven by the type of forest established, previous land use, climate, clay content, clay type, and pre-planting disturbance (Guo and Gifford, 2002; Paul et al., 2002; Laganiére et al., 2010; Don et al., 2011). Of these fac-tors, our observations controlled for previous land use, climate, clay content, and pre-planting disturbance to primarily focus on type of forest established. Both broadleaf and conifer forest planta-tion types appear to maintain essentially consistent levels of soil organic carbon to tropical pasture. However, the time frame of this experiment may not be long enough to observe change in soil car-bon due to land-use change.
Similarities in net primary productivity between plantation and pasture land cover may help explain the lack of difference in soil carbon. Net primary productivity (NPP) forEucalyptusspecies has been estimated at 40 Mg dry matter ha 1yr 1 with 29% of that total allocated belowground (Binkley and Ryan, 1998). Above-ground NPP only ofBrachiariapasture grasses was estimated to be 28–34 Mg dry matter ha 1yr 1 in southern Bahia (a tropical region of Brazil) (Rezende et al., 1999). Well-managed pastures in the tropics can be highly productive systems; switching from a native forest to a pasture can increase soil carbon stocks when annual precipitation is <2000 mm yr 1(Guo and Gifford, 2002).
This study was constrained by the lack of paired pasture sites located adjacent to conifer tree plantations. This issue was addressed by pairing of broadleaf species with conifers as a stan-dard of comparison. Another limitation to developing a better understanding of the change in belowground carbon is that trees typically have larger and longer-lived root systems than pastures. Therefore measuring soil carbon alone misses a significant pool of carbon in the belowground system. We attempted to address this by estimating root carbon based on aboveground biomass measurements. Pasture root biomass measurement was beyond the scope of this study. Root carbon estimates are labor and time intensive, and are often infeasible for large-scale field studies.
5. Conclusions
vegetation types were indicated over the time interval examined in this study. Neither forest plantation nor pasture soils appeared to reach the soil carbon levels present in the mature native forest under this time frame, which leads us to suppose the recov-ery of these eroded and disturbed soils may be a vrecov-ery long-term process.
Acknowledgements
We would like to acknowledge support from the Forest Produc-tivity Cooperative, a graduate assistantship from the Department of Forestry and Environmental Resources at North Carolina State University, and owe thanks to cooperation from ESALQ and IPEF in Piracicaba, Brazil and Antonio Carlos Pedrozo at the Anhembi Research Station. The sampling would not have been possible without the great deal of help from the staff and students in Brazil. We owe thanks to Rafaela Lorenzato Carneiro for her help in the field and organization of many GFMO undergraduates.
References
ABRAF, 2011. Anual estatístico da ABRAF 2010 ano base 2009. 2012, <http:// www.abraflor.org.br/estatisticas/ABRAF11/ABRAF11-EN.pdf> (accessed 02.01.12; verified 06 Jan 2014). Brasilia, Brazil.
Alvares, C.A., Stape, J.L., Sentelhas, P.C., de Moraes Gonçalves, José Leonardo, Sparovek, G., 2013. Köppen’s climate classification map for Brazil. Meteorologische Zeitschrift.
Andrade, G.R.P., Schelstraete, T., Beirigo, R.M., Nascimento, A.F., Torrado, P.V., 2010. Levantamento pedológico da Estação Experimental de Ciências Florestais de Anhembi.
Arnold, S., Schepers, J., 2004. A simple roller-mill grinding procedure for plant and soil samples. Commun. Soil Sci. Plant Anal. 35, 537–545.
Assumpção, C.T., Leitão Filho, H.F., Cesar, O., 1982. Descrição das matas da Fazenda Barreiro Rico, Estado de São Paulo. Revista Brasileira de Botânica 5, 53–66. Batjes, N., Sombroek, W., 1997. Possibilities for carbon sequestration in tropical and
subtropical soils. Global Change Biol. 3, 161–173.
Bernoux, M.C.S.C., Volkoff, M., Cerri, B., Clemente, C., 2002. Brazil’s soil carbon stocks. Soil Sci. Soc. Am. J. 66, 888.
Berthrong, S.T., Jobbágy, E.G., Jackson, R.B., 2009. A global meta-analysis of soil exchangeable cations, pH, carbon, and nitrogen with afforestation. Ecol. Appl. 19, 2228–2241.
Binkley, D., Ryan, M.G., 1998. Net primary production and nutrient cycling in replicated stands ofEucalyptus salignaandAlbizia facaltaria. For. Ecol. Manage. 112, 79–85.
Bizon, J.M.C., 2005. Availção da sustentabilidade nutricional de plantios de Pinus taeda L. usando um balanço de entrada-saída de nutrientes. USP-ESALQ, Piracicaba, Brazil.
Campoe, O.C., Stape, J.L., Mendes, J.C.T., 2010. Can intensive management accelerate the restoration of Brazil’s Atlantic forests? For. Ecol. Manage. 259, 1808–1814. Canadell, J., Jackson, R.B., Ehleringer, J.B., Mooney, H.A., Sala, O.E., Schulze, E.D., 1996. Maximum rooting depth of vegetation types at the global scale. Oecologia 108, 583–595.
Cook, R.L., Stape, J.L., Binkley, D., 2014. Soil carbon dynamics following reforestation of tropical pastures. Soil Sci. Soc. Am. J. 78, 290–296.
Doi, B.T., Binkley, D., Stape, J.L., 2010. Does reverse growth dominance develop in old plantations ofEucalyptus saligna? For. Ecol. Manage. 259, 1815–1818. Don, A., Schumacher, J., Freibauer, A., 2011. Impact of tropical land-use change on
soil organic carbon stocks–a meta-analysis. Global Change Biol. 17, 1658–1670. Ferez, A.P.C., 2010. Efeito de práticas silviculturais sobre as taxas iniciais de seqüestro de carbono em plantios de restauração da Mata Atlântica. USP-ESALQ, Piracicaba, Brazil.
Guo, L.B., Gifford, R.M., 2002. Soil carbon stocks and land use change: a meta analysis. Global Change Biol. 8, 345–360.
Guo, L.B., Wang, M., Gifford, R.M., 2007. The change of soil carbon stocks and fine root dynamics after land use change from a native pasture to a pine plantation. Plant Soil 299, 251–262.
Harris, D.H., van Kessel, W.R., 2001. Acid fumigation of soils to remove carbonates prior to total organic carbon or carbon-13 isotopic analysis. Soil Sci. Soc. Am. J. 65, 1853.
Hijmans, R.J., Cameron, S.E., Parra, J.L., Jones, P.G., Jarvis, A., 2005. Very high resolution interpolated climate surfaces for global land areas. Int. J. Climatol. 25, 1965–1978.
Iglesias-Trabado, G., Wilstermann, D., 2009. Eucalyptus universalis. Global cultivated eucalypt forests map 2008 Version 1.0.1. 2012, Available <http:// git-forestry.com/download_git_eucalyptus_map.htm> (accessed 01.03.12; verified 06 Jan 2013). Lugo, Galacia, Spain.
Jackson, R., Canadell, J., Ehleringer, J., Mooney, H.A., Sala, O., Schulze, E., 1996. A global analysis of root distributions for terrestrial biomes. Oecologia 108, 389– 411.
Jobbágy, E.G., Jackson, R.B., 2000. The vertical distribution of soil organic carbon and its relation to climate and vegetation. Ecol. Appl. 10, 423–436.
Laganiére, J., Angers, D.A., Paré, D., 2010. Carbon accumulation in agricultural soils after afforestation: a meta-analysis. Global Change Biol. 16, 439–453. Lal, R., 2004. Soil carbon sequestration to mitigate climate change. Geoderma 123,
1–22.
Lal, R., 2005. Forest soils and carbon sequestration. For. Ecol. Manage. 220, 242–258. Lima, A., Silva, I.R., Neves, J.C.L., Novais, R.F., Barros, N.F., Mendonça, E.S., Smyth, T.J., Moreira, M.S., Leite, F.P., 2006. Soil organic carbon dynamics following afforestation of degraded pastures with eucalyptus in southeastern Brazil. For. Ecol. Manage. 235, 219–231.
Maquere, V., Laclau, J.P., Bernoux, M., Saint-Andre, L., Gonçalves, J.L.M., Cerri, C.C., Piccolo, M.C., Ranger, J., 2008. Influence of land use (savanna, pasture, Eucalyptus plantations) on soil carbon and nitrogen stocks in Brazil. Eur. J. Soil Sci. 59, 863–877.
Marin-Spiotta, E., Silver, W.L., Swanston, C.W., Ostertage, R., 2009. Soil organic matter dynamics during 80 years of reforestation of tropical pastures. Global Change Biol. 15, 1584–1597.
Neufeldt, H., Resck, D.V.S., Ayarza, M.A., 2002. Texture and land-use effects on soil organic matter in Cerrado Oxisols, Central Brazil. Geoderma 107, 151–164. Neumann-Cosel, L., Zimmermann, B., Hall, J.S., van Breugel, M., Elsenbeer, H., 2011.
Soil carbon dynamics under young tropical secondary forests on former pastures-a case study from Panama. For. Ecol. Manage. 261, 1625–1633. Oliveira, J.B.d., Camargo, M.N., Rossi, M., Calderano Filho, B., 1999. Mapa pedológico
do Estado de São Paulo: legenda expandida. Escala 1:500.000. 64.
Pan, Y., Birdsey, R.A., Fang, J., Houghton, R., Kauppi, P.E., Kurz, W.A., Phillips, O.L., Shvidenko, A., Lewis, S.L., Canadell, J.G., 2011. A large and persistent carbon sink in the world’s forests. Science 333, 988–993.
Paul, K., Polglase, P., Nyakuengama, J., Khanna, P., 2002. Change in soil carbon following afforestation. For. Ecol. Manage. 168, 241–257.
Pérez-Cruzado, C., Mansilla-Salinero, P., Rodríguez-Soalleiro, R., Merino, A., 2012. Influence of tree species on carbon sequestration in afforested pastures in a humid temperate region. Plant Soil 353, 333–353.
Post, W.M., Mann, L., 1990. Changes in soil organic carbon and nitrogen as a result of cultivation. Soils Greenhouse Effect, 401–406.
Resh, S.C., Binkley, D., Parrotta, J.A., 2002. Greater soil carbon sequestration under nitrogen-fixing trees compared with Eucalyptus species. Ecosystems 5, 217– 231.
Rezende, C.P., Cantarutti, R., Braga, J., Gomide, J., Pereira, J., Ferreira, E., Tarré, R., Macedo, R., Alves, B., Urquiaga, S., 1999. Litter deposition and disappearance in Brachiariapastures in the Atlantic forest region of the South of Bahia, Brazil. Nutr. Cycl. Agroecosyst. 54, 99–112.
Russell, A.E., Cambardella, C.A., Ewel, J.J., Parkin, T.B., 2004. Species, rotation, and life-form diversity effects on soil carbon in experimental tropical ecosystems. Ecol. Appl. 14, 47–60.
Ryan, M.G., Stape, J.L., Binkley, D., Fonseca, S., Loos, R., Takahashi, E.N., Silva, C.R., Silva, S., Hakamada, R., Ferreira, J.M., Lima, A.M., Gava, J.L., Leita, F.P., Silva, G., Andrade, H., Alves, J.M., 2010. Factors controllingEucalyptusproductivity: how resource availability and stand structure alter production and carbon allocation. For. Ecol. Manage. 259, 1695–1703.
Schedlbauer, J.L., Kavanagh, K.L., 2008. Soil carbon dynamics in a chronosequence of secondary forests in northeastern Costa Rica. For. Ecol. Manage. 255, 1326– 1335.
Schoenholtz, S.H., Miegroet, H.V., Burger, J.A., 2000. A review of chemical and physical properties as indicators of forest soil quality: challenges and opportunities. For. Ecol. Manage. 138, 335–356.
Sparovek, G., Berndes, G., Klug, I.L., Barretto, A.G., 2010. Brazilian agriculture and environmental legislation: status and future challenges. Environ. Sci. Technol. 44, 6046–6053.
Stape, J.L., Binkley, D., Ryan, M.G., 2004.Eucalyptusproduction and the supply, use and efficiency of use of water, light and nitrogen across a geographic gradient in Brazil. For. Ecol. Manage. 193, 17–31.
Tomazello, F.M., 1987. Dendrologia, estrutura anatômica e densidade básica da madeira deLiquidambar styracifluaL. ESALQ/DCF/USP 1987, 26p.
Wellock, M.L., LaPerle, C.M., Kiely, G., 2011. What is the impact of afforestation on the carbon stocks of Irish mineral soils? For. Ecol. Manage. 262, 1589–1596. Zinn, Y., Resck, D.V.S., Silva, J.E., 2002. Soil organic carbon as affected by
afforestation withEucalyptusandPinusin the Cerrado region of Brazil. For. Ecol. Manage. 166, 285–294.
Zinn, Y.L.L., Bigham, R., Resck, J.M., Dimas, V., 2007. Edaphic controls on soil organic carbon retention in the Brazilian Cerrado: texture and mineralogy. Soil Sci. Soc. Am. J. 71, 1204.