AN IMPROVED AERIAL REMOTE SENSING IMAGE DEFOGGING METHOD BASED
ON DARK CHANNEL PRIOR INFORMATION
Zhang Zhenghaoa, *, Feng Wufa a,Wang Tao a, Zhang Yan a, Ding Lua
a Information Engineering University, Zhengzhou, P.R. China – [email protected]
KEY WORDS: Aerial Remote Sensing, Defogging, Linear Stretching, Dark Channel Prior, Automatic Color Method
ABSTRACT:
Aerial remote sensing image is widely used due to its high resolution, abundant information and convenient processing. However, its image quality is easily influenced by clouds and fog. In recent years, fog and haze air pollution is becoming more and more serious in the north of China and its influence on aerial remote sensing image quality is especially obvious. Considering the characters that aerial remote image is usually in huge amount of data and seldom covers sky area, this paper proposes an improved aerial remote sensing image defogging method based on dark channel prior information. First, a 2% linear stretching is applied to eliminate the haze offset effect and provide a better initial value for later defogging processing. Then the dark channel prior image is obtained by calculating the minimum values of r, g, b channels of each pixel directly. Subsequently, according to the particularity of aerial image, the adaptive threshold t0 is set up to improve the defogging effect. Finally, to improve the color cast phenomenon, a way called automatic color method is introduced to enhance the visual effect of defogged image. Experiments are performed on normal image in fog and on aerial remote sensing image in fog. Experimental results prove that the proposed method can obtain the defogged image with better visual effect and image quality. Moreover, the improved method significantly balances the color information in the defogged image and efficiently avoids the color cast phenomenon.
* Corresponding author: Zhang Zhenghao (1994.01-), Mainly engaged in remote sensing image processing research. E-mail: [email protected].
Organization: Information Engineering University. 1. INTRODUCTION
Visual quality of optical remote sensing images is often affected by haze weather and air pollution, which results in decline of image quality, such as low objects visibility, lacked contrast details and color offset degradation. Therefore, the real application of optical remote sensing image data is influenced, which affects its function in target identification, disaster detection, remote sensing navigation, land mapping and other systems (Ji, X. Q., Feng.,2010; He, K. M.,2009). Thus, defogging of aerial remote sensing images has an important influence on the availability of images.
The fog is the aerosol molecule which is essentially bonded and formed by the tiny liquid suspended in the atmosphere and tiny particles in the air. Under fog condition, the light reflected from the object will interact with aerosol molecules in the atmosphere during the transmission to the imaging device which causing the incident energy to redistribute in all directions in a certain manner and causing change in the color and intensity of light (Tan, R.,2008; Tarel, J. P.,2009). The scattering of visible light by the aerosol molecule is the main reason for the degradation of the image(Fattal, R.,2008).
there are two main approaches used in remote sensing image defogging process: one is based on remote sensing image enhancement method such as histogram equalization 、 improved Retinex method (Jobson, D. J.,1997; Rahman, Z.,1996; Rahman, Z.,2004) based on color constancy theory(Land, E. H.,1964; Land, E. H.,1977)、wavelet transform
and curvelet transform, etc. this kind of methods all enhance the contrast ratio of image substantially; and the other approach is based on the physical model of atmospheric degradation, which analyses the scattering of the atmosphere and restores image to achieve the effect of fog reduction from the viewpoint of physical model. Three scholars Yizhaky、Dror and Kopeika from Israel proposed a consistent image degradation model in 1997(Yitzhaky, Y.,1998). John P. Oakley and Brenda L. Satherley from England proposed a defogging method based on three parameters atmospheric degradation model in 1998.
The former approach is simple in computation but lacks the consideration of image physical model, and the later one is complete but involves too much parameter. Taking separate properties of these two approaches, He et proposed a method for single image defogging based on dark channel prior information in 2011(He etc. 2011). Although the method doesn’t introduce the complete physical model of atmospheric degradation, but it takes advantage of the mathematical model of images in fog in consideration and simplified the calculation model by a certain prior knowledge by reducing many difficult parameters. Meanwhile, it keeps the real object radiation information as much as possible. This method is a compromise between the approach based on image enhancement and the approach on the physical model of atmospheric degradation, so that the image defogging process is simpler and more efficient (Wang ect. 2011). Our research is based on this method, but we found that after defogging, image resolution is not significantly improved and color cast phenomenon is apt to occur. Thus, we improve He’s method by using the linear stretching method to
enhance the image firstly, and then put forward an automatic thresholds setting method for using the dark channel prior information, finally, we use the automatic color method to process the defogged image to avoid the color cast effect. After these improvements, we get the defogged image with good visual effect and true color.
2. THE PRINCIPLE OF USING DARK CHANNEL PRIOR INFORMATION
2.1 The Model of Defogging
McCartney atmospheric scattering model(Wu, D.,2015; Sun, Y. B.,2007; Lin, Y.,2013) is one of the most widely used model in computer vision and graphics. The original He’s defogging light composition and in real processing it takes the value of the highest brightness point in the original image in fog. t(x) is the description of the scene color information transmission in various regions and called the Transmission Map.
And the defogged image J(x) we need can be calculated from the formula (1), its deformation form is as follow:
A
From the formula (2) we can know, in order to get the defogged image, we need the information about t(x) and A, But the current conditions doesn’t full fill the requirements. Therefore, we must find out t(x), and in finding out the t(x), the knowledge of dark channel prior information should be used.
2.2 The Definition of Dark Channel Information
Dark channel information means that for vast outdoor fog free images, there are always some pixels in the non-sky area. At least one of these pixels has a very low intensity in the color channel and the value is close to 0. The theory proposer analyzed about five thousand outdoor fog free pictures to obtain the law. For an imageJ(x), the following formula can be used to represent its dark channel prior information:
))
pixel point. means a local region around x point.Dark channel prior information theory points out that the intensity of dark channel prior is always small and tend to 0 except for the sky area, it can be represented as follows:
0
dark
J
(4)On the basis of the above analysis we can deform the formula (1) as follows: formula. As is stated above, value of A is taken as the value of the highest brightness point in the original image in fog
I
(x
). Applying the minimum value calculation twice on both side of formula (5), we can get the following formula:)
In combining with formula (3) and (4), we can get formula (7) for calculating transmission map value from formula (6):
)
defogged image more realistic (because when people observe distant objects, they are always affected by fog). Moreover, the presence of fog can let people feel the presence of depth of field. Thus, in the formula (7), a factor ω between [0,1] is introduced, which makes the calculated transmission value is bigger than the real value and lowers the defogging extent. So that the formula (7) is rewritten in the following formula:)
Combine with the formula (2) and (8) then we can calculate the defogged image J(x).
2.3 Improved Aerial Remote Sensing Image Defogging Method Based on Dark Channel Prior Information
In calculating the dark channel prior image, we l use the region of interest (ROI) to process different block to get the dark channel prior image. It is found that the size of the block will directly affect the transmissivity calculation result and determine the final defogging effect. The smaller the block is, the more accurate the dark primary color, the more details of the texture and the better realistic the Transmission Map are. But the smoothing effect will decrease. Onn the contrary, the larger the block is, the sparser the dark channel prior is and the less details and information appears in the estimated Transmission Map but the smooth feeling will be enhanced (Ji, X. Q.,2011). We choose the smaller block to get the more detailed dark channel prior image for a better sophisticated image effects.
The guided filter is a new image filter which is assumed to be a local linear image transform model between the guided image I and the filtered output image Q. It smooths the input image and enhances the edge at the same time by considering the content of guide image. Moreover, the guide filter can be converted into a filtered output and used in many new filtering applications. We use the dark channel prior image Jdark(x) as guide image
the guide filter we can smooth the transmission map and enhance the edge information at the same time, which keeps the transmission map more detailed. It also helps to enhance the clarity of the structure image when calculating the defogged image.
In studying the dark channel prior image, we found that the method has better effect in dealing with images with the small field depth and the uniform concentrated fog. The reason is that the original He’s method cannot realize adaptive parameter setting for different fog concentration situation, each time parameter setting is only suitable for dealing with fog concentration at a certain situation. Thus, we propose to use the 2% piecewise linear stretching to process the image in fog in advance to realize automatic parameter settings.
The purpose of using piecewise linear stretching is to highlight the key information in the image and increase the difference in the characteristics of different objects in the image. By piecewise linear stretch, he visual effect of image can be improved so that the subsequent processing and analysis can be more convenient.; The application of piecewise linear stretch can enhance image contrast ratio, highlight the differences in fog and scenery,and achieve a preliminary defogging effect on the image with thick fog. It can weaken the thicker fog to a less level and take advantageous in the next step of defogging process.
Afterwards we use the method based on dark channel prior information to process the stretched image. Because the aerial remote sensing image doesn’t cover shy area and doesn’t need keeping a certain fog concentration to make the image more real. Thus, the influence factor ω in the original He’s method can be weakened to get a better defogged image. And in calculating the transmission map t(x), we use the guide filter to refine the transmission map calculating result, which will make the detail information of the image more abundant and get a better refinement image.
At the same time, He (He etc., 2011) set a low limit value t0 on transmission map to avoid the noise in defogging processing from the transmission map. Therefore, the formula used to calculate the defogged image is changed as follows:
A
t
x
t
A
x
I
x
J
)
),
(
max(
)
)
(
(
)
(
0
(9)
In the original defogging method, the value of t0 is set between 0.1 and 0.3. the purpose is to avoid the small value in the transmission map which will lead to J(x)infinity and can’t
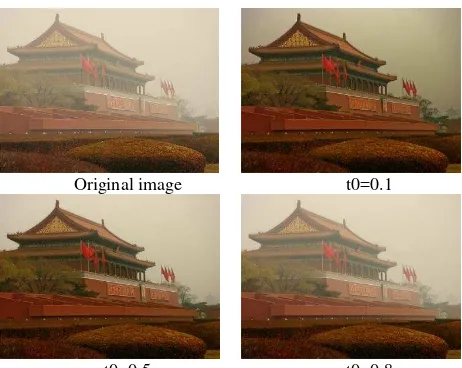
get the final result image. In experiments we can found that, by changing the value of t0, the bigger t0 is, the worse the defogging effect is, but the color of the image is more realistic, whereas the defogging effect is better, but the darker the image is. The reason is that if the value of t0 is larger, there are only a small part of image, whose value is greater than threshold t0, involves in defogging process. Thus, only the part with greater transmission (low concentration fog) has been processed in defogging, so the effect of defogging is bad and no significant. The experiment results are shown in Figure 1. We can see that the bigger the value of t0 is, the worse the defogging effect is, but the more realistic the image color is.
Original image t0=0.1
t0=0.5 t0=0.8
Figure 1. Comparison of different t0 values on image effects
For in the aerial remote sensing image, the fog is usually uniformly-distributed. Therefore, a single block size ROI can be chosen to process the aerial remote sensing image firstly and then a larger t0 is taken to calculate the result image in the last step to achieve the best defogging effect. We set the value of t0 reasonable by adjusting it for the best effect of the defogged image.
Finally, the automatic color scheme is applied. The main idea of automatic color scheme is to remove the pixels with the highest grey values and the lowest grey values, and then let the rest pixel values of the image in [0,255] by using the linear mapping or gamma correction. The principle of automatic color is roughly same with the 2% linear stretching but it performs better in enhancing the image color saturation. The function of automatic color method last used is to enhance image contrast and to optimize the visual effect of the defogged image. It’s also in order to facilitate the subsequent image processing work.
The main steps of our improved defogging method is shown in Fig. 2
Figure 2. Flow chart of fog removal test for aerial images
3. EXPERIMENT RESULT AND ANALYSIS
3.1 Experiment Data Introduction
The experiment data we selected are an ordinary image in fog from our daily life taken by a camera and an aerial remote
Input the image in fog
2% line stretch processing
Calculate the dark channel image
Calculate the transmission map(t(x)=1)
Calculate the defogged image (adaptive adjustment t0 value)
Get the result image after using auto levels
sensing image of an airport. We designed four groups of test to validate the performance of the improved algorithm.
In each group of test, the processing scheme is designed as follows:
I. Defogging process is applied directly on the original ordinary image in fog with no preliminary linear stretch processing.
II. The original ordinary image in fog is linear stretch processed firstly, and then defogging process is applied with the value of ω remained unchanged, finally automatic color scheme is applied.
III. Defogging process is applied directly on aerial remote sensing image in fog with no linear stretch processing. IV. The aerial image in fog is firstly processed by linear
stretch firstly, and then the defogging process is applied with the value of ω set infinity to 1, finally automatic color scheme is applied.
3.2 The Result of Experiment
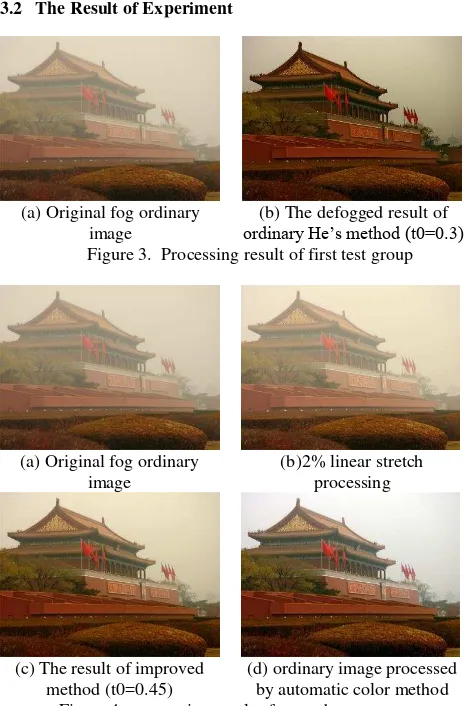
(a) Original fog ordinary image
(b) The defogged result of ordinary He’s method (t0=0.3) Figure 3. Processing result of first test group
(a) Original fog ordinary image
(b)2% linear stretch processing
(c) The result of improved method (t0=0.45)
(d) ordinary image processed by automatic color method Figure 4. processing result of second test group
(a) Original aerial image in fog
(b) The defogged result of ordinary He’s method (t0=0.3) Figure 5. Processing result of third test group
(a) Original aerial image in fog
(b) 2% linear stretch processing
(c) The result of improved method (t0=0.75)
(d) The aerial image processed by automatic color method Figure 6. The processing result of fourth group
3.3 The Analysis of Experiment
The experiment results are shown from figure 3 to figure 6. From the subjective visual interpretation, the quality of image has been improved obviously by using the improved algorithm. we can see the image is clear and colorful, showing most details of the image with good hierarchy. Compare with figure 3 (b) and figure 4 (d) can be seen that the defogging effect of aerial remote sensing images is not obviously decline compare of the ordinary image in fog. Compare with the figure 6 (d) and figure 5 (b) we can see that the quality of image has been improved obviously, a better color effect is obtained after the defogging process and the phenomenon of partial color is avoided because of the color of the image is balanced. From the contrast of figure 6 (c) and figure 5 (b) and the contrast of figure 4 (c) and figure 3 (b) we can come to the conclusion that increase the value of t0 appropriately will help to improve the quality of the image and it also doesn’t influence the effect of defogging, especially for the fog of aerial remote sensing images is well-distributed. From the contrast of figure 6 (b) and figure 5 (b) and the contrast of figure 4 (b) and figure 3 (b) we can see that the 2% linear stretch of the image can weaken the dense fog and improve the quality of the image, so as to provide convenience for the subsequent processing.
Therefore, the effectiveness has been verified that whether it is from the perspective of image quality and clarity, the method we proposed can enhance the defogging effect effectively, improve the quality of image and get more clear, details more prominent and structure more obvious image.
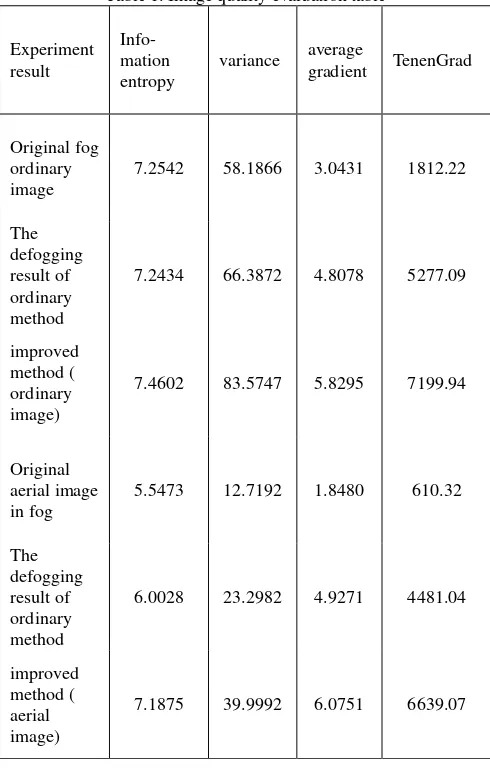
Table 1. Image quality evaluation table
Experiment result
Info-mation entropy
variance average
gradient TenenGrad
Original fog ordinary image
7.2542 58.1866 3.0431 1812.22
The defogging result of ordinary method
7.2434 66.3872 4.8078 5277.09
improved method ( ordinary image)
7.4602 83.5747 5.8295 7199.94
Original aerial image in fog
5.5473 12.7192 1.8480 610.32
The defogging result of ordinary method
6.0028 23.2982 4.9271 4481.04
improved method ( aerial image)
7.1875 39.9992 6.0751 6639.07
4. CONCLUSION
In the light of the characteristics of aerial remote sensing images and the requirements of image quality, some improvements have been made on the basis of the dark channel prior method, so that it can be applied to meet the requirements of aerial remote sensing image quality. At the beginning of this paper we introduced the basic principle of dark channel prior and then expounded the improved method and the reason for improvement. Finally, a series of images are processed by experiments and the advantages have been reflected by the subjectively and objectively image quality judgement. The experiment result shows: without considering the processing time, the quality of aerial remote sensing image defogging result has been greatly improved and make it meet the requirement of follow-up operation by using the method we used compared with the original method. It also increases the utilization rate of aerial remote sensing images by using the improved algorithm based on dark channel prior information.
On the basis of above, we still haven’t solved the problem of bad defogging effect when the concentrations of fog are uneven
in the image. Now we propose a method that process the fog of different concentrations by using the subsection processing of artificial selection. And this idea will be demonstrated in the next step of the research work.
REFERENCES
Ji, X. Q., Feng, Y. P., Dai, M., “Real-time defogging processing of aerial images,” Proceedings of IEEE International Conference on Wireless Communications Networking and Mobile Computing, Chengdu, China, 2010, pp.1556-1660.
He, K. M., Sun, J., Tang, X. O., “Single image haze removal using dark channel prior, “Proceedings of IEEE Conference on Computer Vision and Pattern Recognition, Miami, 2009, pp.1956-1963.
Tan, R., “Visibility in bad weather from a single image,” Proceedings of IEEE Conference on Computer Vision and Pattern Recognition, Alaska, USA, 2008, pp.1-8.
Tarel, J. P., “Fast visibility restoration from a single color or gray level image,” Proceedings of IEEE Conference on International Conference on Computer Vision, Kyoto, Japan, 2009, pp.20-28.
Fattal, R., 2008a. Single image dehazing. ACM Transactions on Graphics, SIGGRAPH. 27(3), pp.1-9.
Land, E. H., 1964a. The retinex. American Scientist. 52(2), pp.247-264.
Land, E. H., 1977a. The retinex theory of color vision. Scientic America. 237(6), pp.108-128.
Jobson, D. J., Rahman, Z., 1997a. Woodell G A. Properties and performance of a center/surround Retinex. IEEE Transactions on Image Processing, 6(3), pp.451-462.
Rahman, Z., Jobson, D. J., “Woodell G A. Muti-scale retinex for color image enhancement”, In: Proceedings of the 1996 International Conference on Image Processing. Lausanne: IEEE, 1996, pp.1003-1006.
Rahman, Z., Jobson. D. J., Woodell, G. A., 2004a. Retinex processing for automatic image enhancement. Journal of Electronic Imaging, 13(1), pp. 100-110.
Yitzhaky, Y., Dror, I., Kopeika, N., 1998a. Restoration of atmospherically blurred images according to weather-predicted atmospheric modulation transfer function. Optical Engineering, pp.36.
John, P. O., Brenda, L. S., “Improving image quality in poor visibility conditions using a physical model for contrast degradation,” IEEE Transactions on Image Processing,1988,7(2), pp. 167-179.
Wang, S. Z., 2011. Research on fog removal technology of remote sensing images. Zhengzhou, information engineering university, pp. 1-3.
Wu, D., Zhu, Q. S., 2015a. The latest research progress of image dehazing. Actc Automatica Sinica, 02, pp. 221-239.
Lin, Y., Xu, Z. Y., Wang, J. Y., 2013a. Simulation research on non-line-of-sight atmospheric propagation in fog weather. Acta Optica Sinica, 33(9), pp. 0901001.