SPATIAL RESOLUTION ASSESSMENT OF THE TELOPS AIRBORNE TIR IMAGERY
S. Mousakhani a, M. Eslami a*, M. Saadatsereshta
a School of Surveying and Geospatial Engineering, University of Tehran, Tehran, Iran
[email protected] [email protected] [email protected]
KEY WORDS: Thermal InfraRed, SNR, Image processing, Classification, Spatial resolution, Spectral content
ABSTRACT:
Having a high spatial resolution of Thermal InfraRed (TIR) Sensors is a challenge in remote sensing applications. Airborne high spatial resolution TIR is a novel source of data that became available lately. Recent developments in spatial resolution of the TIR sensors have been an interesting topic for scientists. TIR sensors are very sensitive to the energies emitted from objects. Past researches have been shown that increasing the spatial resolution of an airborne image will decrease the spectral content of the data and will reduce the Signal to Noise Ratio (SNR). Therefore, in this paper a comprehensive assessment is adapted to estimate an appropriate spatial resolution of the TIR data (TELOPS TIR data), in consideration of the SNR. So, firstly, a low-pass filter is applied on TIR data and the achieved products fed to a classification method for analysing of the accuracy improvement. The obtained results show that, there is no significant change in classification accuracy by applying low-pass filter. Furthermore, estimation of the appropriate spatial resolution of the TIR data is evaluated for obtaining higher spectral content and SNR. For this purpose, different resolutions of the TIR data are created and fed to the maximum likelihood classification method separately. The results illustrated in the case of using images with ground pixel size four times greater than the original image, the classification accuracy is not reduced. Also, SNR and spectral contents are improved. But the corners sharpening is declined.
* Corresponding author 1. INTRODUCTION
In recent decades, Geomatics sciences, particularly Remote Sensing (RS) and photogrammetry, have provided various data and information for urban planning organizations, services and municipals (Aguilar et al. 2016). Traditional procedures to extract data, from surveying to optical image analysis do not answer the needs of today’s society. Therefore, the usage of the various sensors that provide different data is increasing rapidly. Thermal InfraRed (TIR) data has long been used by various RS scientists (Meer et al. n.d.), (Prakash 2000). This kind of the data’s spatial resolution was not better than several meters due to the nature of their radiation power. Nowadays, the importance of the TIR remote sensing in various studies, made it to be considered by researchers to growth basic researches in the field of the TIR sensors development. TIR data has been used in many applications as: urban heat islands detection, thermal mapping, military applications, buildings waste heat studies and so on (Weng 2009).
Recently, by developing TIR sensors technologies, a revolution has been occurred in their spatial resolutions and novel high spatial resolution TIR data are reached. So, innovative researches have been done in order to use this data for several submissions (Liao et al. 2015).
Manufacturers such as TELOPS company has worked on spatial resolution of TIR data, so high spatial resolution TIR data of the TELOPS gets revolution in remote sensing and other applications (Escalante-Ramírez 2012). The Hyper-Cam LW is an advanced passive TIR hyperspectral imaging system that combines high spatial and spectral resolution. The camera with
320 × 256 pixels sensor size. The airborne platform is equipped with a stabilization system and an image motion compensation mirror. The spectral range of the data is 7.7 - 11.8 μm.
Recent high spatial resolution TIR data allows the researchers to assess new and different methods for urban objects detection applications (Eslami and Mohammadzadeh 2017). Integration of the TIR and visible data for urban object detection and classification to improve qualitative and quantitative precisions is one of the new field of study. IEEE Geoscience & Remote Sensing Society (GRSS) held up a data fusion contest on the integration of the TIR and visible data for urban object detection (Liao et al. 2015).
In object extraction applications, high spatial resolution data employment is an essential manner. Signal to Noise Ratio (SNR) is an effective index for having high spectral content of the data. In RS and photogrammetry SNR limits the simultaneous data achieving with high spatial and high spectral resolution (Fauvel et al. 2013). If high spectral resolution is desired, it should be reduced spatial resolution. Therefore, to obtain images with high spatial resolution, the spectral resolution is losing and panchromatic images are considered. New high spatial resolution TIR data (TELOPS TIR sensor) needs to be analyzed about SNR for testing the appropriate spatial resolution in order to keep maximum SNR required for urban land cover applications. Therefore, in this study, several pyramids from TIR data have been produced for a comprehensive investigation of the spatial resolution in order to explore spectral content and SNR. The original data’s ground pixel size is 1-meter in which created two new images have The International Archives of the Photogrammetry, Remote Sensing and Spatial Information Sciences, Volume XLII-4/W4, 2017
Tehran's Joint ISPRS Conferences of GI Research, SMPR and EOEC 2017, 7–10 October 2017, Tehran, Iran
This contribution has been peer-reviewed.
spatial resolutions of 2 and 4-meters. Then, the original and produced data are evaluated in different ways to test the suitable spatial resolution of the airborne TIR in order to retain maximum SNR and spectral content.
The rest of the paper contains two sections. Section 2 describes the methods and materials and section 3 refer to results and discussion.
2. METHODS AND MATERIALS
The main plan of this paper is a several step process. Firstly, a low pass filter is applied on the TIR data to enhance the original image and reduce the noise of the data. A complete analysis has been applied on the performance of the low pass filter for SNR improvement on the TIR data. Then, a study has been applied to estimate the appropriate ground pixel size of the TIR data with high spectral content. several pyramids from TIR data have been produced for a comprehensive investigation of the spatial resolution in order to explore spectral content and SNR.
2.1 STUDY AERA AND DATA SET
The data set of this study was provided for the Data Fusion Contest 2014 by the Image Analysis and Data Fusion (IADF) Technical Committee of the IEEE GRSS. The data obtained by TELOPS (Canada) corporation on the urban area near Thetford Mines in Québec (Figure 1). The data has been acquired on May, 21, 2013 with averagely 807-meter height of airborne sensors above ground. Likewise, the average temperature of the study area was 13 degrees Celsius. TIR data which covers 7.8 to 11.5 µm wavelengths with 84 spectral bands with about 1-meter spatial resolution and is shown in Figure 2.
Until now this kind of data is a unique data set, so we tested our proposed strategy only on the one study area. We used two separate bands of the TIR data (7.8 and 9 µm wavelengths) as two study data set. All investigation has been applied individually on this two bands which are as candidates of the different wavelengths of the TIR data. There is lack of data in the black areas of the visible image.
Figure 1. study area, the Thetford mines in Québec
The train and test data of the mentioned data fusion contest are used for training and evaluation of the proposed method. Also, we divided train data into group one (with 20% of the training data) and group two (with 80% of the training data). Group one and two are used for training and evaluation of the proposed method respectively. Finally, the test data is applied to the final assessment of the proposed method.
Figure 2. Visible image (a), Thermal data (b), Train data set (c) and Test data set (d)
3. RESULT AND DISCUSSION
Satellite and airborne images are typically noisy for different reason; the main sources of noise are the imaging systems, transferring images from communication channels process and so on.
Figure 3. Noise in the TIR data
Also, imaging sensors are effected by many factors, such as environmental exposure conditions. For example, TIR imaging The International Archives of the Photogrammetry, Remote Sensing and Spatial Information Sciences, Volume XLII-4/W4, 2017
Tehran's Joint ISPRS Conferences of GI Research, SMPR and EOEC 2017, 7–10 October 2017, Tehran, Iran
This contribution has been peer-reviewed.
sensors are effected by internal heat of systems, different time of imaging and etc. [9]. The TELOPS airborne TIR data are very noisy (Figure 3). So, in order to decrease the influence of the noise, a median low pass filter is applied on TIR data. Then the produced outcome of the low pass filter is combined with the visible image and fed to a maximum likelihood classification method (Sisodia el al. 2014). The achieved results are shown in Table 1 and 2. The obtained results show there is not significant improvement in the accuracy of the classification by applying low pass filter on the TIR data. Quantity of the TIR data is not improved by applying the low pass filter procedure.
3.1 Spatial resolution decreasing
For further evaluations, spatial resolution of the original TIR data is reduced to 2 and 4-meter (more decreasing spatial resolution will destroy these TELOPS data). The pyramid providing procedure is done by averaging (resampling) neighborhood 4 pixels to build the new pixel of the next level of the pyramid.
Figure 4. TIR data with ground pixel size 1-meter (a), 2-meter (b) and 4-meter (c)
Table 1. Accuracies of the applied pyramids and low-pass filter on the first selected band of the data set
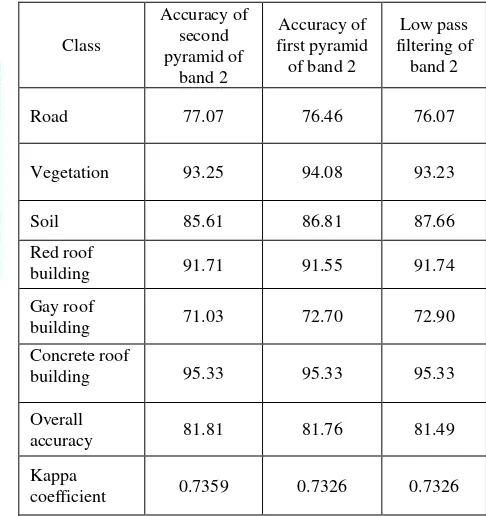
The produced new TIR data are again combined with visible image and fed to MLC method separately. The obtained results of the confusion matrix on two different data sets are shown in Table 1 to Table 2.
The achieved results are revealed by decreasing the spatial resolution of the TIR data there is not important classification accuracy reduction. While it seems, there is improvement in SNR and spectral content as shown in figure 4. While in some classes of interest the class accuracy is enriched in some other is decreased. apparently insignificant (Figure 6).
Low pass
Table 2. accuracies of the applied pyramids and low-pass filter on the second selected band of the data set
Figure 5. Classification result on original TIR data The International Archives of the Photogrammetry, Remote Sensing and Spatial Information Sciences, Volume XLII-4/W4, 2017
Tehran's Joint ISPRS Conferences of GI Research, SMPR and EOEC 2017, 7–10 October 2017, Tehran, Iran
This contribution has been peer-reviewed.
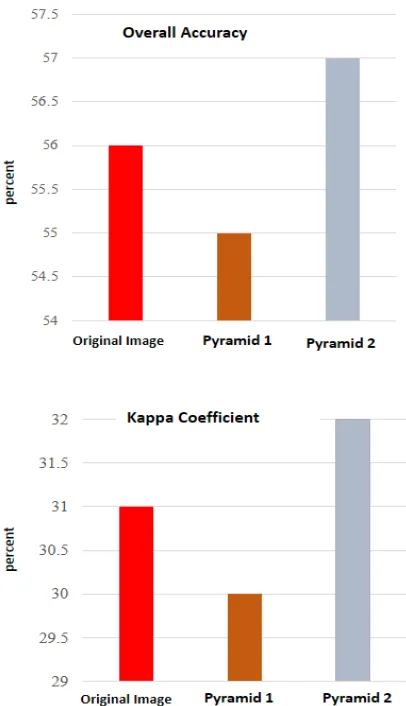
Figure 6. Kappa Coefficient and overall accuracy values on the different spatial resolutions of the first selected band of the data
set
Although, decreasing the spatial resolution of the data will increase the spectral content and SNR. Obviously, in figure 7 quantity of the TIR data is improved by applying the decreasing spatial resolution procedure. Nonetheless the sharpness of the data is losing (figure 7). As illustrated in figure 7, the edges in 1-meter TIR data are very sharper than the edges in 2-meter data. But the noise is very obviously distributed in original TIR data while in 2-meter one is decreased.
Figure 7. The sharpness of the 1-meter (b) and 4-meter (b) TIR data
Conclusion
Remote sensing data understanding is an undeniable efficient requirement for high performance usage of them. TIR data has been used widely in remote sensing applications. Recently, TIR data have interested researchers of the geomatics sciences because of the spatial resolution improvement. In this research, a broad assessment is applied to estimate an appropriate spatial resolution of the TIR data (TELOPS TIR data) for increasing SNR. Therefore, the pyramid was produced for first and second image to have spatial resolution data. Therefore, first and second pyramids of the original image have been produced to have different spatial resolutions. Various evaluations have been shown; for different application of the urban object detection, using an image with 4-meter ground resolution TIR data has approximately equal results in comparison to the original data. So as mentioned beforehand, with increasing the spatial resolution of an airborne image, the spectral content of the data and the SNR will be reduced. The results are shown by decreasing the spatial resolution of the TIR data the classification accuracy is improved about 2 percent (from 55.8% to 57.1%). Therefore, using of the airborne TIR data with higher spatial resolution does not guaranties the accuracy improvement. In future, we will examine further high spatial resolution TIR data achieved with other platforms as drones.
REFERENCES
Aguilar, Manuel A. et al. 2016. “Classification of Urban Areas from Geoeye-1 Imagery through Texture Features Based on Histograms of Equivalent Patterns.” European Journal of Remote Sensing 49(May): 93–120.
Escalante-Ramírez, Boris. 2012. Remote Sensing – Applications REMOTE SENSING – ADVANCED TECHNIQUES Edited by Boris Escalante-Ramírez. Eslami, Mehrdad, and Ali Mohammadzadeh. 2017. “A Novel
Method for Urban Land Cover Mapping Based on New Vegetation Indices and Texture- Spectral Information from Fused Visible and Hyperspectral Thermal Infrared Airborne Data.” European Journal of Remote Sensing 50(1). https://doi.org/10.1080/22797254.2017.1328645. Fauvel, Mathieu et al. 2013. “Advances in Spectral-Spatial
Classification of Hyperspectral Images.” Proceedings of the IEEE 101(3): 652–75.
Liao, Wenzhi et al. 2015. “Processing of Multiresolution Thermal Hyperspectral and Digital Color Data: Outcome of the 2014 IEEE GRSS Data Fusion Contest.” IEEE
Journal of Selected Topics in Applied Earth
Observations and Remote Sensing 8(6): 2984–96. Meer, Freek Van Der et al. “Remote Sensing and Digital Image
Processing.”
Prakash, Anupma. 2000. “Thermal Remote Sensing: Concepts,
Issues and Applications.” … Archives of
Photogrammetry and Remote Sensing XXXIII: 239–43. Sisodia, P.S., Tiwari, V. and Kumar, A., 2014, May. Analysis
of supervised maximum likelihood classification for remote sensing image. In Recent Advances and Innovations in Engineering (ICRAIE), 2014 (pp. 1-4). IEEE.
Weng, Qihao. 2009. “Thermal Infrared Remote Sensing for Urban Climate and Environmental Studies: Methods,
Applications, and Trends.” ISPRS Journal of
Photogrammetry and Remote Sensing 64(4): 335–44. The International Archives of the Photogrammetry, Remote Sensing and Spatial Information Sciences, Volume XLII-4/W4, 2017
Tehran's Joint ISPRS Conferences of GI Research, SMPR and EOEC 2017, 7–10 October 2017, Tehran, Iran
This contribution has been peer-reviewed.