Full Terms & Conditions of access and use can be found at
http://www.tandfonline.com/action/journalInformation?journalCode=cbie20
Download by: [Universitas Maritim Raja Ali Haji] Date: 17 January 2016, At: 23:14
ISSN: 0007-4918 (Print) 1472-7234 (Online) Journal homepage: http://www.tandfonline.com/loi/cbie20
FIFTY YEARS OF TRADE POLICY IN INDONESIA: NEW
WORLD TRADE, OLD TREATMENTS
Mari Pangestu, Sjamsu Rahardja & Lili Yan Ing
To cite this article: Mari Pangestu, Sjamsu Rahardja & Lili Yan Ing (2015) FIFTY YEARS OF TRADE POLICY IN INDONESIA: NEW WORLD TRADE, OLD TREATMENTS, Bulletin of Indonesian Economic Studies, 51:2, 239-261, DOI: 10.1080/00074918.2015.1061915
To link to this article: http://dx.doi.org/10.1080/00074918.2015.1061915
Published online: 24 Aug 2015.
Submit your article to this journal
Article views: 209
View related articles
ISSN 0007-4918 print/ISSN 1472-7234 online/15/000239-23 © 2015 Indonesia Project ANU http://dx.doi.org/10.1080/00074918.2015.1061915
* The authors would like to thank Rizki Siregar, Muhammad Rizqy, and Skotlastika Indasari for their excellent research assistance.
Fifty Years of
BIES
FIFTY YEARS OF TRADE POLICY IN INDONESIA:
NEW WORLD TRADE, OLD TREATMENTS
Mari Pangestu* Sjamsu Rahardja*
University of Indonesia Jakarta, Indonesia
Lili Yan Ing*
Economic Research Institute for ASEAN and East Asia; University of Indonesia
Indonesia’s trade policy has evolved over the last 50 years. It has been inluenced by the country’s level of development and the conlict between openness and
protectionism; external developments, such as commodity booms and busts and increased competition; and international commitments, whether multilateral or regional. As a result, trade policy has often been ambivalent and ineffective. Given that Indonesia has undergone various transformations and that the world is a differ-ent place from what it was in 1965, the country needs to take a more pragmatic and forward-looking stance. Trade policy needs to be part of a comprehensive strategy to improve competitiveness and diversify exports. If Indonesia is to be part of the new paradigm, where the production of goods and services is based on production networks and global value chains, its policy focus will need to shift from protecting and favouring sectors to promoting trade and industrial policies that encourage the
low of goods, services, and people.
Keywords: trade policy, political economy, export strategy, integration, globalisation JEL classiication: F5, F6, F13
INTRODUCTION
Indonesia’s international trade has undergone many transformations in the last 50 years. Changes in its growth and structure have relected changes in the country’s comparative advantages and trade and development policies, as well as incon-stant global circumstances and the evolving rules of the multilateral, regional, and bilateral trade agreements in which Indonesia has participated. This article traces these transformations across ive phases, with an emphasis on their coverage in this journal, the Bulletin of Indonesian Economic Studies (BIES). The focus here will
BOX 1 Five Phases of Indonesia’s Trade Policy, 1965–2015
1965–71: From Chaos to Rehabilitation
Sukarno’s Old Order ended in chaos and was characterised by trade controls, includ
-ing import bans, quotas, tariffs, and foreign-exchange allocation. Soeharto’s New Order, in contrast, uniied the exchange rate, opened up the capital account, wel -comed foreign investment, and normalised trade policy.
1971–85: Import Substitution
An oil boom sparked an episode of Dutch disease and increased Indonesia’s depend
-ency on oil exports and revenues. The government’s import-substitution policy esca -lated effective rates of protection. Some policies promoted local content, strategic
industries, and directed lending, while others banned timber and rattan exports. This period also saw the devaluation of the rupiah in 1978, continued import substitution, and import licensing that beneited vested interests.
1985–99: Devaluation, Bold Deregulation, and Export Diversiication
The end of the oil boom, in the mid-1980s, coincided with a worldwide recession. The government responded with bold deregulation and an aggressive export-diversii
-cation strategy. Indonesia’s trade policy was inluenced by the establishment of the ASEAN Free Trade Area in 1991, liberalisation in the lead-up to the Bogor goals of the 1994 APEC Leaders’ Meeting, and the formation of the WTO in 1995. But at the same time import monopolies emerged and the country embarked on the develop -ment of a national car. Economic overheating in Asia during 1993–97 culminated in
the 1997–98 Asian inancial crisis, which caused dramatic economic, inancial, and
political upheaval.
1999–2004: Recovery and Soul-Searching
The IMF program dominated this phase—along with the removal of all import restric -tions, a reduction of tariffs, the importing of agricultural products, and major
institu-tional changes, including the establishment of Bulog (the Nainstitu-tional Logistics Agency). Ambivalence about the program during 2002–4 saw the reintroduction of import and
export restrictions and instances of creeping protectionism. As chair of ASEAN in 2003, Indonesia initiated the ASEAN Economic Community and participated in the ASEAN Plus One free-trade agreements (FTAs), having signed the ASEAN–China Free Trade Agreement in 2002.
2004–15: More Reform, More Dutch Disease, and the Global Financial Crisis The Yudhoyono government sought to simplify trade policy by reducing trade restric -tions and increasing transparency. In international trade negotia-tions, Indonesia
adopted a multitrack approach: multilateral, regional, and bilateral. A commodity boom during 2004–11 saw exports triple and brought on a second episode of Dutch disease. During 2012–14, in the wake of the global inancial crisis and the collapse of commodity prices, exports declined, creating a trade deicit. Creeping protectionism led to many trade restrictions being reintroduced, while ambivalence about openness did little to solve the ongoing problem of how to diversify exports.
be trade policy: its aims, the instruments used by different governments to imple-ment it, and its evolution. We start with the chaotic period at the end of Sukarno’s Old Order; assess different phases of Soeharto’s New Order, which ended during the 1997–98 Asian inancial crisis; and move from the aftermath of the crisis to the post-crisis reform period and into more recent times (box 1).
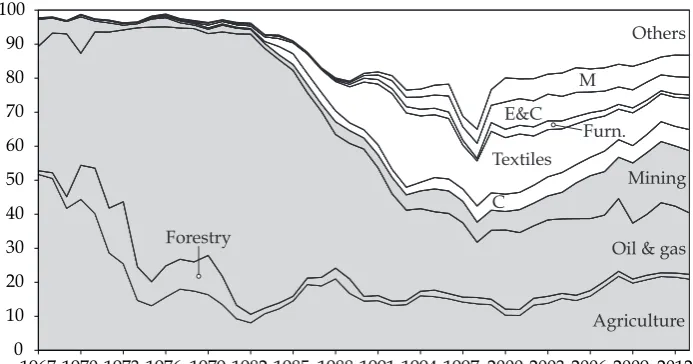
An overview of exports, imports, and net trade in Indonesia over the last 50 years reveals a number of important trends. In the irst two decades, 1965–85, commodity exports dominated agriculture, forestry, and especially oil and gas, which accounted for 80% of exports. Subsequently, from 1985, the government sought to diversify exports, including manufactured exports, and the share of oil and gas decreased to around 25%. After the early 2000s, however, the importance of mining- and agriculture-based exports increased again, whereas the share of manufactured exports declined and the share of oil and gas exports continued to fall (igure 1). The current share of resource-based exports is around 60%. Given the bias in Indonesia’s manufacturing industry towards capital-intensive com-modity processing, imports of machinery (capital goods) and intermediate goods (chemicals, electronics, and computers) have been dominant (igure 2). Oil’s share of imports has grown as domestic production has declined and demand has increased.
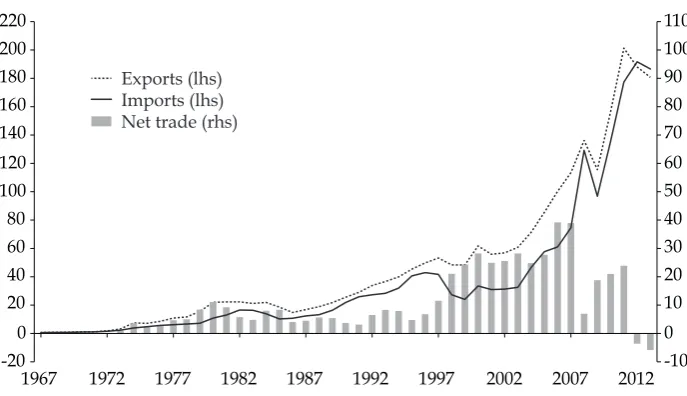
Indonesia’s trade balance has been in surplus for most of the last 50 years. Exports more than doubled during the oil boom of the 1970s and 1980s, from $11 billion in 1978 to $25 billion in 1985. They doubled again during the diversiica-tion from commodities to manufactured products in 1985–96, from $25 billion to $49 billion. After the 1997–98 Asian inancial crisis, exports more than tripled— mainly owing to another commodity boom—from $56 billion in 2004 to $200 billion in 2011. In the last few years, however, declines in the demand for and prices of commodities and a sharp rise in oil imports, which made Indonesia a net importer of oil and oil products in 2012, pushed the trade balance into deicit for the irst time (igure 3). As in the mid-1980s, this deicit requires Indonesia to con-sider diversifying and increasing its exports, and to identify policies that would encourage export competitiveness.
FIGURE 1 Proportion of Indonesia’s Merchandise Exports by Industry, 1967–2013 (%)
1967 1970 1973 1976 1979 1982 1985 1988 1991 1994 1997 2000 2003 2006 2009 2012 0
Source: Authors’ calculations based on data from UN Comtrade.
Note: Resource-based exports are shaded. M = machinery. E&C = electronics and computers.
Furn. = furniture. C = chemicals.
FIGURE 3 Indonesia’s Exports, Imports, and Trade Balance, 1967–2013 ($ billion)
1967 1972 1977 1982 1987 1992 1997 2002 2007 2012
-20
Source: Authors’ calculations based on data from UN Comtrade.
1967 1970 1973 1976 1979 1982 1985 1988 1991 1994 1997 2000 2003 2006 2009 2012 0
Source: Authors’ calculations based on data from UN Comtrade.
Note: Resource-based imports are shaded. Furniture imports were negligible. E&C = electronics and computers. T = textiles.
1965–71: FROM CHAOS TO REHABILITATION 1965–66: End of the Old Order
During the Old Order (1950–65), the main objectives of trade policy were to raise public revenue and control foreign-exchange earnings, combined with a grow-ing emphasis on increasgrow-ing indigenous Indonesian control over all aspects of economic activity. Under President Sukarno’s Guided Economy and Berdikari (self-reliance) principles, economic policy veered towards centralised planning, nationalisation, and government control of foreign trade. Import restrictions lim-ited foreign-exchange earnings; imports were replaced by domestically produced substitutes, wherever possible; and state-owned enterprises were used as a base for industrial development.
Trade during the Old Order was characterised by complex and continually changing regulations on exchange rates, import and export duties, import pre-payment schemes, and quantitative restrictions. A large part of imports was dominated by ive Dutch trading companies and, after nationalisation, by state-owned trading houses, which had monopoly rights to import categories of goods that together composed 75% of imports (Pangestu and Boediono 1986). Exports were mainly resource-based: eight commodities accounted for 80%–90% of exports, the two most important being rubber and, increasingly, oil and oil products. The other major export commodities were tobacco, tea, coffee, palm oil, copra, and tin ore.
During the irst three quarters of 1965, Indonesia’s exports declined sharply because of low prices, increasing competition in world commodity markets, and a more discriminatory use of preferential tariffs within competing economic blocs. As the situation worsened, foreign-exchange shortages and other factors reduced industrial production to below 20% of capacity (Arndt 1966).The production of most state-controlled agricultural products, apart from rice, continued to stagnate or decline. This period ended in chaos, marked by corruption, rampant smug-gling, and current account and budgetary deicits, which in turn led to money printing, hyperinlation, and a scarcity of goods.
1966–71: Beginning of the New Order
After the failed communist coup on 30 September 1965 and the transition to the New Order, President Soeharto’s government, which was advised by Western-trained economists, responded to the inherited chaos by substantially liberalising trade and investment policies. Part of a rehabilitation and stabilisation program, these policies aimed to ration scarce foreign exchange more effectively and inlu-ence the level and composition of imports. The recognition that there had been inadequate investment in maintaining and expanding production in the oil indus-try and by agricultural estates led to an open-door policy on foreign investment in 1967.
In mid-1967, new foreign-exchange regulations gave additional incentives to exporters and extra protection to import-competing industries (Arndt 1967). The new regulations were an improvement, even though it took until 1970 for the multiple exchange rate to be abolished. A year later, in 1971, the rupiah was deval-ued by 10%, after the loating of the US dollar (Pangestu 1997).
In 1968, trade taxes were still used mainly as a source of public revenue, account-ing for 38% of government revenues. The production of some manufactured goods
increased, notably in the textile industry; import tariffs were introduced on com-peting goods; and investment inlows started (Pangestu 1996).
In an analysis of Indonesia’s export potential at this time, Thomas and Panglaykim (1966, 89)emphasised the need to diversify and develop exports through ‘an enlightened and vigorous government policy’—that is, because of government dominance in rubber, oil palm, and other agricultural production— as well as through new investment, new farming techniques, and replanting (especially of rubber trees and oil palms). Thomas and Panglaykim also high-lighted the pressing need for improvements in transport and logistics in order to resume trade lows, after the withdrawal of the Dutch interisland shipping company KPM in 1958.
1971–85: IMPORT SUBSTITUTION
In the period after rehabilitation and stabilisation, Indonesia’s economic and political circumstances were changed dramatically by an oil boom that allevi-ated foreign-exchange shortages and increased public revenues (Grenville 1974).1 However, growing anti-foreign sentiment culminated in anti-Japanese riots in Jakarta in 1974, during the visit of Japanese prime minister Kakuei Tanaka, giv-ing rise to restrictions on foreign investment (Arndt 1975). Trade and other poli-cies were introduced to foster import substitution in rice and in manufacturing, beginning with consumer goods and followed by intermediate and capital goods. Rising oil revenues allowed the government to increase its intervention in the economy, and new state-owned enterprises were created in strategic industries such as cement, fertilisers, and aircraft. Oil revenues were channelled through state-owned banks and provided as low-interest credit to priority recipients such as plantations, downstream developers of plywood and similar products, and import-substitution industries. Non-oil export specialisation focused on primary commodities and import-substitution manufacturing, creating a bias against other sectors.
Tariffs and non-tariff barriers (NTBs) were the main instruments used to esca-late protection. High rates of nominal and effective protection were a consequence of local-content requirements, especially in the automotive sector; the prolifera-tion of administrative procedures; the control of entry through investment licens-ing and restrictions on, or the closure of sectors to, private participation, foreign participation, or both; and bans on exports of primary commodities in order to encourage downstream processing.
Although international trade increased signiicantly during this period, non-oil exports had few opportunities to facilitate development (Rice 1983): the protection regime that promoted industrialisation hindered exports. As Warr (1992)noted, Indonesia’s most protected industries continued to be those with the least com-parative advantage. Import substitution and the protection of infant industries fostered neither comparative advantages nor economic eficiency. Consumers paid higher prices for domestically produced products, and producers paid higher than international prices for inputs.
1. The price of oil more than tripled between April 1972 and January 1974.
Trade liberalisation and institutional reform continued. In 1978, several steps were taken to try to offset the declining competitiveness of non-oil tradables com-pared with oil tradables, or Dutch disease, in anticipation of a fall in oil prices. The rupiah was devalued by 50%, tariffs on around 1,000 goods were reduced by 50%, and import taxes were reduced by 50%. There was an emphasis on the need to promote non-oil exports and reduce the export dependence on oil (Dick 1979). Policymakers attempted to offset the bias against exports and counter Dutch disease by introducing an export certiication scheme. This scheme amounted to a subsidy, because the reimbursements of duties paid by exporters on their imported inputs tended to be more than the duties themselves. Some of this sub-sidy helped to start the production and export of textiles and garments.
In 1979, however, oil prices rose rather than fell, halting the push for deregula-tion and liberalisaderegula-tion(Dick 1979). With monetary authorities unable to sterilise oil revenues, the effects of Dutch disease created inlationary pressures and eroded the export price advantage gained by the 1978 devaluation. Since no other meas-ures were taken to ensure the competitiveness of exports (such as reducing high-cost-economy factors), non-oil exports stagnated. Real effective exchange rates came back to 1978 levels after two years, and tariff reductions were also rolled back as exporters failed to lobby for further reforms (Pangestu 1997). Although still high, average nominal and effective rates of protection (weighted by produc-tion) fell to 33% and 56% in 1980, from 70% and 115% in 1975 Import-competing sectors were enjoying weighted average nominal and effective rates of protection of 37% and 60%, compared with 27% and 32% for exported goods (Pangestu and Boediono 1986).
A further reduction of tariffs and import sales taxes was undertaken at the beginning of 1981. The oficial reason given was that Indonesia needed to com-ply with the multilateral General Agreement on Tariffs and Trade (GATT) and its Tokyo Round of negotiations, but it is likely that a critical World Bank (1981) report, which recommended reducing and simplifying the protection system, also had an inluence. When oil prices inally began to fall, in 1981, in the wake of a global recession, the government limited the impact by taking effective macro-economic decisions in the iscal and inancial sectors. These decisions included cutting government expenditure and devaluing the rupiah by 28% in March 1983, introducing reforms to the banking system (Arndt 1983), and reforming taxation (Booth 1984).
These were appropriate responses, but the reforms of this period have often been described as being contrary to conventional wisdom. Structural reforms to remove distortions in the real sector (through changing trade, industrial, and investment policies) are normally undertaken before reforms in the inancial sec-tor, leaving the opening up of the capital account until last. Indonesia’s capital account had been open since the 1970s, and inancial-sector liberalisation pre-ceded real-sector reforms. In fact, owing to the policy of limiting imports to save foreign exchange and protect domestic industries during downturns, trade pol-icy became more protectionist. In addition, vested interests pressed for import substitution, especially for cement, chemicals, fertilisers, and motor-vehicle engines. Since tariffs were already high, the increase in protection during 1982–85 involved a range of quantitative restrictions on imports and the establishment of an ‘approved importer’ system (tata niaga impor).
Log exports were also banned, to encourage domestic processing of raw materials and increase value added, and ostensibly to prevent the over-exploitation of natural resources. The ban was combined with low-cost loans; reg-ulations that linked forest concessions to processing (by Indonesian sawn wood, plywood, and pulpwood mills); and controls over production and prices. The ban on rattan followed the same model. It is unclear, however, whether the bans were effective in increasing value added, creating net jobs and foreign exchange, or reducing resource exploitation, owing to the incentive they provided for ille-gal exports (Resosudarmo and Yusuf 2006). By the end of this period, protection and regulatory controls remained high, economic growth and industrialisation were still driven by government controls and state-owned enterprises, and 80% of Indonesia’s exports and government revenues continued to be derived from oil.
1985–99: DEVALUATION, BOLD DEREGULATION, AND EXPORT DIVERSIFICATION
1985–96: Deregulation and Export Orientation
In 1985, amid a sharp slowdown in economic growth to only 2.5%, and with oil prices expected to decline, a strong push for deregulation and reform emerged. The main aim was to diversify exports and public revenues away from the domi-nance of oil. The export-oriented industrialisation strategy sought to reduce the high costs of doing business, increase access to internationally priced inputs, and remove distortions caused by escalating protection (Dick 1985).
The government introduced several bold measures and reforms as part of this strategy. First, in 1985, it decided to ‘close down’ Indonesian customs, one of the most corrupt institutions at the time, by asking all customs oficials to take a leave of absence. A Swiss surveyor company, Société Générale de Surveillance, was con-tracted to take over customs clearance (Dick 1985). The intention was to reduce the costs of exporting and importing and to prepare Indonesian customs to work more eficiently in the future.
Second, in 1986, Indonesia substantially improved its duty drawback scheme by introducing the 6 May Policy Package (Muir 1986, 22–23). (A year earlier, under US pressure, Indonesia had become a signatory to the GATT Code on Subsidies and Countervailing Duties.) The subsidy component of the export certiication scheme was removed by basing the calculations on an audited input–output basis, and the administration of the scheme was made transparent and became better governed—and included arm’s-length processing—under an in dependent entity. At the same time, many tariffs were reduced and a new, lower ceiling of 40% was put in place, reining the tariff schedule by reducing the number of split lines. In September 1986, the rupiah was devalued by 31% against the US dollar.
Third, during 1986–90, a series of trade-reform packages removed NTBs—in line, this time, with conventional wisdom—and replaced them with more trans-parent, equivalent tariffs (Pangestu 1987). During this period, the proportion of items subject to NTBs fell from 31% to 16% and, in terms of import value, from 43% to 21% (Wymenga 1991). Removing two monopolies on imports of steel and plastic and granting them to associates of President Soeharto, in November 1988, was probably the most signiicant reform. However, import licensing still covered 65% of food crops, mainly rice, and Bulog (the National Logistics Agency) still
played a key role in importing agriculture commodities and managing the rice buffer stock.
Fourth, the announcement in 1986 that there would be three more deregulation packages was a form of pre-signalling that had not happened before. It provided an important indication of the way forward and showed that the government was serious about undertaking reforms.
The results of these reforms were positive: non-oil exports grew by around 30% in 1987–88 (Hill 1987)—albeit from a low base—and by 17% annually during 1989–94.Exporters credited the boost in exports to the devaluation and reforms, especially the eficient and ‘clean’ mechanism of duty reimbursement that ena-bled them to produce with internationally priced inputs. Exports of resource-based manufactured goods (such as furniture, rubber products, and processed wood) and labour-intensive manufactured goods (such as textiles, garments, and footwear) increased rapidly. Garment companies appear to have been the main beneiciaries of the duty drawback scheme. By 1989, of $22 billion of exports, the share of oil had fallen to 38%, compared with 65% in 1981.
During this period, Indonesia’s internationalisation came of age and affected domestic policies and reforms. Besides the bold deregulations undertaken during 1985–88, Indonesia’s increased conidence about opening up was evident when, in early 1992, it inally supported the creation of the ASEAN Free Trade Area (AFTA), agreeing to reduce tariffs on intra-ASEAN trade to zero by 2005 (Tomich 1992).This was shortly followed by two even more important reforms.
First was the decision to allow 100% foreign ownership of export-oriented com-panies. Indonesia’s hosting of the APEC Economic Leaders’ Meeting in 1994 would produce the now famous Bogor goals, which sought to achieve regional free trade and investment by 2010 for industrialised countries and by 2020 for developing countries. Indonesia’s unilateral reforms were attributed to Soeharto’s economic technocrats, who ensured that Indonesia’s reforms were in line with APEC prin-ciples. Around this time, Soeharto issued an important statement, arguing that, whether Indonesia liked it or not, and whether it was ready or not, it had to face globalisation (Soesastro 2004, 5–6).
Second was Indonesia’s introduction, in 1995, of a comprehensive tariff-reduction program in order to meet its obligations to the newly created WTO (and to AFTA by 2005). The government reduced the tariff bracket from 0%–40% in 1995 to 0%–10% by 2003, and removed local-content requirements for automotive, elec-tronic, and dairy products. It also enacted a number of laws related to trade rem-edies (anti-dumping and safeguards), customs, and intellectual property rights.
Indonesia’s exports would continue to grow until the 1997–98 Asian inancial crisis, but in 1993 they came under competitive pressure when minimum-wage increases exceeded productivity growth and inlation. The ‘managed’ deprecia-tion of the Indonesian rupiah by 5% per year during 1986–97 helped to offset the wage increases.
Despite the internationalisation of Indonesia’s economy and the reforms under-taken since the mid-1980s, cronyism favouring those close to the centre of power, including Soeharto’s children, increased. Policy interventions created import monopolies, forestry concessions, privatised toll roads, and private TV stations. One of the most blatant examples was the national-car policy introduced in 1996: under this policy, a joint venture between one of Soeharto’s sons and Korea’s
Kia Motors was given the privilege of importing fully built cars into Indonesia duty free, before the WTO halted it. This case ironically provides a lesson on how international commitments in the end disciplined such blatant policies and gave Indonesia its irst experience in dealing with the WTO. After consultations failed in May 1997, Japan, the European Union, and the United States requested a panel be created to arbitrate the dispute, and the case was one of the irst to test the WTO dispute-settlement process. Indonesia ultimately lost the case because it had violated the most sacred principle of GATT 1994—Article I:1 on most-favoured-nation treatment.
1997–99: The Asian Financial Crisis and the IMF Program
The 1997–98 Asian inancial crisis, which started in Thailand in July 1997, quickly spread to several other Asian economies. Amid pronouncements of Indonesia’s fundamentals being sound, the government introduced a deregulation package in September 1997, but a month later it resorted to an IMF loan program to shore up business conidence. The ensuing structural reforms to trade and investment focused on reducing tariffs and including industries that had been excluded from trade reforms, such as chemicals, steel, and ishery products. All NTBs were removed, except those based on accepted health, safety, environmental, and secu-rity grounds. These included all the controversial import monopolies aside from rice, sugar, and cloves. The reforms also lifted export bans and reduced export taxes for three years, and opened up the retail sector, among others, to foreign investment (Feridhanusetyawan and Pangestu 2003).
Despite this comprehensive package, the closure of 16 banks at the end of 1997, combined with clear signals that the government was reluctant to implement the reforms, exposed Indonesia’s vulnerabilities and led to a crisis of conidence, which in turn led to a sharp increase in capital outlows in late 1997 and into 1998. The rupiah was loated in August 1997 and depreciated from Rp 2,500 to Rp 17,000 against the US dollar by January 1998 (Soesastro and Basri 1998). It eventually settled at around Rp 12,000 per dollar, boosting commodity exports as non-oil exports continued to grow. Exports of agricultural products increased by 29% in dollar value and 98% in volume, while manufactured products increased by 8% and 68%, respectively, so overall exports still grew during 1997–98 (Evans 1998, 32).
The severity of the economic crisis led, however, to a 13% contraction in GDP, an inlation rate of 58%, a 244% drop in the exchange rate, and the collapse of the banking sector and many afiliated companies in 1998. By 1999, owing to inlation in food prices and disruption in distribution, around 13 million people had fallen into poverty because of the crisis; the poverty rate increased to 23.4%, up from 17.3% in 1996 (Suryahadi, Hadiwijaya, and Sumarto 2012). All of this happened in uncertain political circumstances and amid deteriorating domestic security.
Severe problems experienced by the corporate and banking sectors hindered trade, as it was dificult for Indonesian businesses to inance imports or obtain pre-inancing for their exports (Pangestu and Habir 2002).Most surviving com-mercial banks lost their networks of international correspondents or held oper-ating licences that did not cover foreign-exchange transactions (Magiera 2003). With the restructuring that took place in the banking sector and among private companies, many foreign banks cut their country exposure to Indonesian banks
or lowered the creditworthiness of trade-related transactions with Indonesian businesses.2
1999–2004: RECOVERY AND SOUL-SEARCHING
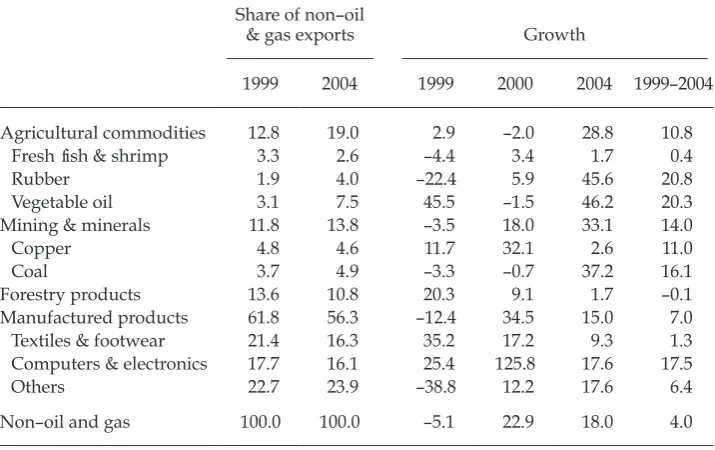
The massive currency depreciation and the IMF program’s trade reforms did boost exports, but the currencies of other Asian countries also depreciated and therefore these countries’ exports competed against Indonesia’s (Thee 2002). Although the exports of some products increased, total non–oil and gas exports contracted by 5.1% in 1999 (table 1). Non–oil and gas exports increased in subse-quent years, initially because of price competitiveness due to the weak rupiah, but also because demand, especially for palm oil and mining products, started to rise. The weak exchange rate attracted foreign buyers, who inanced raw and interme-diate inputs and engaged in original-equipment-manufacturer transactions with Indonesian suppliers of textiles, garments, and furniture. Foreign buyers also pur-chased raw materials directly, including coal and palm oil, and paid for them after the materials arrived or had been shipped.
Table 1 shows that Indonesia was beginning to experience competitiveness problems by 2004, particularly in its labour-intensive sectors (World Bank 2012). Between 1999 and 2004, the share of textiles and footwear in non–oil and gas exports dropped from 21% to 16% and grew by only 1.3%, on average, largely
2. For instance, many offshore corresponding banks declined letters of credit issued by Indonesian banks.
TABLE 1 Share and Growth of Non–Oil and Gas Exports, 1999–2004 (%)
Share of non–oil
& gas exports Growth
1999 2004 1999 2000 2004 1999–2004
Agricultural commodities 12.8 19.0 2.9 –2.0 28.8 10.8
Fresh ish & shrimp 3.3 2.6 –4.4 3.4 1.7 0.4
Rubber 1.9 4.0 –22.4 5.9 45.6 20.8
Vegetable oil 3.1 7.5 45.5 –1.5 46.2 20.3
Mining & minerals 11.8 13.8 –3.5 18.0 33.1 14.0
Copper 4.8 4.6 11.7 32.1 2.6 11.0
Coal 3.7 4.9 –3.3 –0.7 37.2 16.1
Forestry products 13.6 10.8 20.3 9.1 1.7 –0.1
Manufactured products 61.8 56.3 –12.4 34.5 15.0 7.0
Textiles & footwear 21.4 16.3 35.2 17.2 9.3 1.3
Computers & electronics 17.7 16.1 25.4 125.8 17.6 17.5
Others 22.7 23.9 –38.8 12.2 17.6 6.4
Non–oil and gas 100.0 100.0 –5.1 22.9 18.0 4.0
Source: Authors’ calculations based on data from Badan Pusat Statistik (BPS).
because of a decline in investment, an appreciation of the nominal exchange rate, and other factors that eroded the cost competitiveness of Indonesia’s manufactur-ing exports.
Net foreign direct investment was negative between 1999 and 2003, with outlows of 2.8% and 1.9% of GDP in 1999 and 2000 (Basri and Soesastro 2005). Despite the relatively open foreign-investment policy, investment did not pick up, owing in part to uncertainty about political reforms and domestic security. There were also concerns about the country’s irst democratically elected government, which lacked managerial proiciency and seemed unable to deliver on its prom-ises (Boediono 2005).
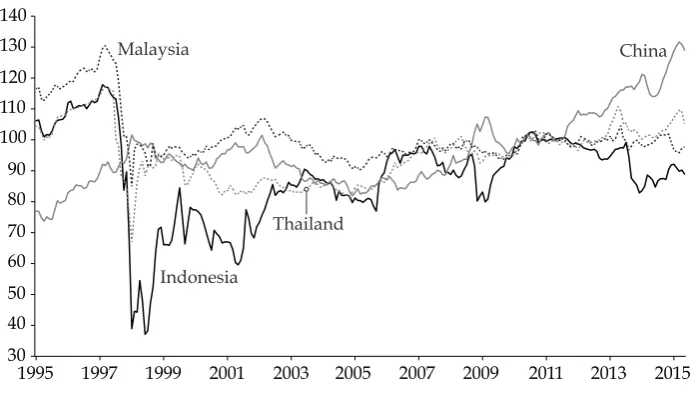
Indonesia’s nominal and real exchange rates depreciated dramatically during the crisis and remained weak until 2001. Inlation was also high, at double-digit levels, owing to the impact of rupiah depreciation on the prices of imported goods, as well as to price increases in fuel and electricity as subsidies were reduced. Starting in 2001, on the back of improving economic growth and increasing export revenues, the exchange rate began to strengthen in both nominal and real terms (igure 4). By 2003, Indonesia’s real exchange rate was catching up with those of its major competitors in Asia, such as China and Thailand.
Aside from the appreciation of the real exchange rate, other factors began to affect the competitiveness of Indonesia’s manufacturing exports. During 1995–2005, as the WTO phased out quotas that had been part of its Multiibre Arrangement for textiles and clothing (James, Ray, and Minor 2003), competition increased in the European and US markets from lower-cost producers such as Bangladesh and Vietnam.3 The greatest competition, however, came from China;
3. Formerly, a quota system was used to govern the international trade of textiles and
cloth-ing. The WTO’s 1995 Agreement on Textiles and Clothing, which was determined during
FIGURE 4 Real Effective Exchange Rates, Indonesia and
Selected Asian Countries, 1995–2015 (2010 = 100)
1995 1997 1999 2001 2003 2005 2007 2009 2011 2013 2015
30 40 50 60 70 80 90 100 110 120 130 140
Indonesia
China Malaysia
Thailand
Source: Data from the Bank for International Settlements, via the CEIC Global Database.
its accession to the WTO in 2001 allowed it to take advantage of the phasing out of these quotas.
Indonesia’s competitiveness in manufacturing also suffered from rising labour costs, which were due to new-found militancy among labour unions and rigid new labour legislation. In 2000 and 2001, minimum wages in Jakarta increased by 49% and 39%—higher than the growth of labour productivity. Meanwhile, populist labour legislation in 2001 increased the costs of hiring and replacing employees and led to much collective bargaining in the streets (as opposed to at the negotiating table). Local regulations proliferated after Indonesia’s decentrali-sation; as local governments sought to raise revenue, businesses had to comply with more local taxes and administrative procedures.
On the positive side, tariff reductions between 1990 and 2001 reduced the cost of inputs and increased productivity (Amiti and Konings 2007). Indonesia also actively participated in ASEAN and, in 2003, while chair, endorsed the establish-ment of the ASEAN Economic Community by 2015. In 2001, Indonesia and ASEAN responded positively to China’s proposal for a free-trade area. Negotiations began in 2002 and were completed in mid-2004.
Updating earlier calculations, Marks and Rahardja (2012) found that the sharp decline in the effective rate of protection across sectors was consistent with uni-lateral reforms, schedules for tariff reductions in regional trade agreements, and subsidy reductions. Tariffs for industries that were highly protected or subsidised in the 1990s, such as machinery and transport equipment, had been reduced and state support for projects such as the national car had been removed. By 2008, Indonesia had low tariff barriers to trade, but these low tariffs were offset by a proliferation of NTBs, such as those for beef, sugar, rice, and steel.
Despite reforms, the government seemed hesitant to commit to deeper struc-tural reforms during 1999–2004. Grossman and Helpman (1994) suggested that an equilibrium between openness and protection had to be struck in the political economy sense. In other words, achieving political reform as well as freedom, democracy, and increased political participation in Indonesia involved balancing the interests of government, individual politicians, and the private sector. Around this time, the government revived the role of Bulog by restoring its function as the importer of rice, as well as a buyer of sugar and cattle. The government, through the Ministry of Industry and Trade, also reintroduced the requirement that sugar, steel, and textiles could be imported only by certain licensed importers. It reintro-duced export bans on logs in 2001 and on rattan in 2004.
As would be expected, disagreements over the role of trade policy are more nuanced in democratic Indonesia, which has an open and inclusive political pro-cess for shaping government policies. The central government has less control over policy implementation than it did during the Soeharto era, as decentralisa-tion has given local governments the upper hand in budgeting and policy-making at the local level. Under Soeharto, particularly during the period of what Soesastro (1989, 866–67) called ‘low politics’, economic policy-making was relatively easy: technocrats were in control and focused on convincing the president to undertake reforms and act on policy. In the democratic era, the absence of institutions with
the Uruguay Round of negotiations, had the objective of gradually reintegrating trade in textiles and clothing into a new world trading system that prohibited quotas.
strong analytical capacity has weakened the position of proponents of an open trade and policy regime (Aswicahyono, Bird, and Hill 2009). Furthermore, in the aftermath of the Asian inancial crisis, resentment arose about foreign involve-ment in the Indonesian economy. This resentinvolve-ment was mostly about the perceived causes of the crisis or about the restrictions that the IMF placed on Indonesia. Against this background, protectionist policies became easy and popular instru-ments to deploy in order to shield Indonesian businesses from international competition.
Global commodity prices started to increase in 2003, partly as a result of increased demand from China. High international commodity prices marked a shift in the structural balance of production in Indonesia, where manufacturing was no longer considered as attractive for businesses as the commodity-based and non-tradable sectors. This marked the beginning of a second period of Dutch disease.
2004–15: MORE REFORM, MORE DUTCH DISEASE, AND THE GLOBAL FINANCIAL CRISIS
The Ministry of Trade; Reforms and Institutional Strengthening
In October 2004, in the country’s irst direct elections, Susilo Bambang Yudhoyono was elected president. By 2003, or ive years after the Asian inancial crisis, Indonesia had regained its macroeconomic stability and the functioning of its inancial sector had started to improve. The new government therefore focused on implementing structural reforms in order to regain conidence, attract invest-ment, and rebuild the real sector.
In 2004, the Ministry of Trade was again separated from the Ministry of Industry and Trade. It was tasked with increasing investment and creating a conducive investment climate, increasing export growth, and improving the eficiency and effectiveness of domestic distribution. In recognition of the link between trade and investment, investment policy and the Investment Coordinating Board came under the coordination of the Ministry of Trade. One of the outcomes was the pas-sage of Law 25/2007 on Investment.4
By 2003, most-favoured-nation tariffs were already low. The government sought to strengthen decision-making on tariffs and export duties by ensuring that its Tariff Team, which was chaired by the Ministry of Finance and co-chaired by the Ministry of Trade, operated on the principles of sound policy analysis, effective coordination, and reasoned decision-making. In a regional perspective, by January 2010 Indonesia found itself a signatory to several ASEAN Plus One FTAs, with six key trading partners: Australia, New Zealand, China, India, Japan, and Korea.
Apart from introducing cross-border measures and taking part in trade negotiations, Indonesia undertook a number of other important reforms and institution-building activities. Important domestically was stabilising prices and
4. The new investment law combined Law 6/1968 on Domestic Investment and Law
1/1967 on Foreign Investment. It included principles of transparency and national treat-ment, a negative-list approach, and protection against nationalisation, as well as provisions
for dispute settlement. The criteria for the negative list would soon become clear, although
implementation proved complicated.
institutionalising databases for decisions on the import of basic foods. Lessons were learned from spikes in domestic prices, such as the increase in rice prices in 2006 (McCulloch and Timmer 2008) and the sharp rise in food prices in 2008 prior to the global inancial crisis.
The government also committed to improving investment and exports by revitalising the National Team for the Enhancement of Exports and Investment (Timnas PEPI) in 2006, which was led directly by the president and chaired by the coordinating minister of economic affairs. However, Timnas PEPI could not work optimally as a platform for coordinating investment and export policies, because support in the form of a full-time secretariat of professionals did not materialise. Nevertheless, during 2008–11, Timnas PEPI contributed to legislation and regula-tions, monitored implementation, and dealt with ad-hoc problem-solving related to investment and trade. On top of introducing unilateral reforms, the govern-ment responded to its ASEAN commitgovern-ment by simplifying border-clearance pro-cedures through initiatives such as the Indonesia National Single Window and INATRADE (an electronic system of export and import licensing).
Resource-Based Export Boom and Competitiveness
Indonesia’s exports almost tripled during 2004–11, from $71 billion to $201 bil-lion, with an average growth rate of 16% per year. Much of this growth rode on commodity prices and on high levels of demand for raw materials in China and, to a lesser extent, India. Indonesia’s exports of palm oil and coal increased dra-matically in this period. In the wake of the 2008 global inancial crisis, however, and owing partly to slowing growth in China since 2007, export revenues con-tracted by an annual average of 5.8% in 2013 and 2014, falling to $180 billion. Total exports fell from $203 billion to $176 billion during 2011–14, with an average contraction rate of 4.4%. In 2012, Indonesia trade balance went into deicit for the irst time in 50 years.
The recent export boom is reminiscent of past commodity booms in rich Indonesia. Despite some success in diversifying exports, Indonesia’s resource-based exports continue to dominate. Resource-intensive industries, such as oil and gas, mining, agriculture, and forestry, accounted for 96% of total exports in 1980, 62% in 1990, and 41% in 2000. The share of exports of mining products in total exports would soon increase sharply, however, from 5% in 2000 to 18% in 2013. The share of other resource-intensive goods, particularly palm oil, also increased signiicantly, so that by 2013 around 60% of Indonesia’s exports were resource-based. The share of exports of manufactured goods in total exports decreased from 59% in 2000 to 41% in 2013.5 Furthermore, manufactured exports did not diversify much, and continued to be dominated in the 1990s by unskilled-labour-intensive goods such as textiles, clothing, and footwear, with moderate increases in the 2000s in semi-skilled-labour-intensive goods such as electronics and trans-port parts and components.
5. According to the modiied Harvard Institute for International Development method (re
-ined by the World Bank ofice in Jakarta on the basis of data for Indonesia), manufactured goods contributed 49% to total goods exports in 2000 and 34% in 2010 (Ing, Fukunaga, and
Isono 2014).
By 2013, nine out of ten of Indonesia’s main export commodities were resource-intensive: coal, natural gas, vegetable oils, petroleum, rubber, paper, copper, residual petroleum, and nickel. Footwear was the exception, while textiles ranked eleventh. These ten main commodities contributed more than 50% of the value of total exports. This was reminiscent of the early 1960s—when eight out of ten of Indonesia’s main export commodities were resource-intensive (Thomas and Panglaykim 1966)—despite the government-stated strategy since then of diver-sifying exports.
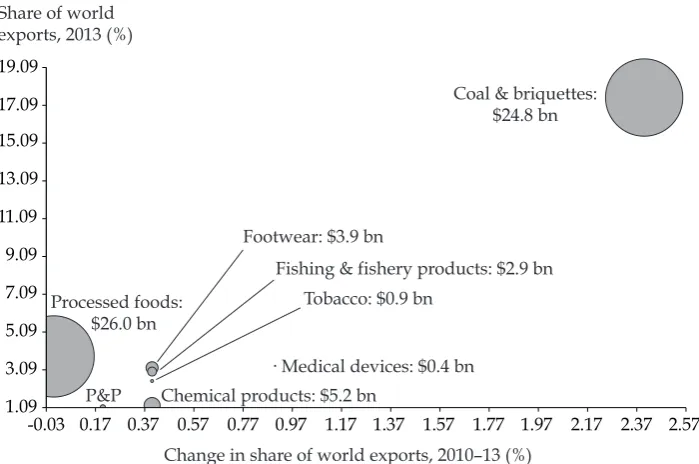
On the basis of Indonesia’s export portfolio by cluster, the country’s exports in the irst quadrant— the boundaries of which are deined using Porter’s (2003) methodology—show positive shares and positive changes during 2010–13 (ig-ure 5). Most of these exports are resource-intensive (coal and tobacco), while the manufactured goods are resource-intensive (ish and ishery products and pub-lishing and printing products), capital-intensive (medical devices and chemical products), or unskilled-labour-intensive (footwear and processed food).
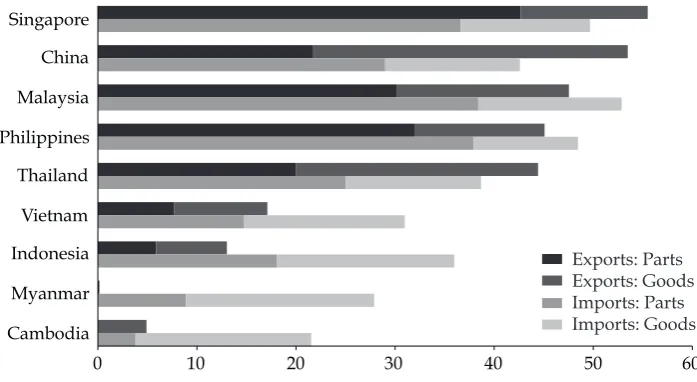
The share of machinery goods and parts in exports is a widely used measure of the degree of participation in international production networks. In Indonesia, in 2010, this share remained low, at 13% of total exports (igure 6), and lagged behind those of the Philippines, Singapore, China, Malaysia, the Philippines, Thailand, and Vietnam. Nevertheless, Indonesia had come through the 2008
FIGURE 5 Indonesia’s Export Portfolio, by Cluster, 2010–13 (irst quadrant)
1.09 3.09 5.09 7.09 9.09 11.09 13.09 15.09 17.09 19.09
-0.03 0.17 0.37 0.57 0.77 0.97 1.17 1.37 1.57 1.77 1.97 2.17 2.37 2.57 Coal & briquettes:
$24.8 bn
Medical devices: $0.4 bn Processed foods:
$26.0 bn
P&P Chemical products: $5.2 bn Footwear: $3.9 bn
Fishing & fishery products: $2.9 bn Tobacco: $0.9 bn
Change in share of world exports, 2010–13 (%) Share of world
exports, 2013 (%)
Sources: Authors’ calculations using Harmonization System codes for 2007. The boundaries of the irst
quadrant are deined using Porter’s (2003) methodology. Data for services are from the United Nations Conference on Trade and Development. Data for goods are from the World Bank’s World Integrated
Trade Solution.
Note: P&P = Publishing and printing products: $1.7 bn.
global inancial crisis relatively unscathed, with annual GDP growth averag-ing 5.9% between 2008 and 2014, compared with average world growth of just 1.8% (World Bank 2015). This was thanks to iscal stimulus, export growth until 2012 due to demand for commodities in China and other emerging markets, and robust growth in domestic demand. However, the competitiveness of non-commodity-based exports continued to decline, partly because of the effects of Dutch disease and partly because of a range of problems in Indonesia’s business environment, such as physical and soft infrastructure bottlenecks, ineficient logistics, tax administration and legal uncertainties for large and medium irms, and dificulty of access to inance for small and micro enterprises (Ing and Varela 2012).
During the last few years, there appears to have been a growing ambivalence about the direction of Indonesia’s trade policy. This ambivalence has had tangi-ble effects; for instance, exports have been reduced by government decisions to reintroduce the ban on rattan exports, reinstate import controls on agricultural products (later removed in 2013 because they caused price spikes), and imple-ment a ban on raw-mineral exports in 2014 under Law 4/2009 on Mineral and Coal Mining.Also in 2014, an election year, the outgoing Yudhoyono govern-ment showed again that legislation in Indonesia needed to balance protection, nationalist sentiments, and openness. Law 7/2014 on Trade, for instance, gives the Ministry of Trade more control, strengthens previous government import and export regulations on quotas and bans, allows the temporary changing of tar-iffs to improve national competitiveness, and stipulates that trade negotiations must be approved by parliament. The government also attempted to reintroduce local-content requirements. Of course, it is too early to speculate on how many of these policies will be implemented, especially given the boundaries already set by Indonesia’s international commitments.
FIGURE 6 Share of Machinery Goods and Parts in Total Exports and Imports, 2010 (%)
Cambodia Myanmar Indonesia Vietnam Thailand Philippines Malaysia China Singapore
0 10 20 30 40 50 60
Exports: Parts Exports: Goods Imports: Parts Imports: Goods
Sources: Authors’ calculations based on UN Comtrade data, using machinery and its parts and compo
-nents as deined by Ando and Kimura (2013).
Indonesia’s Stance in Regional Agreements
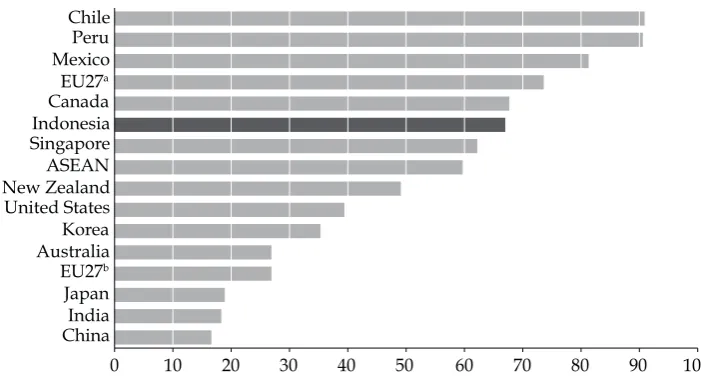
As mentioned above, Indonesia adopted a multitrack trade strategy in 2004. The cornerstone has been the country’s regional agreements, with ASEAN at the cen-tre. Indonesia’s trade with its FTA partners composes 67% of its total trade, slightly higher than the ASEAN average (igure 7). By September 2014, Indonesia had six regional FTAs and one bilateral FTA in effect: the ASEAN Free Trade Area, which will become part of the more comprehensive ASEAN Economic Community in 2015; the ASEAN–Australia and New Zealand Free Trade Agreement; the ASEAN–China Free Trade Agreement; the ASEAN–India Free Trade Agreement, the ASEAN–Japan Comprehensive Economic Partnership; the ASEAN–Korea Free Trade Agreement; and the bilateral Indonesia–Japan Economic Partnership Agreement.6
As part of a process to consolidate the existing ASEAN Plus One FTAs, in November 2011 ASEAN’s ten members and its six FTA partners agreed to form the East Asia Regional Comprehensive Economic Partnership. This partnership was designed around the open-regionalism principle of ratcheting up to best practices; its bottom-up approach will aim for comprehensive coverage but will
6. After the signing of the FTA between Pakistan and Malaysia (amounting to a 16% dif
-ference in the import duties on Malaysian and Indonesian exports to Pakistan), many Indonesian palm-oil exporters were competed out of the Pakistani market. Pressure from
these exporters led Indonesia to negotiate a partial FTA, a preferential trade agreement,
with Pakistan. This agreement focused on a number of exports, such as palm oil from Indonesia and kino oranges from Pakistan (to offset Indonesia’s competitive disadvantage
in mandarin oranges from China under the ASEAN–China Free Trade Agreement). FIGURE 7 Trade with FTA Partners as a Share of Total Trade, 2012 (%)
China India Japan EU27b Australia Korea United States New Zealand ASEAN Singapore Indonesia Canada EU27a Mexico Peru Chile
0 10 20 30 40 50 60 70 80 90 100
Sources: Data from the Asian Regional Integration Centre and the Asian Development Bank. Note: Based on trade data from 2011. EU27 = the 27 countries of the European Union as of 2012.
a Includes intra-EU trade.
b Excludes intra-EU trade.
start with goods and then move on to services and investment. Other important principles are ASEAN-X, which allows those not ready to join at this stage to join at a later stage, and an open accession clause to allow for new members.
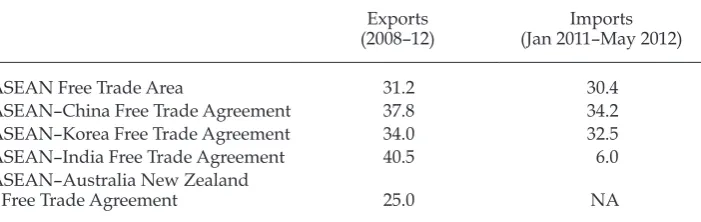
Has regional integration beneited Indonesia? An economy with a relatively small share of trade relative to GDP, such as Indonesia, may enjoy only a small gain from FTAs (Feridhanusetyawan and Pangestu 2003, 72).7 The usage rate of FTAs in Indonesia is still relatively low (table 2), ranging from 25% to 41% for exports and from 6% to 34% for imports. In a survey-based analysis of the use of FTAs in ASEAN countries, Ing, Fukunaga, and Isono (2014) found that this rate has much to do with the margin of preferences—or the difference between prefer-ential tariff rates and most-favoured-nation tariff rates—which was only 3.5% in 2010.In 2013, the ad valorem equivalent of the cost of complying with the rules of origin was 3.0%, or 2.1% if trade weighted (Cadot and Ing 2014). Ing, Fukunaga, and Isono also found that 60% of the irms they surveyed across ASEAN claimed that there was little information available on FTAs.
Despite the new legislation and the low uptake of FTAs, Indonesia’s commit-ment to these agreecommit-ments at least offers hope of driving domestic reforms and multilateralising regional commitments.
CONCLUSION
Indonesia’s trade policy has undergone many transformations over the last 50 years, but there have been recurring themes: the protection of domestic markets and industries; the development of domestic and strategic industries, including local content; a constant control over strategic resources; the downstream pro-cessing of resources; the creation and maintenance of self-suficiency in various sectors; a preference for domestic ownership over foreign ownership; and the
7. The impacts of the AFTA on the trade of ASEAN countries also show this tendency
(Okabe and Urata 2014).
TABLE 2 Utilisation Rate of Free-Trade Agreements (average %)
Exports (2008–12)
Imports
(Jan 2011–May 2012)
ASEAN Free Trade Area 31.2 30.4
ASEAN–China Free Trade Agreement 37.8 34.2
ASEAN–Korea Free Trade Agreement 34.0 32.5
ASEAN–India Free Trade Agreement 40.5 6.0
ASEAN–Australia New Zealand
Free Trade Agreement 25.0 NA
Source: Based on data from the Ministry of Trade (2014).
Note: NA = not available. The utilisation rate is deined here as the percentage of the value of exports or imports that use a preferential tariff rate relative to the total value of exports or imports. See
Hamanaka’s (2013) paper for a detailed discussion on the use of FTAs.
diversiication of exports away from commodities. What differs are the instru-ments used and the beneiciaries of their use. Policy outcomes have also been inluenced by external economic developments such as oil and commodity booms and global economic cycles, as well as by international cooperation, negotiations, and commitments. Indonesia’s economic policy, and subsequently its trade pol-icy, appears to have been inluenced by an aphorism often termed Sadli’s Law: ‘Bad times may produce good economic policies, and good times frequently the reverse’ (Hill and Thee 2008).
Episodes of trade reform in the 1980s and early 1990s pointed to the inluential role of technocrats in implementing trade and other reforms in response to eco-nomic downturns. By and large, the net result was a diversiication of exports and a structural transformation that ushered Indonesia into a golden era of high eco-nomic growth. When the Asian inancial crisis struck in 1997, it highlighted the vulnerabilities caused by poor governance and a lack of institutions, and revealed the excesses involved in protecting certain activities that were linked to vested interests. During the crisis, the technocrats managed the risk of policy reversals by convincing the top political command to use multilateral and regional economic integration initiatives to lock in reforms.
What of the future of trade policy? Today, Indonesia is a different country. The economy has recovered from the deep inancial and political crises of 1997–98 and is now the third largest in East Asia after China and Japan. The political transition to democracy has increased Indonesia’s conidence as a sovereign nation, and it now has the capacity to determine the course of its own development. The suc-cessful democratic presidential and local elections in 2014 also increased public awareness about how the political process can instigate popular changes.
However, the fundamental issue of competitiveness has yet to be addressed, and thus the identiication of new sources of competitiveness and export growth has not been coupled with supporting policies. There is also the irony that as the Indonesian economy grows and becomes more integrated into the world econ-omy, and as trade increasingly takes place across global value chains and with embedded services in goods, trade policy in recent years is becoming more politi-cal and is often used as an instrument for populist policies. Despite the commod-ity boom having ended and Indonesia facing trade deicits, the responses to date have been ambivalent and often inward-looking.
The world is also a different place. Indonesia needs to see trade from the point of view of the new paradigm, where production is based on production networks and global value chains. There is a need to have competitive inputs, whether goods or services and whether procured domestically or internationally; many countries would then be engaged directly and indirectly in producing inal goods. The recent process of globalisation can be seen as the ‘second unbundling’ of the inal-goods process (Baldwin 2014).
To beneit as much as possible from being part of these networks and value chains, Indonesia needs to continue integrating with the world economy and cre-ate an environment more conducive to the smooth low of goods, services, and people.8 The focus should shift from protecting or favouring sectors to improving
8. See Cadot, Munadi, and Ing’s (2015) paper for a detailed analysis of non-tariff measures
in ASEAN countries.
access to inputs and materials, and to developing policies that promote human-capital development, research and development, innovation, and all things that increase productivity.
The reality is that policy-making is becoming more complex, and pretending that trade policy can be implemented in isolation from politics will make tech-nocrats even less relevant. There is a need to increase reform advocacy, educate the public on the beneits of speciic trade policies, and support evidence-based policy-making. Indonesia should also remain engaged with the region, because peer pressure for reform is likely to come from East Asia in response to changes in China’s economy.
REFERENCES
Amiti, Mary, and Jozef Konings. 2007. ‘Trade Liberalization, Intermediate Inputs, and Pro
-ductivity: Evidence from Indonesia’. American Economic Review 97 (5): 1611–38.
Ando, Mitsuyo, and Fukunari Kimura. 2013. ‘Production Linkage of Asia and Europe via Central and Eastern Europe’. Journal of Economic Integration 28 (2): 204–40.
Arndt, H. W. 1966. ‘Survey of Recent Developments’. Bulletin of Indonesian Economic Studies 2 (5): 1–20.
———. 1967. ‘Survey of Recent Developments’. Bulletin of Indonesian Economic Studies 3
(8): 1–34.
———. 1975. ‘Survey of Recent Developments’. Bulletin of Indonesian Economic Studies 11
(2): 1–29.
———. 1983. ‘Survey of Recent Developments’. Bulletin of Indonesian Economic Studies 19
(2): 1–26.
Aswicahyono, Haryo, Kelly Bird, and Hal Hill. 2009. ‘Making Economic Policy in Weak, Democratic, Post-crisis States: An Indonesian Case Study’. World Development 37 (2): 354–70.
Baldwin, Richard. 2014. ‘Trade and Industrialization after Globalization’s Second Un bundling: How Building and Joining a Supply Chain Are Different and Why It Mat
-ters’. In Globalization in an Age of Crisis: Multilateral Economic Cooperation in the Twenty-First Century, edited by Robert C. Feenstra and Alan M. Taylor, 165–212. Chicago: University of Chicago Press.
Basri, M. Chatib, and Hadi Soesastro. 2005. ‘The Political Economy of Trade Policy in Indo
-nesia’. CSIS Economics Working Paper WPE 092, Centre for Strategic and International Studies, Jakarta.
Boediono. 2005. ‘Managing the Indonesian Economy: Some Lessons from the Past’. Bulletin of Indonesian Economic Studies 41 (3): 309–24.
Booth, Anne. 1984. ‘Survey of Recent Developments’. Bulletin of Indonesian Economic Studies 20 (3): 1–35.
Cadot, Olivier, and Lili Yan Ing. 2014. ‘How Restrictive Are ASEAN’s RoO?’. ERIA Discus
-sion Paper 2014-18, Economic Research Institute for ASEAN and East Asia, Jakarta. Cadot, Olivier, Ernawati Munadi, and Lili Yan Ing. 2015. ‘Streamlining Non-tariff Measures
in ASEAN: The Way Forward’. Asian Economic Papers 14 (1): 35–70.
Dick, Howard. 1979. ‘Survey of Recent Developments’. Bulletin of Indonesian Economic Stud-ies 15 (1): 1–44.
———. 1985. ‘Survey of Recent Developments’. Bulletin of Indonesian Economic Studies 21
(3): 1–29.
Evans, Kevin. 1998. ‘Survey of Recent Developments’. Bulletin of Indonesian Economic Stud-ies 34 (3): 5–36.
Feridhanusetyawan, Tubagus, and Mari Pangestu. 2003. ‘Indonesian Trade Liberalisation: Estimating the Gains’. Bulletin of Indonesian Economic Studies 39 (1): 51–74.
Grenville, Stephen. 1974. ‘Survey of Recent Developments’. Bulletin of Indonesian Economic Studies 10 (1): 1–32.
Grossman, Gene M., and Elhanan Helpman. 1994. ‘Protection for Sale’. American Economic Review 84 (4): 833–50.
Hamanaka, Shintaro. 2013. ‘On the Use of FTAs: A Review of Research Methodologies’. ADB Working Paper on Regional Economic Integration 113, Asian Development Bank, Manila.
Hill, Hal. 1987. ‘Survey of Recent Developments’. Bulletin of Indonesian Economic Studies 23 (3): 1–33.
Hill, Hal, and Thee Kian Wie. 2008. ‘Moh. Sadli (1922–2008): Economist, Minister and Pub
-lic Intellectual’. Bulletin of Indonesian Economic Studies 44 (1): 151–56.
Ing, Lili Yan, Yoshifumi Fukunaga, and Ikumo Isono. 2014. The Use of FTAs in ASEAN.
ASEAN Business Advisory Council Report to ASEAN Leaders. Jakarta: ASEAN Busi -ness Advisory Council.
Ing, Lili Yan, and Gonzalo Varela. 2012. ‘Constraints on Productivity and Investment in
Indonesia’s Manufacturing Sector: Survey-Based Analysis of Business Constraints’. Policy Note 4, World Bank, Jakarta.
James, William E., David J. Ray, and Peter J. Minor. 2003. ‘Indonesia’s Textiles and Apparel: The Challenges Ahead’. Bulletin of Indonesian Economic Studies 39 (1): 93–103.
Magiera, Stephen L., ed. 2003. Readings in Indonesian Trade Policy (1991–2002). Jakarta. Marks, Stephen V., and Sjamsu Rahardja. 2012. ‘Effective Rates of Protection Revisited for
Indonesia’. Bulletin of Indonesian Economic Studies 48 (1): 57–84.
McCulloch, Neil, and C. Peter Timmer. 2008. ‘Rice Policy in Indonesia: A Special Issue’.
Bulletin of Indonesian Economic Studies 44 (1): 57–84.
Ministry of Trade. 2014. ‘Data on Exports and Imports of Indonesia and Its FTA Trading Partners’. Unpublished report, Research Division, Directorate of Foreign Trade Affairs, Ministry of Trade of the Republic of Indonesia.
Muir, Ross. 1986. ‘Survey of Recent Developments’. Bulletin of Indonesian Economic Studies 22 (2): 1–27.
Okabe, Misa, and Shujiro Urata. 2014. ‘The Impact of AFTA on Intra-AFTA Trade’. Journal of Asian Economics 35: 12–31.
Pangestu, Mari. 1987. ‘Survey of Recent Developments’. Bulletin of Indonesian Economic Studies 23 (1): 1–39.
———. 1996. Economic Reform, Deregulation and Privatization: The Indonesian Experience.
Jakarta: Centre for Strategic and International Studies.
———. 1997. ‘Trade Reform Deregulation and Competition Policy Reform: An Indonesian
Perspective’. In Sustaining Economic Growth in Indonesia: A Framework for the Twenty-First Century. Conference proceedings. Jakarta: Centre for Strategic and International Studies.
Pangestu, Mari, and Boediono. 1986. ‘Indonesia: The Structure and Causes of Manufactur
-ing Sector Protection’. In The Political Economy of Manufacturing Protection: Experiences of ASEAN and Australia, edited by Christopher Findlay and Ross Garnaut, 1–47. Sydney: Allen and Unwin.
Pangestu, Mari, and Manggi Habir. 2002. ‘The Boom, Bust, and Restructuring of Indone
-sian Banks’. IMF Working Paper 02/66, International Monetary Fund, Washington, DC. Porter, Michael E. 2003. ‘The Economic Performance of Regions’. Regional Studies 37 (6–7):
549–78.
Rice, Robert C. 1983. ‘The Origins of Basic Economic Ideas and Their Impact on “New Order” Policies’. Bulletin of Indonesian Economic Studies 19 (2): 60–82.
Soesastro, M. Hadi. 1989. ‘The Political Economy of Deregulation in Indonesia’. Asian Sur-vey 29 (9): 853–69.
———. 2004. ‘Kebijakan persaingan, daya saing, liberalisasi, globalisasi, regionalisasi dan
semua itu’ [Competition policy, competitiveness, liberalisation, globalisation, region
-alisation and all that]. CSIS Economics Working Paper WPE 082, Centre for Strategic and International Studies, Jakarta.
Soesastro, Hadi, and M. Chatib Basri. 1998. ‘Survey of Recent Developments’. Bulletin of Indonesian Economic Studies 34 (1): 3–54.
Suryahadi, Asep, Gracia Hadiwijaya, and Sudarno Sumarto. 2012. ‘Economic Growth and
Poverty Reduction in Indonesia before and after the Asian Financial Crisis’. Bulletin of Indonesian Economic Studies 48 (2): 209–27.
Thee Kian Wie. 2002. ‘Competition Policy in Indonesia and the New Anti-monopoly and
Fair Competition Law’. Bulletin of Indonesian Economic Studies 38 (3): 331–42.
Thomas, K. D., and J. Panglaykim. 1966. ‘Indonesian Exports: Performance and Prospects 1950–1970, Part I’. Bulletin of Indonesian Economic Studies 2 (5): 71–102.
Tomich, Thomas P. 1992. ‘Survey of Recent Developments’. Bulletin of Indonesian Economic Studies 28 (3): 3–39.
Warr, Peter G. 1992. ‘Comparative Advantage and Protection in Indonesia’. Bulletin of Indo-nesian Economic Studies 28 (3): 41–70.
World Bank. 1981. World Bank Country Report on Indonesia. Washington, DC: World Bank.
———. 2012. Picking up the Pace: Reviving Growth in Indonesia’s Manufacturing Sector.
Jakarta: World Bank.
———. 2015. World Development Indicators 2015. Washington, DC: World Bank
Wymenga, Paul S. J. 1991. ‘The Structure of Protection in Indonesia in 1989’. Bulletin of Indonesian Economic Studies 27 (1): 127–53.