37
The Impact of Social Media Towards Brand Equity: An Empirical Study of Mall
X
Lavina Tresna, Jovita Christin Wijaya
International Business Management Program, Petra Christian University Jl. Siwalankerto 121-131, Surabaya
E-mail: lavina.tresna@gmail.com, jovitachristinw@gmail.com
ABSTRACT
This research is aimed to analyze the impact of social media use and functionalities towards brand equity with an empirical study of Mall X. Mall X’s Instagram is being analyzed throughout this research. Furthermore, this research attempts to examine the impact of social media use and functionalities on brand equity elements simultaneously and individually.
Data processing methods used in this research are validity and reliability test and classical assumption tests, while simple and multiple linear regressions are used as data analysis methods. Online questionnaire is used to collect data of 111 respondents. These research findings show that identity and conversation use and functionalities have significant impact on brand awareness simultaneously and individually, sharing and presence use and functionalities have significant impact on brand associations simultaneously and individually, reputation use and functionality has significant impact on perceived quality, and relationship use and functionality has significant impact on brand loyalty
Keywords: Social Media, Brand Awareness, Brand Association, Perceived Quality, Brand Loyalty
ABSTRAK
Penelitian ini bertujuan untuk menganalisa pengaruh penggunaan dan fungsi jejaring sosial terhadap brand equity dengan studi empiris Mal X. Instagram Mal X akan dianalisa melalui penelitian ini. Selain itu, penelitian ini juga menguji pengaruh dari penggunaan dan fungsi jejaring sosial terhadap elemen dari brand equity secara simultan dan individual.
Metode pengolahan data yang digunakan dalam penelitian ini adalah validitas dan reliabilitas serta uji asumsi klasik, sedangkan regresi linear sederhana dan berganda digunakan sebagai metode analisa data. Kuesioner online digunakan untuk mengumpulkan data dari 111 responden. Hasil penelitian ini menunjukan bahwa penggunaan dan fungsi identity dan conversation memiliki pengaruh yang signifikan terhadap brand awareness secara simultan dan individual, penggunaan dan fungsi sharing dan presence memiliki pengaruh yang signifikan terhadap brand association secara simultan dan individual, penggunaan dan fungsi reputation memiliki pengaruh yang signifikan terhadap perceived quality, dan penggunaan dan fungsi relationship memiliki pengaruh yang signifikan terhadap brand loyalty.
Kata Kunci: Jejaring Sosial, Brand Awareness, Brand Association, Perceived Quality, Brand Loyalty
INTRODUCTION
The world back then is different from the world right now. Globalization becomes the most disruptive phenomenon in modern history, not to mention in business world. Globalization is like two sides of a coin; it brings opportunities and challenges for businesses. In this vast changing world, information has been integrated; it makes international business is possible and easier. However, this big potential is also corresponded with several challenges.
38 managing intangible assets, since intangible assets, in which are often represented by brand, now contribute 70% - 80% of total market valuation of 500 companies in Fortune (The Economist Group, 2013).
According to The American Marketing Association, the definition of brand is “a name, term, sign, symbol, or design, or a combination of them, that is intended to identify the goods and services of one seller or a group of sellers and to differentiate them from those of competitors” (as cited in Kotler & Keller, Marketing Management, 2012, p. 241). In other words, brand is significant for companies to distinguish themselves from competitors and potential competitors. Brands are also tools for companies to communicate their values to customers’ minds and hearts (Keller, 1993). Therefore, companies should have strategic management of their brands by building strong brands that have superior brand equity (Aaker, 1991; Kotler& Keller, 2012). Brand equity is a term used to explain a brand’s assets and liabilities that could increase or decrease current value of products or services (European Institute for Brand Management, 2009).
Globalization era makes everything easier to be searched and found, since almostevery computer is provided with Internet service. In Indonesia itself, Internet penetration is approximately 28% from total population, in which 61.23% of Indonesia’s Internet users utilize Internet for social media platforms, which is placed in the fifth rank after Internet utilization for emailing, searching for news, searching for goods and services, and searching for information of government’s institutions (Harian TI.com, 2014). While according to Ministry of Communications and Information Technology (Kemenkominfo), Internet users in Indonesia were approaching 63 million people in last quarter of 2013, and 95 percent of Internet users utilize Internet for social media’s access (Kominfo, 2013). Those facts show that Indonesia also starts to participate on online social media’s trend, or in other words, is currently in transition from traditional to modern marketing. Indonesian companies also start to use social media platforms todesignate their brands’ standpoint.
In this research, the researchers attempt to analyze one of Indonesia’s companies, in specific Mall X as one of the biggest mall industry’s companies in Surabaya. It is because Mall X, as the new comer also faced the impact of marketing transition and tight competition.
Shopping malls have been changing over time including the design, tenants, concept, as well as its functionality. According to Banerjee (2012), “malls have been transformed into a place for socializing, relaxing, entertainment and a symbol of status for consumers” (p. 106). As an effect, urban area people tend to go to shopping mall regularly either for business, daily needs, social needs, or recreation only. It is not surprising that shopping mall business is growing fast lately since the profitability is quite promising. The same phenomenon is happening in Indonesia, specifically in big cities such as Jakarta and Surabaya. In 2014, Indonesia had approximately 250 malls, 76 of them are located in Jakarta and 33 malls are located in Surabaya (Alexander, 2014; Nurhayat, 2014). Asosiasi
Pengelola Pusat Belanja Indonesia (APPBI) stated that fast growth of shopping mall business is caused by the changing lifestyle of Indonesian in socializing and consuming goods and services (Harian Neraca, 2014). It is also supported by the increasing of middle up income people from 25% of total population in the 1990’s, became 57% in 2010 (Afif, 2014).
Mall X as a new comer has megablock mall concept that successfully brings up Surabaya citizen’s lifestyle into the next level by collaborating with international brands. Mall X was built in 2011; and its main target is for middle-up class society. Based on its vision and mission, Mall X wants to bring innovation, give additional value, and offer a better life for society and stakeholders in order to be the first choice of consumers.
However, there are several things to be concerned in order to survive in mall industry in Surabaya. First, Asosiasi Pengelola Pusat Belanja Indonesia (APPBI) DPD East Java stated that Surabaya people has a unique characteristic in which Surabaya people tend to go to new malls because of their curiosity and after a while they get bored (Citra, 2011). Moreover, as time went by, many shopping malls rebranded themselves and renovated their building. Furthermore, looking at the tenants inside, customers hardly differentiate one mall to others since there are many common offerings. Seeing from those facts, it can be concluded that there is stiff competition among players in this business.
Therefore, Mall X should be able to differentiate itself among the others and it needs better marketing strategy. Currently, Mall X focuses more to socialize its tenants, events, and promotion through social media. The fact that social media is widely use in Surabaya becomes an opportunity for Mall X to do social media marketing in daily basis.
In conclusion, the researchers would like to investigate about specific use and functionalities of Mall X’s Instagram through Honeycomb model, whether they have impacts on specific dimension of brand equity. Honeycomb model consists of identity, conversation, sharing, presence, reputation, and relationship use and functionalities.
LITERATURE REVIEW
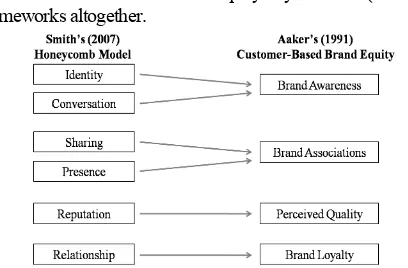
In order to analyze the use and functionalities of social media, in the case of Mall X’s Instagram, towards brand equity of Mall X, it needs strong foundation using theories and previous researches regarding both social media use and functionalities as the independent variable and brand equity as the dependent variable. Honeycomb model that was developed by Smith in 2007 is used as a framework to analyze the use and functionalities of social media. Meanwhile, elements of brand equity in Customer Based Brand Equity model developed by Aaker (1991) are used as the dependent variables within this research.
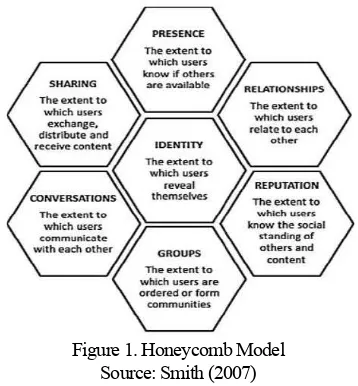
39 detail of Honeycomb model can be seen in figure 1 (Smith, 2007). Every social media platform does not need to have all seven building blocks.
Figure 1. Honeycomb Model Source: Smith (2007)
First, the identity block presents the extent of a social media user discloses his identity or personal information, such as name, age, gender, occupations, etc. in social media platform. Social media user also tends to reveal feelings, opinions, likes and dislikes, etc. (Kietzmann, Hermkens, McCarthy, &Silvestre, 2011). Identity use and functionalities of Instagram could be seen through profile and shared contents. In the case of Mall X, there is a brief explanation of Mall X together with the contact number, email, and website on Mall X’s Instagram profile. Moreover, Mall X shows its identity as a lifestyle mall through its content that follows trend (Instagram Mall X, 2015).
Second, the conversation block presents the extent of a social media user has a two-way communication with other social media users in social media platform (Webb, 2004). Users engage in conversations for different purposes. In this research, researchers want to measure the conversation use and functionalities of Instagram, in which taking account of comments, mention, and ‘Direct’ features. Conversation could be made through both mentioning other users inside a comment and using Instagram Direct to communicate with selected people (Babac, 2011). In the case of Mall X, conversation function is also used by Mall X by replying comment of others and mentions customers, other brands, and tenants’ Instagram accounts.
Third, the sharing block presents the extent of a social media user shares, receives, and distributes content via online in a social media platform (Jokela, 2013). Fundamentally, the primary use and functionalities of social media is in sharing block, since all activities in social media platform involve sharing; sharing specific contents, such as text, links, pictures, sounds, videos. Instagram mainly enables its user to share photos and videos with hashtags inside caption (Babac, 2011). In the case of Mall X, It posts based on timeline that is suitable for certain context. Mostly, photos or videos have medium resolution (MDPI), which is minimum resolution for mobile phone. Moreover, it puts
persuasive and informative caption to keep its customers engaged.
Fourth, the presence block presents the extent of a social media user recognizes other users are accessible. In the case of social media, presence could be seen through their status and/or location update, which often represented by a feature called ‘check-ins’ (Jokela, 2013). Instagram allows other users to see one user’s location after he posted a picture on timeline also by using ‘check-ins’ feature. It represents that he or she is available in specific place (Babac, 2011). Moreover, presence block also can be represented by captions or words in Instagram that indicate specific physical locations. In the case of Mall X, it uses caption in its posts that indicate certain store location (Instagram Mall X, 2015).
Fifth, the reputation block presents the extent social media user in defining behavior of others according to their history (Dingledine, Freedman, Molnar, Parkes, & Syverson, 2003). However, in social media context, reputation is built upon opinions through electronic word of mouth; if firms receive good electronic word of mouth, their reputation will be increased (Kietzmann, Silvestre, McCarthy, & Pitt, 2012). Electronic word of mouth is in a form of comments and endorsement by other social media users, followers, and opinion leaders. Reputation also could be seen in numbers in terms of number of likes and followers on Facebook, Twitter, and Instagram as well as number of thumbs up or thumbs down and number of views on Youtube (Kietzmann, Silvestre, McCarthy, & Pitt, 2012). In the context of Instagram, reputation function could be seen through positive comments, as well as followers and ‘likes’. Moreover, number of followers and ‘likes’ could be a quantitative measure of reputation, whereas comments of users and followers will measure reputation from qualitative side (Babac, 2011; Liuski, 2012; Instagram, 2015). In the case of Mall X, Mall X’s Instagram has many followers. In addition, many of customers or Mall X’s Instagram followers give ‘likes’ and positive comments on photos and videos shared (Instagram Mall X, 2015).
Sixth, the relationship block presents the extent of a social media user to be able to relate with other users (Babac, 2011). In the context of Instagram, relationship can be built through following each other. An Instagram user could follow certain account to be able to see the updates as well as accept others’ follow request to connect with them. Besides, through tagging and doing regram other users also could maintain relationship between users (Babac, 2011; Liuski, 2012; Instagram, 2015). In the case of Mall X, it maintains relationship with customer and opens its account for public and it follows account in relevance with its business. It tries to regram good quality of photo from its customers in order to appreciate and maintain the bond with its customers.
40 created by a social media user, such as list of families, fans, and friends, in his/her own account. On the other hand, private group is usually linked with the real world, in which needed approval or invitation for membership from the administrator of the group. Throughout this function, social media user is able to share certain content with members only and choose to be presence only for certain group of people (Kietzmann, Silvestre, McCarthy, & Pitt, 2012). In the context of Instagram, group function is in a form of Instameet where Instagram users are meet in a real time and face-to-face (Instagram, 2015). In the case of Mall X, group in a form of Instameet, has never been done. Therefore, in this research group use and functionality in HoneycombModel will be eliminated (Instagram Mall X, 2015).
David A. Aaker’s theory regarding brand equity has been the foundation for many researches. Based on his definition, brand equity is brand’s assets and liabilities that could increase or decrease the value of products or services (European Institute for Brand Management, 2009). Brand equity can improve marketing productivity as well as reduce the expenses by shaping customer’s perception towards a brand. Brand equity has four elements, including brand awareness, brand association, brand loyalty, and perceived quality (Aaker & Joachimsthaler, 2000). This research will use the four elements of Brand Equity proposed by Aaker and focusing on Customer-Based Brand Equity or from marketing perspective.
First, Keller (2012) defines brand awareness dimension as the ability of consumer’s to recognize and to recall the brand’s components (name, sign, logo, and etc.) on their mind as a component of a certain product or service of a company. Whereas according to Aaker (2000), brand awareness is a brand’s strength in consumer’s memory in continuous period of time. Brand awareness has vital role of consumers’ decision making, since the higher the brand awareness, that specific product/brand will become member of consumers’ consideration set of brands (Moisescu, 2009). Furthermore, brand awareness can be differentiated from width and depth. Width means that when a consumer buys a product, a brand name will be recalled on their memories at one time. Depth is the degree of easiness of consumers to recall the brand. Creating brand awareness is the first step of creating strong brand equity.
Second, Aaker (2000) underlined brand association as any individual’s memory linkage towards a particular brand. There are three categories of brand association, such as: attitudes, benefits, and attributes (Keller, 2012). Attitudes are defined brand’s overall valuations. Benefits are divided into three types: functional (basic physiological needs, such as food and clothes), symbolic (consumers’ perception of a brand), and experimental (what consumers feel when they use the product). While attributes are divided into two types: product-related attributes (such as ingredients, flavor, Etc.) and non product-related attributes (price, packaging, Etc.) (Keller, 2012). As the name implies, brand association is a brand’s meaning to people, therefore brand association is highly corresponded to consumers’ experiences, feelings, and attitudes. Brand association can assist consumers to
generate and recall information about a brand, maintain a reason to buy, create consumers’ positive feelings and attitudes (Aaker & Joachimsthaler, 2000). Moreover, brand association is able to create POD (point of differentiation) and become distinguishable among competitors that lead to competitive advantage (Keller, 2012). Brand association is an important dimension of brand equity, since the higher level of brand association will increase brand equity (James, 2005).
Third, perceived quality refers to customer’s mindset or perceptions towards quality of certain brand in a benchmark of others in similar industry (Aaker D. A., 1991). Perceived quality could be built through brand’s perceived credibility and superiority in comparison with others (Ph.D. Mustafa Karadeniz, 2010). Perceived quality influences customers to choose preferred brand rather than others (Yoo, Donthu, & Lee, 2000). Perceived quality, which is based on usage experience of customers links directly to the customer satisfaction from the actual quality of the products. Brand differentiation and superiority could be a positive value to the customer’s satisfaction, which leads to the higher perceived quality of a brand. High perceived quality in customer’s mindset is one of competitive advantage for company that open up the chance to charge a premium price. At the end, higher perceived quality will lead to higher brand equity (Baldauf, Cravens, & Binder, 2003).
Fourth, according to the basic definition, brand loyalty defined as “final dimension of consumer brand resonance symbolizing the consumer’s ultimate relationship and level of identification with the brand” (Keller, 2012). Nowadays, brand loyalty is widely accepted as behavioral of constant purchase on one specific good or services of certain brand (Aaker D. A., 1991). Based on composite approach, brand loyalty refers to the extents which customers commit and have constant repurchase of the certain brand. As it is defined, it implies that customer who is loyal to a preferred brand would likely to accept any price given and having high switching cost to another brand (Severi, Ling, & Nasermoadeli, 2014). There are two main dimensions in building brand loyalty, which are intensity and activity. Intensity refers to depth of the bond with a brand; while purchase, use, and other activities that are related to the brand are called activity dimension (Keller, 2001). Therefore, in order to increase brand loyalty, companies should maintain customers’ cognitive and affective appeals. Cognitive side refers to functional benefit of using certain brand. Affective side can be formed through advertising and promoting similarity of brand values with customers’ values bydirect connection with customers (Touzani & Temessek, 2009).
41 and Customer-Based Brand Equity by Aaker (1991) frameworks altogether.
Figure 2. Impact of Social Media Use and Functionalities towards Brand Equity (ISMBE)
In order to answer the research problems, the hypotheses are constructed as following:
1. There is a significant impact of Mall X’s Instagram identity use and functionalities towards brand awareness of a brand
2. There is a significant impact of Mall X’s Instagram conversation use and functionalities towards brand awareness of a brand
3. There is a significant impact of Mall X’s Instagram sharing use and functionalities towards brand association of a brand
4. There is a significant impact of Mall X’s Instagram presenceuse and functionalities towards brand association of a brand
5. There is a significant impact of Mall X’s Instagram reputation use and functionalities towards perceived quality of a brand
6. There is a significant impact of Mall X’s Instagram relationship use and functionalities towards brand loyalty of a brand
7. There is a simultaneous significant impact of Mall X’s Instagram identity and conversation use andfunctionalities towards brand awareness of a brand 8. There is a simultaneous significant impact of Mall X’s
Instagram sharing and presence towards brand association of a brand
RESEARCH METHOD
In this research, causal study will be used as theresearch method to analyze the impact of social media use and functionalities towards brand equity. The researchers would like to know whether the independent variables could have significant effect on dependent variables as mentioned in the research hypotheses through quantitative study or survey. Therefore, the researchers would like to test the asymmetrical relationships of the independent variables towards the dependent variables.
Quantitative study is being used because of theresult’s objectivity that has less bias compared to the qualitative study. Therefore it will have more precise and accurate results that are applicable to the company. There are eight hypotheses regarding the impact of social media use and
functionalities towards brand equity that are tested, therefore it is suitable to use quantitative study.
Independent variables of this research are the building blocks of Honeycomb model (Smith, 2007) with exclusion of group use and functionalities.Therefore, the independent variables used are identity, conversation, sharing, presence, reputation, andrelationship use and functionalities. The dependent variables are brand elements of brand equity, whichconsists of brand awareness, brand association, perceived quality, and brand loyalty.
Based on the classification of data type, this research adopts nominal data and interval data. This research will use three types of rating scales: category scale, dichotomous scale, and 5-point Likert scale. In gathering data, the researchers were using both primary and secondary data. First, the researchers looked for secondary data as the basis for theoreticalbackground and relevant supporting research. For this research, primary data is collected through onlinequestionnaires, personal communication with chief ofpromotion Mall X, and internalsource.
For the purpose of this research, probability sampling is used. In particular, this research used the simple random sampling method in determining the respondents. Population in this research is the followers of Mall X’s Instagram; they have received updates as well as experienced the use and functionalities of Mall X’s Instagram as a whole. 100 out of 111 questionnaires are accepted and analyzed in this research.
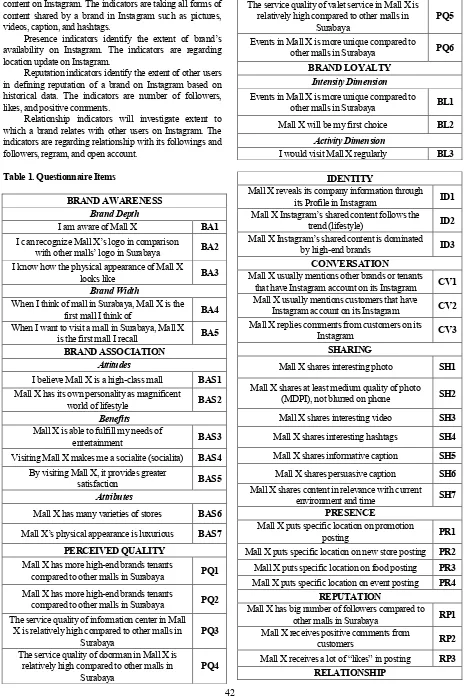
In order to measure social media use and functionalitiesand brand equity elements through questionnaires, the researchers refer to previous relevant journals and studies. Some indicators or measurements are developed from the definition.
The researchers examine brand awareness as the degree of awareness by respondents regarding the brand. The indicators are differentiated into brand depth and brand width.
The indicators of brand association evaluate the degree of respondents’ assocation regarding the brand. The measurements are based on attitudes, benefits, and attributes of the brand.
Perceived quality indicators would measure respondents’ perceived quality in benchmarking with other competitiors in Surabaya. It can be in a form of both products and services provided.
Brand loyalty indicators would investigate the loyalty of respondents towards the brand. Basically, the measurements can be categorized into intensity and activity dimensions of brand loyalty.
Identity indicators would investigate the extent to which a brand discloses company identity and information on Instagram. Indicators used are Instagram profile and shared content.
Conversation indicators would investigate the extent to which a brand has two ways communication with its customers and tenants on Instagram. The indicators take comment and mention in Instagram into account.
42 content on Instagram. The indicators are taking all forms of content shared by a brand in Instagram such as pictures, videos, caption, and hashtags.
Presence indicators identify the extent of brand’s availability on Instagram. The indicators are regarding location update on Instagram.
Reputation indicators identify the extent of other users in defining reputation of a brand on Instagram based on historical data. The indicators are number of followers, likes, and positive comments.
Relationship indicators will investigate extent to which a brand relates with other users on Instagram. The indicators are regarding relationship with its followings and followers, regram, and open account.
Table 1. Questionnaire Items
BRAND AWARENESS
Brand Depth
I am aware of Mall X BA1
I can recognize Mall X’s logo in comparison
with other malls’ logo in Surabaya BA2 I know how the physical appearance of Mall X
looks like BA3
Brand Width
When I think of mall in Surabaya, Mall X is the
first mall I think of BA4
When I want to visit a mall in Surabaya, Mall X
is the first mall I recall BA5 BRAND ASSOCIATION
Attitudes
I believe Mall X is a high-class mall BAS1 Mall X has its own personality as magnificent
world of lifestyle BAS2
Benefits
Mall X is able to fulfill my needs of
entertainment BAS3
Visiting Mall X makes me a socialite (socialita) BAS4 By visiting Mall X, it provides greater
satisfaction BAS5
Attributes
Mall X has many varieties of stores BAS6 Mall X’s physical appearance is luxurious BAS7
PERCEIVED QUALITY Mall X has more high-end brands tenants
compared to other malls in Surabaya PQ1 Mall X has more high-end brands tenants
compared to other malls in Surabaya PQ2 The service quality of information center in Mall
X is relatively high compared to other malls in Surabaya
PQ3
The service quality of doorman in Mall X is relatively high compared to other malls in
Surabaya
PQ4
The service quality of valet service in Mall X is relatively high compared to other malls in
Surabaya
PQ5
Events in Mall X is more unique compared to
other malls in Surabaya PQ6
BRAND LOYALTY
Intensity Dimension
Events in Mall X is more unique compared to
other malls in Surabaya BL1
Mall X will be my first choice BL2
Activity Dimension
I would visit Mall X regularly BL3
IDENTITY
Mall X reveals its company information through its Profile in Instagram ID1 Mall X Instagram’s shared content follows the
trend (lifestyle) ID2
Mall X Instagram’s shared content is dominated
by high-end brands ID3
CONVERSATION
Mall X usually mentions other brands or tenants
that have Instagram account on its Instagram CV1 Mall X usually mentions customers that have
Instagram account on its Instagram CV2 Mall X replies comments from customers on its
Instagram CV3
SHARING
Mall X shares interesting photo SH1 Mall X shares at least medium quality of photo
(MDPI), not blurred on phone SH2 Mall X shares interesting video SH3 Mall X shares interesting hashtags SH4 Mall X shares informative caption SH5 Mall X shares persuasive caption SH6 Mall X shares content in relevance with current
environment and time SH7
PRESENCE
Mall X puts specific location on promotion
posting PR1
Mall X puts specific location on new store posting PR2 Mall X puts specific location on food posting PR3 Mall X puts specific location on event posting PR4
REPUTATION
Mall X has big number of followers compared to
other malls in Surabaya RP1
Mall X receives positive comments from
customers RP2
43 Mall X receives a lot of “likes” in posting RL1 Mall X follows accounts in relevance with its
business RL2
Mall X regrams pictures from customers RL3
RESULTS AND DISCUSSION
This research will be analyzed with the support of statistical computersoftware, which is SPSS for Windows. For the data processing method, the researchers use Simple Linear Regression and Multiple Linear Regression analyses; whereby there are six independent variables are hypothesized to explain variance of four dependent variables. Technique for carry out regression analysis is named Ordinary Least Square (OLS), in which first developed by Carl Friedrich Gauss. There will be analyses to check the validity and the reliability of data, by testing the corrected item total correlation (r value) and Cronbach’s Alpha test, respectively. Furthermore, in order to get best, unbiased, and linear regression results, the researchers run BestLinear Unbiased Estimator (BLUE) Classic Assumption Testing. BLUE Classic Assumption Testing is used to assure that there are no multicollinearity of independent variables, no autocorrelation in residuals, and no residuals’ heteroscedasticity; also indicating normality of residuals (Wooldridge, 2013). Researchers then utilize the coefficient of multiple determinants to see the statistical model’s goodness of fit by looking for Adjusted R Square and F-Test. F-Test is conducted to investigate whether the specific independent variables tested have simultaneous impacts on respective dependent variables. Lastly, t-Test is used to analyze the individual impact of independent variable towards dependent variable.
There are ten variables, both independent and dependent variables, to be tested with validity and reliability tests. Six of them are independent variables; which are Identity, Conversation, Sharing, Presence, Reputation, and Relationship. While the rest are dependent variables, such as Brand Awareness, Brand Association, Perceived Quality, and Brand Loyalty.
Moreover, there are two multiple linear regression models and two simple linear regression models to be tested. The first multiple linear regression is analyzing the impact of Identity and Conversation towards Brand Awareness. The second multiple linear regression is analyzing the impact of Sharing and Presence towards Brand Association. The first simple linear regression is analyzing the impact of Reputation towards Perceived Quality. The second simple linear regression is analyzing the impact of Relationship towards Brand Loyalty.
Table 2. Result of Reliability Test
Variable Cronbach's Alpha N. of Items
Identity 0.898 3
Brand Association 0.885 7
Perceived Quality 0.845 6
Brand Loyalty 0.77 3
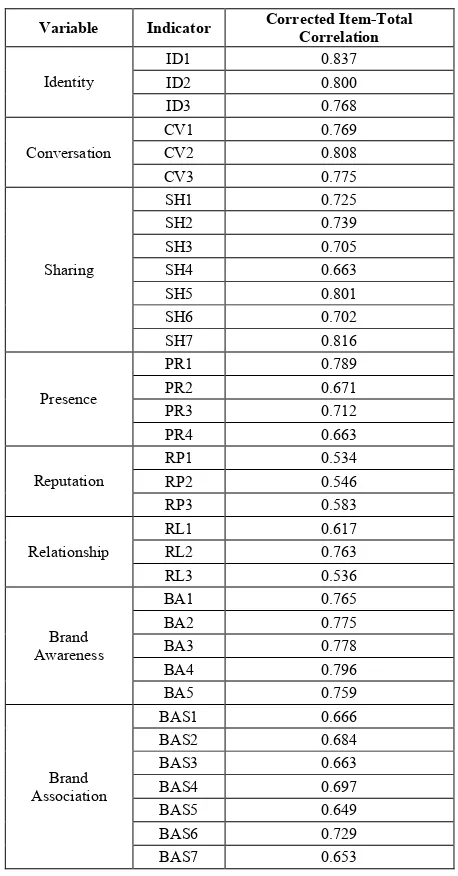
All variables, both independent and dependent variables’ Cronbach’s Alpha is above 0.7, as it is seen in Table 2 which fulfill the requirement for reliability (Ghozali, 2013). Moreover, all items within variables are considered to be valid, seeing from values of Corrected Item-Total Correlation are all above r table (Table 3.). This research has 98 degree of freedom, and 0.05 significance level (2-tailed); therefore the r table is 0.197 (Ghozali, 2013).
Table 3. Result of Validity Test
Variable Indicator Corrected Item-Total Correlation
44
PQ1 0.613
PQ2 0.601
PQ3 0.587
PQ4 0.607
PQ5 0.698
Perceived Quality
PQ6 0.644
BL1 0.614
BL2 0.626
Brand Loyalty
BL3 0.577
There are four classical assumption tests to be performed for four linearregression models as the preliminary steps.
The first assumption test to be performed is multicollinearity test. Theresearchers use two methods, which are by analyzing the coefficient correlations, analyzing tolerance value and variance inflation factor (VIF). For the first method, multicollinearity is indicated when the coefficient correlations is greater than 0.9. While for the second method, if the Tolerance value is ≤ 0.10 and the value of Variance Inflation Factor (VIF) is ≥ 10, it shows that there is a multicollinearity problem (Ghozali, 2013).
There is no multiple linear regression which has coefficient correlations value above 0.90; Tolerance value below or equal to 0.10; and VIF above or equal to 10. Therefore, there is no multicollinearity occurs between the first and second multiple linear regression.
For both the first and second simple linear regression model, the multicollinearity testing is not necessary. Multicollinearity will occur when there is correlation between independent variables. In the simple linear regression, there is only one independent variable; thus it is not possible for multicollinearity to occur (Ghozali, 2013).
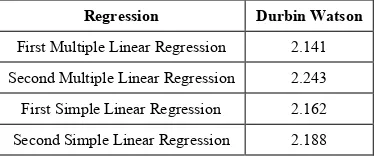
The second assumption test is autocorrelation test, which is analyzed by seeing the result of Durbin-Watson test. The test aimed to get the dU<d<4-dU, which means that there are no both positive and negative autocorrelation (Ghozali, 2013).
Table 4. Result of Autocorrelation Test
Regression Durbin Watson
First Multiple Linear Regression 2.141
Second Multiple Linear Regression 2.243
First Simple Linear Regression 2.162
Second Simple Linear Regression 2.188
According to the Durbin-Watson table, the value of dU and dL for two independent variables with 100 samples and 0.05 significance level are 1.715 and 1.634, respectively. Since the value of Durbin-Watson is above dU and below 4-dU. Therefore, there is no both positive and negative autocorrelation in the residuals of the first and the second multiple linear regression models.
In accordance to the Durbin-Watson table, for one independent variable with 100 samples and 0.05 significant
level, the value of dU and dL are 1.694 and 1.654, respectively. The value of Durbin-Watson in the first and the second linear regression model fulfill the criteria, which is greater than dU and below 4-dU. Therefore, positive and negative autocorrelation do not occur in the residuals of the first and the second simple linear regression model.
The researchers use statistical analyses. For the statistical test, the Park test is conducted. The decision rule for the Park test is when the coefficients are insignificant with significance value above 0.05. When the significance value is above 0.05, heteroscedasticity does not occur (Ghozali, 2013).
Table 5. Result of Park Tests
Independent Variable Park Test Asymp. Sig (2-tailed)
ID 0.968
CV 0.936
SH 0.355
PR 0.291
RP 0.264
RL 0.623
Table 5 indicates that there is no heteroscedasticity occurs. Thesignificance levels of independent variables are above 0.05. Heteroscedasticity does not occur in residuals of all linear regression models.
In conclusion, from the statistical test applied, it can be seen that there is no heteroscedasticity in residuals of all linear regression models.
The researchers utilize statistical analyses to conductnormality test for two simple linear regression models and two multiple linear regression models. Kolmogorov-Smirnov test is used for statistical analysis. The decision rule of Kolmogorov-Smirnov test is if the significance level is below 0.05 (2-tailed), or significant (Ghozali, 2013).
Table 6. Result of Kolmogorov-Smirnov Tests
Regression Kolmogorov-Smirnov Asymp. Sig (2-tailed)
First Multiple Linear
Regression 0.352
Second Multiple Linear
Regression 0.733
First Simple Linear
Regression 0.405
Second Simple Linear
Regression 0.552
According to the table 6, all the values of significance level are not below 0.05. It can be inferred that the residuals of all linear regression models are normally distributed. All linear regression models are statistically proven to have residuals that are normally distributed.
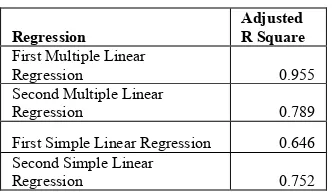
45 section, adjusted R square, F-test, and t-test are conducted for multiple linear regression models. However, for simplelinear regression adjusted R square and F-test are being used (Ghozali, 2013).
Table 7. Result of Adjusted R Square
Regression
Adjusted R Square
First Multiple Linear
Regression 0.955
Second Multiple Linear
Regression 0.789
First Simple Linear Regression 0.646 Second Simple Linear
Regression 0.752
First, it can be seen in the table that the adjusted R square shows a value of0.955 for the first multiple linear regression model. It means that 95.5% of the variation in Brand Awareness can be determinedby the variation in Identity and Conversation, while the other 4.5% are explained by variables other than those two independent variables.
Second, based on the table., adjusted R square shows a value of 0.789 for the second multiple linear regression. It meansthat 78.9% of the variation in Brand Association can be determined by the variation in Sharing and Presence, while the other 21.1% are explained by other factors.
Third, the adjusted R square of the first simple linear regression is 0.646, meaning that 64.6% of the variation in Perceived Quality can be explained by variation in Reputation. The other 35.4% is explained by other factors.
Forth, Adjusted R square of the second simple linear regression model is 0.752, meaning that 75.2% of the variation in Brand Loyalty can be explained by variation in Relationship. The other 24.8% is explained by other factors.
Table 8. Result of F-Test Sig.
Regression F-Test Sig.
First Multiple Linear Regression 0.00
Second Multiple Linear Regression 0.00
First Simple Linear Regression 0.00
Second Simple Linear Regression 0.00
Table 8 above indicates that all the Sig. values are 0.00, which are below 0.05. Identity and Conversation use and functionalities as independent variables have simultaneous significant impact on Brand Awareness of a brand. Sharing and Presence as independent variables have simultaneous significant impact on Brand Association of a brand. Reputation as independent variable has significant impact on Perceived Quality. Relationship as independent variable has significant impact on Brand Loyalty.
Table 9. Result of Regression Coefficients
Regression Independent Variable
Unstandardize d Coefficients
t-Test Sig.
ID 0.544 0.00
First Multiple
Linear Regression CV 0.394 0.00
SH 0.190 0.00
Second Multiple
Linear Regression PR 0.695 0.00
First Simple Linear
Regression RP 0.712 0.00
Second Simple
Linear Regression RL 0.804 0.00
Seeing from Table 9 above, there are several things to be concluded.
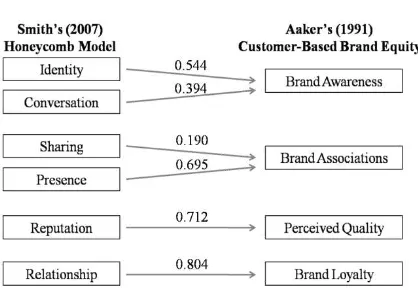
It is shown in the table that the Sig. value of Identity is below 0.05, meaning that Identity use and functionalities alone has significant impact on Brand Awareness. Furthermore, looking on the Unstandardized Coefficients Betaof 0.544, it can be understood that for every single unit increase of Identity, there will be 0.544 unit increases on the Brand Awareness. For Conversation, it also has Sig. value below 0.05. It means that Conversation use and functionalities individually has significant impact on Brand Awareness. Moreover, the Unstandardized Coefficient Beta of Conversation is 0.394, which is relatively lower compared to Identity’s. For every unit increase in the Conversation, there will be unit increase of 0.394 on the Brand Awareness.
Therefore, it can be concluded that the regression equation for the first multiple linear regression model is:
BA = β0 + 0.544 ID + 0.394 CV + ε
It is shown in the table that the Sig. value of Sharing is below 0.05, meaning that Sharing use and functionalities alone has significant impact on Brand Association. Furthermore, looking on the Unstandardized Coefficients Beta of 0.190, it can be understood that for every single unit increase of Sharing, there will be 0.190 unit increase on the Brand Association. For Presence, it also has Sig. value below 0.05, which means that Presence use and functionalities individually has significant impact on Brand Association. Moreover, the Unstandardized Coefficient Beta of Presence is 0.695, which is relatively higher compared to Sharing’s. For every unit increase in the Presence, there will be unit increase of 0.695 on the Brand Association.
Therefore, it can be concluded that the regression equation for the second multiple linear regression model is:
BAS = β0 + 0.190 SH + 0.695 PR + ε
46 Therefore, the regression equation of the first simple linear regression is stated below.
PQ = β0 + 0.712 RP + ε
By looking at the Unstandardized Coefficient Beta, the value is 0.804. It is implied that for every unit increase on Relationship, there will be unit increase of 0.804 of Brand Loyalty.
Therefore, the regression equation of the second simple linear regression is stated below.
BL = β0 + 0.804 RL + ε
Figure 3. The Unstandardized Coefficients of Regression Model
CONCLUSION
Despite tight competition among malls in Surabaya, Mall X as the new comer has successfully brought innovation in mall industry. However, having an innovation does not indicate that Mall X wins the competition; other malls also did the same. Acknowledgingthis fact, it is crucial for Mall X to take actions in order todifferentiate itself and win the competition. One of the ways to differentiate itselfis by enhancing its marketing strategy, especially in terms of social media marketing, to build strong brand equity (Kotler & Keller, 2012; Christodoulides,2009; Berthon, Pitt, McCarthy, & Kates, 2007; Aaker, 1991). By emphasizing social media marketing, in which focusing on Instagram as social media platform, Mall X has tried to brand itself as a mall of lifestyle. Thus, the researchers attempt to analyze the impact of social media use and functionalities, focusing on Instagram, towards Mall X’s brand equity; whether it is effectively and significantly affecting on the brand equity.
The first, second, and seventh hypotheses are answered by the first multiple linear regression model. First, the seventh hypothesis, which is focusing on the simultaneous impact, is answered by the result of F-test. The result of F-test’s Significance level is 0.000, which is below 0.05. It is implied that both independent variables, Instagram Identity and Conversation use and functionalities, are significant predictors of Brand Awareness. The first and second hypotheses are about the individual impact of each independent variable, Identity and Conversation use and
functionalities towards Brand Awareness. It is answered by the t-test result of the first multiple linear regression model. These results show that both Identity and Conversation have individual significant impacts towards Brand Awareness.
For the third, fourth, and eighth hypotheses are answered by second multiple linear regression. Firstly, the third and fourth hypotheses are tested using t-test of each independent variable, Sharing and Presence, towards Brand Association as the dependent variable. All P-values of both independent variable are below Sig value of 0.05., which is 0.000 for Sharing and 0.000 for Presence. It proves that Sharing and Presence have individual significant impacts on Brand Association. Secondly, simultaneous impact is being tested using the F test. The result of F-test’s Significance level is 0.000, which is below 0.05. It is implied that the independent variables, Instagram Sharing and Presence use and functionalities, are significant predictors of Brand Association.
The first simple linear regression answers the fifth hypothesis about the impact of Reputation towards Perceived Quality. The F-test results indicate a Sig. value F of 0.000, which is much lower compared to significance level of 0.05. Therefore, from the results, it can be concluded that there is a significant impact of Instagram Reputation use and functionalities towards Perceived Quality of a brand.
The second simple linear regression answers the sixth hypothesis about the impact of Relationship on Brand Loyalty. The F-test results indicate a Sig. value F of 0.000, which is lower compared to significance level of 0.05. At last, it can be concluded that there is a significant impact of Instagram relationship use and functionalities towards brand loyalty of a brand.
47
REFERENCES
Aaker, D. (1991). Managing Brand Equity. Capitalizing on the Value of a Brand Name. New York: Free Press.
Afif, M. S. (2014). The Rising of Middle Class in Indonesia: Opportunity and Challenge. Retrieved 2 9, 2015, from University of Southern California, USA: http://umdcipe.org/conferences/DecliningMiddle ClassesSpain/Papers/Afif.pdf
Alexander, H. B. (2014, 8 26). Hingga 2016, Surabaya Tambah Empat Pusat Belanja Baru. Retrieved 2 6, 2015, from Kompas.com Properti: http://properti.kompas.com/read/2014/08/26/1720 07121/Hingga.2016.Surabaya.Tambah.Empat.Pu sat.Belanja.Baru
Babac, R. (2011). Impact of Social-Media Use On Brand Equity of Magazine Brands: A Qualitative Study of Vogue Turkey. Halmstad University, School of Business and Engineering. Sweden: Halmstad University.
Baldauf, A., Cravens, K. S., & Binder, G. (2003). Performance consequences of brand equity management: evidence from organizations in the value chain. Journal of Product & Brand Management, 12 (4), .220 - 236.
Banerjee, D. N. (2012). A Study on The Attractiveness Dimensions of Shopping Malls – An Indian Perspective. International Journal of Business and Social Science, 3 (2), 102-111.
Berthon, P., Pitt, L., McCarthy, I., & Kates, S. (2007). When Customers Get Clever: Managerial Approaches to Dealing with Creative Consumers. Business Horizons 50, no. 1 (January) , 39-47. Christodoulides, G. (2009). Branding in the Post-internet
Era. Marketing Theory 9, no. 1 (March 1) , 141-144.
Citra, A. (2011, August 4). APPBI Khawatirkan Pertumbuhan Mal di Surabaya. Retrieved February 19, 2015, from Antara News Jawa Timur:
http://www.antarajatim.com/lihat3/berita/68480/a ppbi-khawatirkan-pertumbuhan-mal-di-surabaya Dingledine, R., Freedman, M. J., Molnar, D., Parkes, D., &
Syverson, P. (2003). Reputation. Cambridge: Digital Government Civic Scenario Workshop. European Institute for Brand Management. (2009). f's
Pengguna Internet Indonesia Tahun 2013 Tembus
71 Juta Orang: association transfer to brand alliances. Journal of Consumer Marketing, 22(1) , 14-25.
Jokela, R. (2013). Social Media - Brand Building Tool :
Case Musch Oy. VAASAN
AMMATTIKORKEAKOULU International Business .
Keller, K. L. (1993). Conceptualizing, Measuring, and Managing Customer-Based Brand Equity. Journal of Marketing, 57 (January) , 1-22. Kietzmann, J. H., Silvestre, B. S., McCarthy, I. P., & Pitt, L.
(2012). Unpacking the social media phenomenon: towards a research agenda. Journal of Public Affairs .
Kietzmann, J., Hermkens, K., McCarthy, I., & Silvestre, B. (2011). Social media? Get serious! Understanding the functional building blocks of social media. Business Horizons (Article in Press) .
Kominfo. (2013, November 07). Kominfo. Retrieved February 23, 2015, from Kominfo : Pengguna
Kotler, P., & Keller, K. L. (2012). Marketing Management. New Jersey: Prentice Hall.
Liuski, E. (2012). The Main Social Media Outlets Used in Business to Business Marketing. Vaasa University of Applied Sciences, Business Economics and Tourism . Vaasa: Vaasa University of Applied Sciences.
Moisescu, L. P. (2009). THE IMPORTANCE OF BRAND AWARENESS IN CONSUMERS’ BUYING
DECISION AND PERCEIVED RISK
ASSESSMENT. Babeş-Bolyai University of
48 Management For Enterprises. Journal of Naval Science and Engineering, 6 (2), 117-132.
Severi, E., Ling, K. C., & Nasermoadeli, A. (2014). The Impacts of Electronic Word of Mouth on Brand Equity in the Context of Social Media. International Journal of Business and Management, 9 (8), 2014.
Smith, G. (2007, April 04). nForm. Retrieved March 3, 2015, from Social Software Building Blocks: http://nform.com/blog/2007/04/social-software-building-blocks/
The Economist Group. (2013, November 18). Going Global Economist. Retrieved February 2015, from Managing Brand Equity: http://going- global.economist.com/en/2013/11/18/managing-brand-equity/
Touzani, M., & Temessek, A. (2009). Brand Loyalty: Impact of Cognitive and Affective Variables. The Annals of “Dunarea de Jos” University of Galati , 227-242.
Webb, M. (2004, April 28). Interconnected. Retrieved March 03, 2015, from Interconnected: http://interconnected.org/home/2004/04/28/on_so cial_software
Wooldridge, J. M. (2013). Introductory Econometrics: A Modern Approach (5th international ed.). Australia: South Western: Cengage Learning. Xu, G. (1999). Estimating Sample Size for a Descriptive
Study in Quantitative Research. Quirk’s Marketing Research Review .