Oracle® Fusion Middleware
Oracle Reports Tutorial
11g Release 1 (11.1.1)
B32123-01Oracle Fusion Middleware Oracle Reports Tutorial, 11g Release 1 (11.1.1) B32123-01
Copyright © 2003, 2009, Oracle and/or its affiliates. All rights reserved. Primary Author: Usha M P
Contributors: Gururaj B S, Ingrid Snedecor, Rohit Marwaha, Ratheesh Pai, Rajesh Ramachandran, Rajiv Malhotra, Prabakara Reddy, Balaravikumar Shanmugasundaram, Suma Shanthappa, Navneet Singh, Hariharan Srinivasan, Vidya Viswanathan, Philipp Weckerle, Vikram Nanda, Pankaj Yadav, Vinod Murthy This software and related documentation are provided under a license agreement containing restrictions on use and disclosure and are protected by intellectual property laws. Except as expressly permitted in your license agreement or allowed by law, you may not use, copy, reproduce, translate, broadcast, modify, license, transmit, distribute, exhibit, perform, publish, or display any part, in any form, or by any means. Reverse engineering, disassembly, or decompilation of this software, unless required by law for interoperability, is prohibited.
The information contained herein is subject to change without notice and is not warranted to be error-free. If you find any errors, please report them to us in writing.
If this software or related documentation is delivered to the U.S. Government or anyone licensing it on behalf of the U.S. Government, the following notice is applicable:
U.S. GOVERNMENT RIGHTS Programs, software, databases, and related documentation and technical data delivered to U.S. Government customers are "commercial computer software" or "commercial technical data" pursuant to the applicable Federal Acquisition Regulation and agency-specific supplemental regulations. As such, the use, duplication, disclosure, modification, and adaptation shall be subject to the restrictions and license terms set forth in the applicable Government contract, and, to the extent applicable by the terms of the Government contract, the additional rights set forth in FAR 52.227-19, Commercial Computer Software License (December 2007). Oracle USA, Inc., 500 Oracle Parkway, Redwood City, CA 94065.
This software is developed for general use in a variety of information management applications. It is not developed or intended for use in any inherently dangerous applications, including applications which may create a risk of personal injury. If you use this software in dangerous applications, then you shall be responsible to take all appropriate fail-safe, backup, redundancy, and other measures to ensure the safe use of this software. Oracle Corporation and its affiliates disclaim any liability for any damages caused by use of this software in dangerous applications.
Oracle is a registered trademark of Oracle Corporation and/or its affiliates. Other names may be trademarks of their respective owners.
iii
Contents
Preface
... vAudience... v
Documentation Accessibility ... v
Related Documentation ... v
Conventions ... vi
Prerequisites... vi
1
Tutorial Overview
1.1 Tutorial Scenario ... 1-1 1.2 Summary ... 1-3
2
Adding Data to a Report
2.1 Opening the Web Page... 2-1 2.2 Using the Data Wizard to Add Data to a Sample Web Page... 2-2 2.3 Saving your Report as a JSP File ... 2-5 2.4 Summary ... 2-6
3
Reviewing the Source Code of the Web Report
3.1 Viewing the Web Source in Reports Builder ... 3-1 3.2 Verifying Your JSP Code... 3-2 3.3 Summary ... 3-2
4
Reviewing the Source Code for the Report Block
4.1 Viewing the Web Source in Reports Builder ... 4-1 4.1.1 Reviewing the Header Tag and Body... 4-1 4.1.2 Reviewing the rw:foreach Tag and Body ... 4-1 4.2 Verifying Your JSP Code... 4-2 4.3 Summary ... 4-2
5
Creating a Report Block for the Web Report
6
Creating a Graph for the Web Report
6.1 Opening the Source for the Report in Reports Builder ... 6-1 6.2 Creating a Graph Using the Graph Wizard ... 6-2 6.3 Saving Your Report with the New Graph... 6-4 6.4 Summary ... 6-4
7
Reviewing the Source Code for the Graph
7.1 Viewing the Source in Reports Builder... 7-1 7.2 Reviewing the rw:graph Tag... 7-1 7.3 Summary ... 7-3
8
Generating a Paper Report
8.1 Generate a Paper Report Based on Your Data Model ... 8-1 8.2 Modifying a Report in the Paper Design View ... 8-3 8.3 Summary ... 8-4
A
Quick Reference Guide
A.1 Entries for the Data Wizard... A-1 A.2 Entries for the Report Block... A-1 A.3 Entries for the Graph Wizard... A-2 A.4 Entries for the Report Wizard ... A-2 A.5 Reference Material ... A-2
B
Tool Palette and Toolbar Reference
B.1 Main Toolbar ... B-1 B.2 Data Model View Tool Palette ... B-2 B.3 Paper Layout View Tool Palette ... B-3
Glossary
v
Preface
This manual will help you get started using Oracle Reports, as well as introduce you to publishing data to the Web and paper.
Audience
This tutorial is intended for users new to Oracle Reports, or for users familiar with Oracle Reports who would like to learn more about building JSP-based Web reports.
Documentation Accessibility
Our goal is to make Oracle products, services, and supporting documentation accessible to all users, including users that are disabled. To that end, our
documentation includes features that make information available to users of assistive technology. This documentation is available in HTML format, and contains markup to facilitate access by the disabled community. Accessibility standards will continue to evolve over time, and Oracle is actively engaged with other market-leading
technology vendors to address technical obstacles so that our documentation can be accessible to all of our customers. For more information, visit the Oracle Accessibility Program Web site at http://www.oracle.com/accessibility/.
Accessibility of Code Examples in Documentation
Screen readers may not always correctly read the code examples in this document. The conventions for writing code require that closing braces should appear on an
otherwise empty line; however, some screen readers may not always read a line of text that consists solely of a bracket or brace.
Accessibility of Links to External Web Sites in Documentation
This documentation may contain links to Web sites of other companies or
organizations that Oracle does not own or control. Oracle neither evaluates nor makes any representations regarding the accessibility of these Web sites.
Deaf/Hard of Hearing Access to Oracle Support Services
To reach Oracle Support Services, use a telecommunications relay service (TRS) to call Oracle Support at 1.800.223.1711. An Oracle Support Services engineer will handle technical issues and provide customer support according to the Oracle service request process. Information about TRS is available at
http://www.fcc.gov/cgb/consumerfacts/trs.html, and a list of phone numbers is available at http://www.fcc.gov/cgb/dro/trsphonebk.html.
Related Documentation
For more information about Oracle Reports, refer to the following resources:
■ Oracle Fusion Middleware Publishing Reports to the Web with Oracle Reports Services ■ Oracle Reports online Help, which you can access in two ways:
■ From Reports Builder:
– Choose Help > Help Contents.
– Click Help or press F1 in any dialog box.
– In the Property Inspector, click a property, then press F1 to display the property’s help topic.
■ On the Oracle Technology Network (OTN) Oracle Reports 10g page
(http://www.oracle.com/technology/products/reports/index.h tml):
– Under Resources, click Hosted Online Help to display the Web-based version of the most recent Oracle Reports online Help.
– Under News, click Oracle Reports Online Help Update to replace your
Oracle Reports online Help in Reports Builder with the most recent update. Instructions for replacing your help file are included in the readme.txt
in the download file.
Conventions
The following text conventions are used in this document:
Prerequisites
The exercises in the tutorial use the Human Resources sample schema provided with the Oracle database and an HTML template.
The supporting files for the report you will build are available on the Oracle Technology Network (OTN): on the Oracle Reports 10g page
(http://www.oracle.com/technology/products/reports/index.html), click Getting Started to display the Getting Started with Oracle Reports home page. In the list of topic sections on the left, click Index. In the Topic list, choose Building and Developing Reports; in the Collateral Type list, choose Examples, then click Search. In the list of topics that displays, find Tutorial Sample Files and click the Download icon to download a zip file, called tutorial_examples.zip. This zip file contains a text file containing the SQL you will enter, as well as the JSPs you will create in every chapter. Extract this zip file into ORACLE_HOME\examples (for example,
D:\orawin\examples).
Convention Meaning
boldface Boldface type indicates graphical user interface elements associated with an action, or terms defined in text or the glossary.
italic Italic type indicates book titles, emphasis, or placeholder variables for which you supply particular values.
monospace Monospace type indicates commands within a paragraph, URLs, code in examples, text that appears on the screen, or text that you enter.
monospce italic Monospace italic type indicates variables or user-supplied names.
vii
Sample Schema
This tutorial relies on the data contained in the Human Resources section of the sample schema. This sample schema is provided with the Oracledatabase.
Viewing Web Reports
To produce the Web-based report, you must have a Web browser installed on your computer. The minimum and recommended requirements are:
■ Microsoft Internet Explorer 4.x or higher
or
■ Netscape Communicator 4.x or higher
Viewing the Web Source
Tutorial Overview 1-1
1
Tutorial Overview
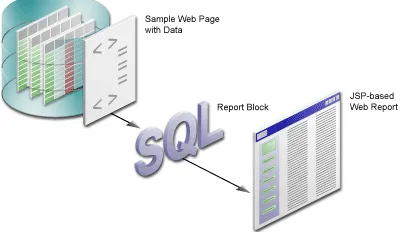
In this tutorial, it is assumed that you are a developer for a company called My Company. You have been asked to publish some content on the company intranet. Human resource managers for each branch should be able to view this content from any location. You must use the company’s template (which is an HTML file) to make the data look good on the Web. At the same time, managers must be able to print out a paper version of the report.
In this tutorial, you will build a report for the Web using JavaServer Pages (JSP) that displays the required information about employee salaries in each department. You will also create a graph so that managers can see an overview of the data. At the end of the tutorial, you will learn to generate a paper report based on the same data model.
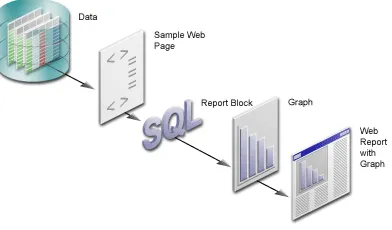
Figure 1–1 shows an overview of the first part of the tutorial.
Figure 1–1 Tutorial Overview: Creating the Web Report
1.1 Tutorial Scenario
In the chapters of this tutorial:
Tutorial Scenario
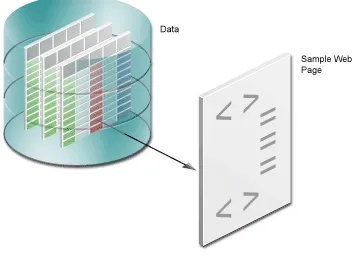
Figure 1–2 Adding Data to an HTML Page
2. In Chapter 3, "Reviewing the Source Code of the Web Report", you will review the resulting report to analyze what the steps you completed in Chapter 2, "Adding Data to a Report" did to the sample Web page to help you understand what Reports Builder did to the sample Web page. You can compare the sample Web page we have provided with the resulting JSP-based Web page. Here, you will be able to examine how the data model looks in Reports Builder, and how it looks in XML.
3. In Chapter 5, "Creating a Report Block for the Web Report", you will use the Report wizard to add a report block to the JSP and generate a simple JSP-based Web report to your Web browser.
Figure 1–3 Creating a Report Block for your JSP-based Web Report
4. In Chapter 4, "Reviewing the Source Code for the Report Block", you will analyze the Web source of your report to review how the report block was inserted into your JSP-based Web report. Again, you will examine the XML code to see how the source code has changed.
Summary
Tutorial Overview 1-3
Figure 1–4 Adding a Graph to a JSP-based Web Report
6. In Chapter 7, "Reviewing the Source Code for the Graph", you will review the new code that Reports Builder added to your Web source to produce the graph.
7. In Chapter 8, "Generating a Paper Report", you will generate a paper report based on the same data model and layout that you created for the JSP-based Web report.
Figure 1–5 Generating a Paper Report from a JSP-based Web Report Data Model
1.2 Summary
Adding Data to a Report 2-1
2
Adding Data to a Report
Estimated completion time: 15 minutes
Consider the scenario where you have to create a Web report for your company’s human resources managers. This Web report must display salary information about each employee in a department. You already have an HTML page that matches the company’s logo and colors. You need to add the necessary information to this page. This chapter shows you how to use the Data Wizard in Reports Builder to add data to an existing HTML page as depicted in Figure 2–1. At the end of the chapter, you will have created a data model to make data available for use in a Web report.
Figure 2–1 Adding Data to an HTML Page
2.1 Opening the Web Page
The steps in this section show you how to open the Web page template we have provided, called emprev.htm. First, you will open the Web page in your Web browser so that you can see what our template looks like.
To open the sample HTML page in your Web browser
■ In your Web browser (for example, Netscape or Internet Explorer), choose File >
Open, and navigate to emprev.htm. The emprev.htm file is the sample file that we have provided in this Tutorial.
Using the Data Wizard to Add Data to a Sample Web Page
To open an existing HTML page in Reports Builder
1. Open Reports Builder.2. In the Welcome dialog box, click Open an existing report, then click OK.
3. In the Open dialog box, navigate to the folder where the tutorial sample files are located. For example, d:\Reports_Tutorial.
4. Find the emprev.htm file and click Open.
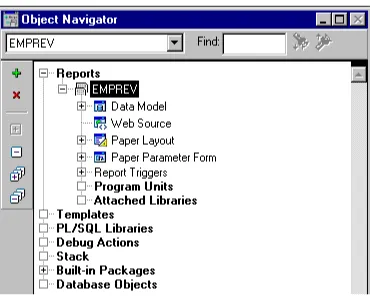
The EMPREV report is displayed in the Object Navigator.
Figure 2–2 Object Navigator Displaying an Existing HTML Page
2.2 Using the Data Wizard to Add Data to a Sample Web Page
When building a report, you must first build a data model by selecting the data that you want to use in the report.
The steps in this section describe the procedure to use the Data Wizard to build a data model for your Web report. This data model makes the data from the sample schema available to use in your report.
To add data to an existing HTML page
1. Open the Data Wizard to define a layout and add a data model.
a. In the Object Navigator, double-click the Data Model node.
b. In the Data Model view, right-click the canvas, then choose Data Wizard from the pop-up menu.
2. If the Welcome page displays, click Next.
3. On the Query name page, click Next to accept the default name.
4. On the Data Source page, make sure SQL Query is selected, then click Next.
Note: If you are using UNIX, navigate to the directory where Reports Builder is installed, and then execute runbuilder.sh.
Note: On the Data Source page, you can choose any data source you wish to use in your report. For more information about using
Using the Data Wizard to Add Data to a Sample Web Page
Adding Data to a Report 2-3 5. On the Data page, you can do either of the following:
■ Open the tutorial_sql.txt file in a text editor, copy the query, and
paste it into the SQL Statement box. Then, proceed to Step 16.
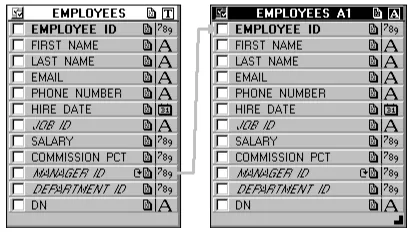
■ Learn to use the Query Builder. To do this, follow steps 6 to 15. 6. To use the Query Builder, click Query Builder.
7. In the Query Builder, double-click the EMPLOYEES table.
8. Double-click the EMPLOYEES table again, then click Close.
Figure 2–3 Employees Tables Displayed in the Query Builder
The EMPLOYEES table displays in the Query Builder as EMPLOYEES and EMPLOYEES A1. The link between MANAGER ID in EMPLOYEES and EMPLOYEE ID in EMPLOYEES A1 is automatically created because of the constraints that exist in the EMPLOYEES table.
9. In the EMPLOYEES table, select the check boxes for the following fields (you must
select the fields in the following order):
■ EMPLOYEE_ID
10. In the EMPLOYEES A1 table, select the check boxes for the following fields:
■ EMPLOYEE_ID
Note: If you do not know the connection information for the database that contains the sample schema we have provided, contact your administrator.
Using the Data Wizard to Add Data to a Sample Web Page
■ FIRST_NAME ■ LAST_NAME 11. Click OK.
12. The query that Query Builder generates is displayed in the SQL Query Statement
text box, and should look like the following: SELECT ALL EMPLOYEES.EMPLOYEE_ID
13. To restrict the retrieved data to only the employees in Department 100, add an AND clause, so that your query looks like this (new code is in bold text): SELECT ALL EMPLOYEES.EMPLOYEE_ID
, EMPLOYEES_A1.FIRST_NAME, EMPLOYEES_A1.LAST_NAME FROM EMPLOYEES, EMPLOYEES EMPLOYEES_A1
WHERE (EMPLOYEES.MANAGER_ID = EMPLOYEES_A1.EMPLOYEE_ID)
AND EMPLOYEES.DEPARTMENT_ID=100
14. Let us make the report look more organized by displaying the employee names with their last names first.
Concatenate the EMPLOYEES.FIRST_NAME and EMPLOYEES.LAST_NAME fields into an alias called emp_name.
The line of the query should now look like this:
, EMPLOYEES.LAST_NAME ||', '|| EMPLOYEES.FIRST_NAME emp_name
15. Concatenate the EMPLOYEES_A1.FIRST_NAME and EMPLOYEES_A1.LAST_ NAME fields into an alias called mgr_name.
The line of the query should now look like this:
, EMPLOYEES_A1.LAST_NAME ||’, '|| EMPLOYEES_A1.FIRST_NAME mgr_name
16. Verify that your query is correct. The entire query should now look like this: SELECT ALL EMPLOYEES.EMPLOYEE_ID,
Saving your Report as a JSP File
Adding Data to a Report 2-5 17. Click Next.
18. Now that we have selected the raw data, let us organize this data into groups by department manager name.
On the Groups page, in the left column, click the MGR_NAME field, click the right arrow to move the field to the Group Fields list, then click Next.
19. Now, let us calculate some of our data. The Totals page displays some of the commonly-used calculations.
On the Totals page, in the left column, click SALARY, then click Sum to display the sum of the Salary column in the Totals list.
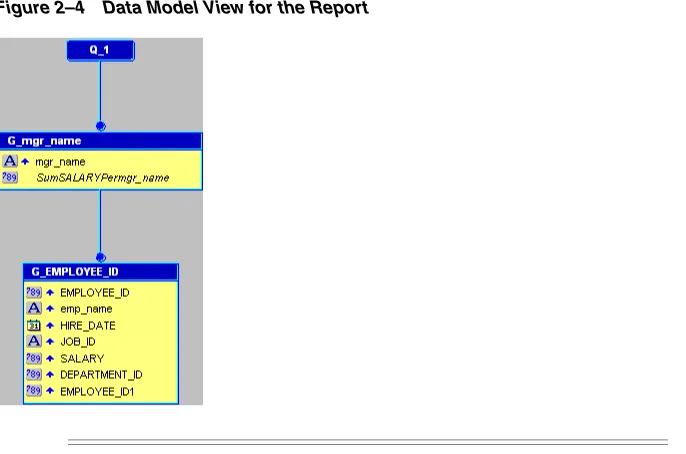
20. Click Finish.
Figure 2–4 Data Model View for the Report
2.3 Saving your Report as a JSP File
In Reports Builder, you can save your report using several formats. Since we are creating a JSP-based Web report, we will save our report in the JSP format.
To save your report as a JSP
1. Select your report in the Object Navigator, then choose File >Save As.
2. In the Save dialog box, change the report name to emprev_your initials, change the type to Reports JSP (.jsp), and then click Save.
Note: If you are not sure whether your query is correct, open the
tutorial_sql.txt file from the example files we provided to you.
Summary
3. Choose File >Close.
2.4 Summary
Congratulations! You have now created a data model that lets you include a report on your Web page. You now know how to:
■ Open an existing Web page (HTML file) in Reports Builder ■ Use the Data Wizard to specify data for a report
■ Use the Query Builder to select data ■ Save your report as a JavaServer Page (JSP)
To review your work, continue to Chapter 3, "Reviewing the Source Code of the Web Report". Otherwise, skip to Chapter 5, "Creating a Report Block for the Web Report" to continue building your report.
Reviewing the Source Code of the Web Report 3-1
3
Reviewing the Source Code of the Web
Report
Estimated completion time: 5 minutes
In Chapter 2, "Adding Data to a Report", you added a data model to your Web page. Here, we show the relationship between the entries you made in the wizard and the data model you created, as well as the JSP and XML code.
You will also examine the custom JSP tags that Reports Builder inserted into your JSP. These custom JSP tags enable Oracle Reports to add the data you have chosen in the Data Wizard to the JSP-based Web report.
3.1 Viewing the Web Source in Reports Builder
To view the Web source of your report in Reports Builder
1. Make sure the report emprev_your initials.jsp is open in Reports Builder.
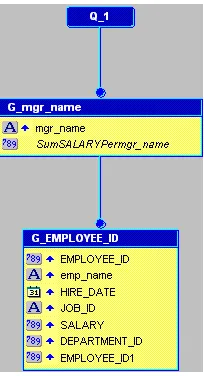
2. In the Object Navigator, double-click the Data Model node to display the data model for this report. Your data model should look like this:
Figure 3–1 Data Model View for the Report
Verifying Your JSP Code
The source code displays in the Web Source view. Scroll through the code and note the following items:
■ The @ taglib line references the reports JSP library for all tags starting with rw. The <%...%> tags mark JSP-relevant tags, and point to the JSP Custom Tag Library.
■ Notice the opening rw:report tag and the opening and closing rw:objects
tags.
■ The rw:report tag appears after the library call. In a report, all Reports
Builder JSP tags must appear between an opening and closing rw:report
tag. If the closing rw:report tag comes before the data is used, the report will be empty.
■ The rw:objects tags appear in the Web Source. Note that you do not see
any text between the opening and closing tags. When you save the report to your file system, Reports Builder encodes the data model and other elements in a language called XML, and places the data model between these tags. Reports Builder hides the XML code between these tags to maintain XML integrity.
3.2 Verifying Your JSP Code
If you have gone through this chapter and are still not sure whether your JSP is correct, open the emprev.jsp file. This file is located in the tutorial examples directory you created.
3.3 Summary
Congratulations! You have finished reviewing the data you added to your Web report in Chapter 2, "Adding Data to a Report". You now know how to view the source code in the Reports Builder Web Source view and have learned about these Oracle Reports custom JSP tags:
■ rw:report
■ rw:object
Continue to Chapter 5, "Creating a Report Block for the Web Report" to add a report block and finish your Web report.
For more information on Oracle Reports JSP tags, see the Oracle Reports online Help.
Note: You can also double-click the Web Source icon under the report name in the Object Navigator.
Note: Unless you are comfortable using XML and JSPs, it is recommended that you do not type anything between the
Reviewing the Source Code for the Report Block 4-1
4
Reviewing the Source Code for the Report
Block
Estimated completion time: 5 minutes
In Chapter 5, "Creating a Report Block for the Web Report", you added a report block to a JSP-based Web report. This chapter reviews the source code added for the report block.
4.1 Viewing the Web Source in Reports Builder
To view the Web source
■ Open the Web source for the emprev_your initials.jsp report you created
in Chapter 5, "Creating a Report Block for the Web Report" by double-clicking the
Web Source node in the Object Navigator.
4.1.1 Reviewing the Header Tag and Body
1. In the Web Source view, locate the<!-- Header --> line.
This HTML code indicates a comment line that helps you locate the report heading information in the file.
2. Locate the <th> and <tr> tags, which should look something like this: <tr>
<th <rw:id id="HBEMPLOYEEID92" asArray="no" /> class="OraColumnHeader">Employee Id </th>
<th <rw:id id="HBempname92" asArray="no" /> class="OraColumnHeader"> Emp Name </th>
...
4.1.2 Reviewing the rw:foreach Tag and Body
The rw:foreach tag loops across a group. The layout is repeated for each instance of the specified group.
1. In the Web Source view, locate the <rw:foreach> JSP tag and find this line: <rw:foreach id="R_G_EMPLOYEE_ID921" src="G_EMPLOYEE_ID">
Here, R_G_EMPLOYEEID is a unique identifier for this loop and G_EMPLOYEE_ID
is the data model group on which the loop repeats.
2. Notice that the </tbody> tag that closes the table follows the closing
Verifying Your JSP Code
<td <rw:headers id=HFDEPARTMENTID92" src...> </tr>
</rw:foreach> </tbody>
4.2 Verifying Your JSP Code
If you have gone through this chapter and are still not sure whether your JSP is correct, open the file we have provided, called empreva.jsp. This file is located in your examples directory.
4.3 Summary
Congratulations! You have finished reviewing the source code for the report block you added in Chapter 5, "Creating a Report Block for the Web Report". Continue to
Creating a Report Block for the Web Report 5-1
5
Creating a Report Block for the Web Report
Estimated completion time: 15 minutes
Now that you have created your data set, you need to format the data into your report, and thus provide managers with current information about their employees. To do so, you can create a report block and add it to your report. This report block pulls in the data dynamically using the query you specified in Chapter 1 every time you run the report, and format the data in your report.
The steps in this chapter describe the procedure to add a report block to your Web page as shown in Figure 5–1.
Figure 5–1 Creating a Report Block for your JSP-based Web Report
5.1 Adding a Report Block to Your Web Page
If you have performed the steps in Chapter 3, "Reviewing the Source Code of the Web Report", you should already have the source open in Reports Builder. In this case, you can skip Step 1. The steps in this section show you how to use the Report Wizard to format the data you specified in Chapter 1, and dynamically pull in the data into your report.
To add a report block
1. Make sure your report (emprev_your initials.jsp) is open in Reports Builder.
Note: If you did not create emprev_your initials.jsp in
Adding a Report Block to Your Web Page
2. In the Object Navigator, double-click the Web Source node under emprev_your initials.
3. In the Web Source view, choose Edit >Find and Replace to find and delete the following text. Note that this text occurs in two places.
Replace this text with the Report block in Chapter 4 of the tutorial.
4. Ensure that your cursor is in the location where you deleted the text, and choose
Insert >Report Block to display the Report Wizard.
Figure 5–2 Inserting the Report Block into your Web Source
5. On the first page of the wizard, title your report My Team’s Salaries.
6. Select the Group Above radio button, then click Next.
7. Format the data so that the employee names list in a downward column, as follows:
On the Groups page, click G_EMPLOYEE_ID, and thenclick Down to move the group to the Displayed Groups list.
8. Click Next.
9. On the Fields page, click the double arrows (>>) to move all Available Fields to the Displayed Fields list.
10. In the Displayed Fields list, click EMPLOYEE_ID1, then click the left arrow (<) to move the field back to the Available Fields list, and then click Next.
11. On the Labels page, click Next.
Note: If you did not select the fields in the correct order in
Summary
Creating a Report Block for the Web Report 5-3 13. Make sure the Beige template is selected, then click Finish.
The Report Wizard has now generated the HTML with custom JSP tags to display your formatted data on the Web page.
14. Choose File >Save As.
15. In the Save dialog box, change the name to emprev_your initials.jsp, and click Save.
16. Click the Run Web Layout button in the toolbar to run and view your report in your Web browser.
Your report should look something like this:
Figure 5–3 JSP-based Web Report with Report Block
5.2 Summary
Congratulations! You have added a report block to a Web report. You now know how to:
■ Create a report block
■ Add a report block to an HTML page for a JSP-based Web report
To review your results, continue on to Chapter 4, "Reviewing the Source Code for the Report Block". Otherwise, skip to Chapter 6, "Creating a Graph for the Web Report" to add a graph to your report.
Note: If Netscape 7.0 is your default browser, and the browser does not display, set the registry key HKEY_CURRENT_
USERS\Software\Oracle\Toolkit\Tkbrowser to the default browser location. Ensure that the BrowserName and the
BrowserPath keys reflect the correct values. For example:
BrowserName=Netscape 7; BrowserPath=C:\Program Files\Netscape\Netscape\Netscp.exe.
Creating a Graph for the Web Report 6-1
6
Creating a Graph for the Web Report
Estimated completion time: 15 minutes
This chapter describes how to use the Graph Wizard to create a graph that enables managers to view the salaries of the employees, and where each employee’s compensation rate falls within a specific department, as shown in Figure 6–1.
If you already know how to use the Graph Wizard, refer to Appendix A.3, "Entries for the Graph Wizard"for a quick reference guide.
Figure 6–1 Adding a Graph to a JSP-based Web Report
6.1 Opening the Source for the Report in Reports Builder
To open the Web source in Reports Builder
1. In the Object Navigator, make sure that the emprev_your initials.jsp file is open.
2. In the Object Navigator, under the report name, double-click the Web Source icon to display the source code in the Web Source view.
3. In the Web Source view, choose Edit >Find and Replace to find and delete the following text:
Replace this text with the Graph in Chapter 6 of the Tutorial.
Creating a Graph Using the Graph Wizard
6.2 Creating a Graph Using the Graph Wizard
In this section, you will use the Graph Wizard to insert the JSP and XML code for the graph into the Web page for your Web report. The steps show you how to choose the type of graph you want, and the definitions of the X and Y axes. Note that you will base the graph on the query you created in Section 2.2, "Using the Data Wizard to Add Data to a Sample Web Page".
If you already know how to use the Graph Wizard, refer to Appendix A, "Quick Reference Guide" for the entries in the Graph Wizard.
To create a graph
1. Make sure your cursor is where you deleted the text, and choose Insert >Graph to display the Graph Wizard.
Figure 6–2 Inserting a Graph into your Web Source
2. If the Welcome page displays, click Next.
3. On the next page of the Graph Wizard, you can choose from a variety of graph styles. For our simple report, let us choose a Bar graph.
In the Graph Wizard, ensure that the default graph type (Bar) is selected, then click Next.
4. Move EMPLOYEE_ID to the X-Axis Categories list, then click Next.
5. Move SALARY to the Y-Axis Data list, then click Next.
6. On the Layout page, click and drag the EMPLOYEE_ID field from the Groups field to the Bars field, then click Next.
7. On the Graph Titles page, select Show Title, and in the first field, type
Employees by Salary, then click Next.
8. Ensure that Show Legend is selected.
9. From the Location list, choose Right, then click Next.
10. In the Show X-Axis title field, type Employees, then click Next.
Creating a Graph Using the Graph Wizard
Creating a Graph for the Web Report 6-3 11. In the Show Y1-Axis title field, type Salaries, then click Next.
12. At the bottom of the page in the Graph Wizard, click Row 1 Color and choose a different color, for example dark pink.
Choose other colors for the other rows, if required.
13. Click Finish.
14. Click the Run Web Layout button in the toolbar to preview the report in your Web browser.
The report should look like Figure 6–3.
Note: If you click Next instead of Finish, you will notice that there is another page in the Graph Wizard where you can add hyperlinks to your graph. Since we are not using graph hyperlinks in this tutorial, you can click Finish. If you would like to learn more about using the Graph Wizard and graph hyperlinks, visit Getting Started withOracle Reports and navigate to the Examples page. Here, you can view an example on using graph hyperlinks.
Note: If Netscape 7.0 is your default browser, and the browser does not display, set the registry key HKEY_CURRENT_
USERS\Software\Oracle\Toolkit\Tkbrowser to the default browser location. Ensure that the BrowserName and the
BrowserPath keys reflect the correct values. For example:
Saving Your Report with the New Graph
Figure 6–3 JSP-based Web Report with Graph
6.3 Saving Your Report with the New Graph
Saving your report with a different filename enables you to compare your results with the results that we have provided with the tutorial. This way, you can also roll back to the results of a previous chapter, if necessary.
1. Choose File >Save As.
2. In the Save dialog box, change the name to emprevb_your initials.jsp and click Save.
6.4 Summary
Congratulations! You have added a graph to a JSP-based Web report. You now know how to use the Graph Wizard to design and add a graph to a Web report.
To review your results, continue to Chapter 7, "Reviewing the Source Code for the Graph".
Reviewing the Source Code for the Graph 7-1
7
Reviewing the Source Code for the Graph
Estimated completion time: 5 minutes
In Chapter 6, "Creating a Graph for the Web Report", you added a graph to a JSP-based Web report. This chapter reviews the source code added for the graph.
7.1 Viewing the Source in Reports Builder
Open the Web Source view for the report you created in Chapter 6, "Creating a Graph
for the Web Report" called emprevb_your initials.jsp.
7.2 Reviewing the rw:graph Tag
The rw:graph tag brackets the graph information and links the graph to the data source. It also identifies the categories and the data fields.
1. In the Web Source view, locate the <rw:graph> JSP tag. The code within the rw:graph tag is XML.
<rw:graph id="graph" src="G_EMPLOYEE_ID" series="EMPLOYEE_ID" dataValues="SALARY">
The series tag defines the source for the values along the X-axis, and the
dataValues tag defines the source for the data along the Y-axis. You defined these parameters in Chapter 6, "Creating a Graph for the Web Report".
2. Locate the SeriesItems tag below the rw:graph tag: <SeriesItems>
<Series id="0" color="#cc66cc"/> </SeriesItems>
This tag represents the modification to the Row 1 color we made in Chapter 6, "Creating a Graph for the Web Report". If you chose a different color, you will see a different value for the color tag.
Reviewing the rw:graph Tag
Figure 7–1 Graph with Color on the First Row
4. Find the <Title> tag, located here: </SeriesItems>
<Title visible="true" text="Employees by Salary"/>
This tag adds the graph title to your Web report, shown here:
Figure 7–2 Graph with Title
5. Find the </rw:graph> JSP tag, located here: </Graph>
-->
</rw:graph></p> <p></p> ...
Summary
Reviewing the Source Code for the Graph 7-3
7.3 Summary
Congratulations! You have finished reviewing the source code for your new graph. For more information on creating Web reports, adding report blocks and data, and creating graphs, see the Oracle Reports online Help.
Note: The Graph Wizard is re-entrant. So, if you want to modify your graph, move your cursor into the XML between the rw:graph
Generating a Paper Report 8-1
8
Generating a Paper Report
Estimated Completion Time: 15 minutes
This chapter describes how to create a paper version of the Web report you created, as shown in Figure 8–1. Here, you will use the Report Wizard to create a paper layout using the data model you created in Chapter 2, "Adding Data to a Report".
If you already know how to use the Report Wizard, refer to Appendix A.4, "Entries for the Report Wizard"for a quick reference guide.
Figure 8–1 Generating a Paper Report from a JSP-based Web Report Data Model
8.1 Generate a Paper Report Based on Your Data Model
In this section, you will learn to generate a paper layout based on the data model you created in Chapter 2, "Adding Data to a Report".
To generate a paper report using the Report Wizard
1. In the Object Navigator, ensure that the report you created in Chapter 6, "Creating
a Graph for the Web Report" called emprevb_your initials.jsp is open.
Generate a Paper Report Based on Your Data Model
2. In the Object Navigator, right-click the report name.
3. From the pop-up menu, choose Report Wizard.
4. Let us choose the Paper Layout since we are generating a paper report. We do not need to select a Web Layout since we have already done that in Chapter 3, "Reviewing the Source Code of the Web Report".
In the Report Wizard, on the Report Type page, select Create Paper Layout only.
5. On the Style page, ensure that Group Above is selected, and that the title is My Team’s Salaries.
6. Click the Data tab.
The data model you created in Chapter 2, "Adding Data to a Report" must display in the SQL Query Statement field.
7. On the Fields page, move all the fields back to the Available Fields list, then move the following fields to the Displayed Fields list by selecting the field, then clicking
>.
■ emp_name ■ mgr_name ■ SALARY
■ SumSALARYPermgr_name
8. On the Labels page, in the Label field for the emp_name field, type Employee Name.
9. In the Label field for themgr_name field, type Manager Name.
10. In the Label field for the SumSALARYPermgr_name field, type Total Salary.
11. On the Templates page, ensure that the Beige template is selected.
12. Click Finish.
The report displays in the Paper Design view, and must look something like this:
Figure 8–2 Final Paper Report
Modifying a Report in the Paper Design View
Generating a Paper Report 8-3 13. Choose File >Save As.
14. Change the name to emprev_paper_your initials.rdf, and ensure that rdf
is selected.
15. Click Save.
8.2 Modifying a Report in the Paper Design View
Reports Builder provides you with numerous tools that you can use in the Paper Design view to modify the look and feel of your report. Because you are editing live data, you can see how the end result of your report will appear. This section describes how to enhance your report using some of the most commonly used formats:
■ Aligning columns ■ Inserting current data and time
To modify the appearance of your report in the Paper Design view
1. In the Paper Design view, click Flex Off in the toolbar.2. Align the title with the logo.
Click the My Team’s Salaries report title and drag it 1.5 inches to the left, and 0.25 inches down.
3. While the object is selected, click Format, click Font, and then choose Arial, Bold,
12pt to format the text.
4. Your report title should now look like this:
Figure 8–3 Formatted Title of the Paper Report
5. Click the number column beneath the Salary label. All the number values are selected.
6. In the toolbar, click Currency, click Commas, then click Add Decimal Place twice.
7. While the number values are selected, click Align Right in the toolbar.
8. The Salary column should now look like this:
Summary
Figure 8–4 Formatted Numbers in the Salary Column
9. Since the salary numbers are aligned to the right, now align the Salary label to the right.
To do so, click the Salary label, then click Align Right in the toolbar.
10. Now, format the Total Salary numbers in the same way you formatted the Salary numbers.
11. Add a space between the Manager label and the manager’s name. To do so, click a manager’s name (for example, Greenberg,Nancy). While the object is selected, use the right arrow on your keyboard to move the field to the right.
Your report should now look something like this:
Figure 8–5 Final Formatted Paper Report
8.3 Summary
Congratulations! You have now generated a paper report based on the data model you created for a JSP-based Web report. You now know how to:
■ Open the Report Wizard for an existing JSP-based Web report ■ Create a paper layout for your report
■ Produce a paper version of your Web report ■ Format a paper report to make it more readable
A
Quick Reference Guide A-1
A
Quick Reference Guide
This appendix contains tables that describe the entries you make into each wizard in Reports Builder. These tables are meant to be a quick reference guide for you to use later, or for you to use if you are familiar with the wizards in Reports Builder.
A.1 Entries for the Data Wizard
Table A–1 lists the entries you made in the Data Wizard in Chapter 2, "Adding Data to a Report".
A.2 Entries for the Report Block
Table A–2 lists the entries for the report block in Chapter 5, "Creating a Report Block for the Web Report".
Table A–1 Data Wizard Input
Data Wizard
Page Field Input
Query Name Employee Salaries
Data Source SQL Query
Data Query Statement Paste in SQL from:
<example files>/tutorial_sql.txt.
Connect Obtain the connection string from your DBA
Group Group Fields MGR_NAME
Totals Total Fields Sum(SALARY)
Table A–2 Report Wizard Input for the Report Block
Report Block
Wizard Page Field Input
Title Title Direct Reports by Manager
Type Group Above Select
Groups Available Groups G_EMPLOYEE_ID, DOWN
Displayed Fields Available Fields All fields (move all fields to Displayed)
Totals None
Entries for the Graph Wizard
A.3 Entries for the Graph Wizard
Table A–3 lists the entries you made to the Graph Wizard in Chapter 6, "Creating a Graph for the Web Report".
A.4 Entries for the Report Wizard
Table A–4 lists the entries for the Report Wizard in Chapter 8, "Generating a Paper Report".
A.5 Reference Material
You create a reference-type chapter or appendix by using the following elements inside the RefEntry element within a chapter or appendix template file.
■ RefSect1
Table A–3 Graph Wizard Input
Graph Wizard
Page Field Input
Type Type Bar
X-Axis -Category Available Columns Move EMPLOYEE_ID and MGR_ NAME to X-Axis Categories
Y-Axis - Data Available Columns Move SALARY to Y-Axis Data
Layout Groups field Drag EMPLOYEE_ID from the Groups field to the Bars field.
Title Show Title Select Show Title and type Salary Comparison
Legend Show Legend Select
X-Axis Show X-Axis Title Select Show X-Axis Title and type
Employees
Y-Axis Show Y-Axis Title Select Show Y-Axis Title and type
Salaries
Plot Area Options Row 1 Color Select a different color
Table A–4 Report Wizard Input for the Paper Report
Report Wizard
Page Field Input
Layout Create Paper Layout Only Select
Type Group Above Select
Groups Available Groups (Do not change)
Displayed Fields Available Fields emp_name mgr_name
SumSALARYPermgr_name SALARY
Totals (Do not change)
Labels All labels Change labels to be meaningful.
Reference Material
Quick Reference Guide A-3 ■ RefSect2
■ RefSect3 ■ RefSect4 ■ RefSubSect
You can include Sectn elements at the beginning of a chapter or appendix that contains reference information. However, once you insert a RefEntry, you can no longer insert Sectn elements. Therefore, place all narrative or tutorial-type text at the beginning of a chapter or appendix, before reference information.
B
Tool Palette and Toolbar Reference B-1
B
Tool Palette and Toolbar Reference
This appendix contains descriptions of the buttons and tools in the Reports Builder tool palettes and toolbars.
B.1 Main Toolbar
The main toolbar is located at the top of the Reports Builder window, directly beneath the menu bar:
Figure B–1 Main Toolbar
New button. Displays the New Report dialog box.
Open button. Displays the Open dialog box.
Save button. Saves the report. If you haven’t saved the report before, the Save As dialog box displays.
Print button. Prints the paper report.
Mail button. Displays the Mail dialog box.
Connect button. Displays the Connect dialog box.
Data Model View Tool Palette
Copy button. Temporarily places a copy of the selected item in the clipboard. Click the
Paste button to paste the selected item.
Paste button. Pastes the item in the clipboard in current location of the cursor.
Undo button. Undoes the last action performed.
Redo button. Performs the last action again.
Run Web Layout button. Runs the current report to your Web browser.
Run Paper Layout button. Runs the current report to the Paper Design view in Reports Builder.
Help button. Displays the Oracle Reports online Help.
B.2 Data Model View Tool Palette
The Data Model view tool palette is a vertical group of tools located on the left-hand side of the Data Model view.
Select tool. Deselects any selected tool to turn off the current tool.
Magnify tool. Zooms in the view on the clicked object. Use SHIFT + Magnify to zoom out.
Summary Column tool. Creates a summary column in the query.
Paper Layout View Tool Palette
Tool Palette and Toolbar Reference B-3
Formula Column tool. Creates a formula column in the query.
Cross Product tool. Creates a matrix (cross-product) group.
Placeholder tool. Creates a placeholder column which you can modify later.
SQL Query tool. Displays the SQL Query Statement dialog box where you can enter a SQL query SELECT statement or use Query Builder to create a query.
Ref Cursor tool. Displays the PL/SQL Editor where you can type a ref cursor query.
XML Query tool. Displays the Define XML Query dialog box, where you can specify the XML data definition and data source.
JDBC Query tool. Displays the JDBC Query dialog box, where you can define the SQL or stored procedure to define the data for the query.
Text Query tool. Displays the Text Query dialog box, where you can specify a text data definition and data source.
Express Server Query tool. Displays the Express Server Query dialog box, where you can specify an Oracle Express data definition and data source.
B.3 Paper Layout View Tool Palette
The Paper Layout view tool palette is a vertical group of tools located on the left-hand side of the Paper Layout view.
Paper Layout View Tool Palette
Magnify tool. Zooms in the view on the clicked object. Use SHIFT + Magnify to zoom out.
Frame Select tool. Selects all objects within the selected frame or repeating frame, depending upon their explicit anchors (first click the tool, then the frame).
Reshape tool. Enables you to reshape the selected boilerplate object.
Text tool. Creates a boilerplate text object.
Rotate tool. Enables you to rotate the direction of the selected boilerplate object.
Line tool. Draws a line boilerplate object.
Rectangle tool. Draws a rectangle boilerplate object.
Arc tool. Draws an arc boilerplate image.
Rounded Rectangle tool. Draws a rounded rectangle boilerplate object.
Polyline tool. Draws an open multilined boilerplate object. Use your mouse to create the multiple lines.
Polygon tool. Draws a multisided boilerplate object. The object must be closed, unlike a polyline object.
Freehand tool. Draws a line where you drag your mouse.
Paper Layout View Tool Palette
Tool Palette and Toolbar Reference B-5
Repeating Frame tool. Draws a repeating frame.
Graph tool. Displays the Graph Wizard so that you can to define a graph that will be inserted into your layout.
Field tool. Creates a field object.
Anchor tool. Creates an anchor between two objects in your layout.
File Link tool. Creates a link file object that you can use to link an external file to your report.
Glossary i
Glossary
AFM
Acronym for Adobe Font Metrics. AFM and PPD files are supplied by Adobe and by printer vendors. These files contain information about the printer. Along with other parameters, these files are read for the information about the available fonts for the printer, which Oracle Reports will use. For all the fonts listed in the PPD file, Oracle Reports searches for the corresponding AFM file according to the font name and loads all of the fonts for which there is an available AFM.
CGI
Acronym for Common Gateway Interface. A standard for transferring information between a Web server and a CGI program. CGI specifies how to pass arguments to the program as part of the HTTP request, and defines a set of environment variables that are made available to the program. The program then generates output to pass back to the browser. CGI provides server-side processing to allow Web servers to interact dynamically with users.
column
1. A vertical space in a database table that represents a particular domain of data. A column has a column name (for example, ENAME) and a specific datatype (for example, CHAR). For example, in a table of employee information, all of the employees' names would constitute one column. A record group column represents a database column.
2. A data model object created automatically for each column expression in a query's SELECT list, or created manually to perform summaries, formulas, or act as a placeholder.
3. The representation of an attribute of an entity.
data model
A relational model that defines what data should be fetched from the data source(s), what values should be computed, and how data should be ordered in a report. Reports Builder objects that define the data model are queries, groups, columns, parameters, and links.
Data Model view
One of the views of the Report Editor that displays a structural representation of the data in a report. The objects do not appear in the report output, but the structure determines the layout style, and the data objects provide the values that appear in the layout objects.
database
1. A set of dictionary tables and user tables that are treated as a unit.
data source
data source
A source for data returned by a query, including database objects such as tables, views, synonyms, snapshots, and queries stored as views. Oracle Reports Services
enables you to access any data source.
The new pluggable data source (PDS) architecture replaces Oracle Open Client Adapter (OCA), and the Open Database Connectivity (ODBC) drivers are no longer supported in Oracle Reports 10g. However, Java Database Connectivity (JDBC) is one of the pluggable data sources available that can utilize the JDBC-ODBC bridge, allowing access to other data sources.
detail query
When defining a master/detail report, the detail query retrieves all related records for each record retrieved by the master, or parent, query.
dialog box
A partial screen or window that prompts you to enter information necessary to complete an operation.
disabled
An interface element state that means a menu item, button, and so on, cannot be used in the current context (that is, it does not respond to keyboard or mouse input).
editor
Seeview.
enabled
An interface element state that means that a menu item, button, and so on, can be used in the current context (that is, it responds to keyboard or cursor/mouse input).
field
1. An interface element in which you enter, edit, or delete data.
2. A layout object that defines how the data for a specific query column appears.
foreign key
A value or column in one table that refers to a primary key in another table.
format mask
A setting that defines the appearance of the value of a field. For example, a format mask is used to specify the display of currency amounts and dates.
format trigger
A PL/SQL function that enables you to dynamically change the formatting attributes of an object.
formula column
A user-created column that gets its data from a PL/SQL function or expression, a SQL statement, or a combination of these.
frame
JAR
Glossary iii group
1. In Reports Builder, a data model object that is created automatically to contain all the columns selected by a query, or created by the user to modify the hierarchy of the data appearing in a report; it is used primarily for creating breaks in a report, as well as for resetting computations.
2. An object that is composed of several other objects.
HTML
Acronym for HyperText Markup Language. A tag-based ASCII language used to specify the content and links to other documents on Web servers on the Internet. End users with Web browsers view HTML documents and follow links to display other documents.
HTTP
Acronym for HyperText Transfer Protocol. The protocol used to carry Web traffic between a Web browser computer and the Web server being accessed.
hyperlink
A reference (link) from some point in one document to (some point in) another document or another place in the same document. A Web browser usually displays a hyperlink in some distinguishing way (in a different color, font or style). When users activate hyperlinks (by clicking on them with a mouse) the browser displays the target of the link.
IANA
Acronym for Internet Assigned Numbers Authority. An organization working under the auspices of the Internet Architecture Board (IAB) that is responsible for assigning new Internet-wide IP addresses. IANA-defined character sets refers to those character sets that can be defined for the charset tag and may be used in the Internet.
icon
A graphic representation of a window or tool.
image
A bitmapped object that can be stored and loaded into an application. The client cannot modify an imported image.
intranet
An internal TCP/IP network, access to which is restricted (through a firewall) to individuals inside the company or organization. An intranet provides similar services within an organization to those provided by the Internet, but is not necessarily connected to the Internet. A common example of an intranet is when a company sets up one or more Web servers on an internal network for distribution of information or applications within the company.
Java
A computer language that supports programming for the Internet in the form of platform-independent "servlets" or "applets".
JAR
J2EE
J2EE
Acronym for Java 2 Platform, Enterprise Edition. An environment for developing and deploying enterprise applications in Java consisting of a set of services, application programming interfaces, and protocols that provide for developing multitiered, Web-based applications.
JSP
Acronym for JavaServer Page. JSP technology is an extension to the Java Servlet technology from Sun Microsystems that provides a simple programming vehicle for displaying dynamic content on a Web page. JSP is a server-side technology. A JSP is an HTML page with embedded Java source code that is executed in the Web server. The HTML provides the page layout that is returned to the Web browser, and the Java provides the business logic.
layout
SeePaper Layout view.
margin
An optional report region that appears at the top and bottom of each logical page in a report section (Header, Main, or Trailer). The margin may include any layout object, but typically contains boilerplate and fields (for page numbers, page totals, grand totals, and current date and time).
object
1. An item that can be placed on the layout. The following are examples of objects: rectangle, line, ellipse, arc, polygon, polyline, rounded rectangle, freehand, chart, text, symbol, and text field.
2. In an Oracle database, an instance of an object type. An object can be a row in an object table, or the portion of a row contained in a column object in a relational table.
Object Navigator
A hierarchical browsing and editing interface that enables you to locate and manipulate application objects quickly and easily. Features include:
■ A hierarchy represented by indentation and expandable nodes (top-level nodes
show module types, database objects, and built-in packages), enabling tasks such as creating, editing, renaming, and deleting objects.
■ A find field and icons, enabling forward and backward searches for any level of
node or for an individual item in a node
■ Icons in the horizontal toolbar replicating common File menu functions
Oracle Application Server (OracleAS)
A strategic platform for network application deployment. By moving application logic to application servers and deploying network clients, organizations can realize
substantial savings through reduced complexity, better manageability, and simplified development and deployment. OracleAS provides the only business-critical platform that offers easy database Web publishing and complete legacy integration while transitioning from traditional client/server to network application architectures.
Oracle Developer Suite
PPD
Glossary v
suite provides a complete and highly productive development environment for building applications for Oracle Application Server and the Oracle database.
ORACLE_INSTANCE
An alternate name for the top directory in the Oracle directory hierarchy on some directory-based operating systems. An environment variable that indicates the root directory of Oracle products.
You can refer to the directory specified by ORACLE_INSTANCE in syntax: On UNIX: $ORACLE_INSTANCE
On Windows: %ORACLE_INSTANCE%
Oracle Portal
A browser-based development tool for building scalable, secure, extensible HTML applications and Web sites. Oracle Reports Services uses Oracle Portal to control end user access to reports published on the Web by storing information about report requests, the secured server, and any Oracle Reports Services printer used to print report output.
Oracle Reports Services
SeeReports Services.
Paper Design view
One of the views of the Report Editor that displays output for paper reports and enables you to make many commonly required, simple modifications to the layout, such as spacing, formatting fields, color, and editing text, without having to open the Paper Layout view.
Paper Layout view
One of the views of the Report Editor that displays the layout objects in a paper report and enables you to make many modifications to any layout object. All layout objects have properties that you can modify using the Property Inspector. The hierarchy of the layout objects is determined by the Data Model.
Paper Parameter Form view
Displays the layout of the Parameter Form that, at runtime, allows user input of parameter values in the Runtime Parameter Form.
Acronym for Portable Document Format. A file format (native for Adobe Acrobat) for representing documents in a manner that is independent of the original application software, hardware, and operating system used to create the documents. A PDF file can describe documents containing any combination of text, graphics, and images in a device-independent and resolution independent format.
PL/SQL
Oracle's proprietary extension to the SQL language. Adds procedural and other constructs to SQL that make it suitable for writing applications.
PPD
Property Inspector
the printer, which Oracle Reports will use. For all the fonts listed in the PPD file, Oracle Reports searches for the corresponding AFM file according to the font name and loads all of the fonts for which there is an available AFM.
Property Inspector
A window that enables you to view, locate, and set the properties of the currently selected object(s) in the Object Navigator, Report Editor, and Template Editor. Every Reports Builder object (query, group, frame, parameter, and so on) has associated properties that can be viewed using the Property Inspector. The Property Inspector features:
■ expandable and collapsible nodes ■ in-place property editing
■ search features ■ multiselection
■ complex property dialogs
■ the ability to invoke multiple instances of the Property Inspector
To get help on any property, click the property in the Property Inspector and press F1.
query
A SQL SELECT statement that specifies the data you wish to retrieve from one or more tables or views of a database.
RDF file
A file that contains a single report definition in binary format. .RDF files are used to both run and edit reports.
record
One row fetched by a SQL SELECT statement.
REP file
A file that contains a single report definition in binary format. .REP files are used solely to run reports; you cannot edit a .REP file.
repeating frame
A layout object used to display rows of data that are fetched for a group.
Reports Cache
A component of Oracle Reports Services that stores completed jobs output.
Reports CGI (rwcgi)
An Oracle Reports executable, also known as the Common Gateway Interface (CGI) or Reports Web Cartridge, that translates and delivers information between either a Web Server or a J2EE Container and the Reports Server, to run a report dynamically from your Web browser.
Note: Reports CGI (rwcgi) is deprecated (maintained only for backward compatibility); instead, use Reports JSPs, rwservlet
row
Glossary vii Reports Client (rwclient)
An Oracle Reports executable that provides a command line interface to send a report to a remote Reports Server (rwserver).
Report Editor
The Oracle Reports Builder window that provides different views to help you handle the data objects and layout objects for Web and paper reports. The views are:
■ Data Model view
■ Paper Layout view
■ Paper Design view
■ Paper Parameter Form view
■ Web Source view
Reports Engine
A component of Oracle Reports Services that fetches data from the data source, formats the report, send output to cache, and notifies the Reports Server that the job is ready.
Reports Builder (rwbuilder)
An Oracle Reports executable that provides a design-time user interface to enable report developers to create and maintain report definitions.
Reports Queue Manager (rwrqm)
(Windows only) Maintains timestamp and status information about reports jobs managed by the Reports Server (rwserver).
Reports Runtime (rwrun)
An Oracle Reports executable that runs a report using the Oracle Reports Services in-process Reports Server.
Reports Server (rwserver)
An Oracle Reports executable that provides reporting services to execute, distribute, and publish your reports for enterprise-wide reporting. A component of Oracle Reports Services that processes client requests, including user authentication, scheduling, caching, and report distribution. Use Oracle Reports clients such as
rwservlet, Reports JSP, CGI, and rwclient send a report to Reports Server.
Reports Services
The runtime environment for Reports Developer applications. Oracle Reports Services executes, distributes, and publishes your reports for enterprise wide reporting. Using Oracle Reports Services to deploy your reports results in gains of flexibility, time savings, and processing capacity.
Reports Servlet (rwservlet)
A component of Oracle Reports Services that translates and delivers information between either a Web Server or a J2EE Container and the Reports Server, enabling you to run a report dynamically from your Web browser.
row